| Param | Original file | Final file |
|---|---|---|
| Filename | modeM0/AS1G05_178T01_9000000692cztM0_level2.fits | modeM0/AS1G05_178T01_9000000692cztM0_level2_quad_clean.evt |
| Size (bytes) | 53,435,520 | 48,280,320 |
| Size | 51.0 MB | 46.0 MB |
| Events in quadrant A | 321,848 | 278,449 |
| Events in quadrant B | 307,334 | 276,807 |
| Events in quadrant C | 319,876 | 266,484 |
| Events in quadrant D | 269,532 | 239,938 |
| Mode M0 | |||
|---|---|---|---|
| Quadrant | BADHDUFLAG | Total packets | Discarded packets |
| A | 0 | 12253 | 0 |
| B | 0 | 13541 | 0 |
| C | 0 | 11955 | 0 |
| D | 0 | 15644 | 0 |
| Mode M9 | |||
|---|---|---|---|
| Quadrant | BADHDUFLAG | Total packets | Discarded packets |
| A | 0 | 13 | 0 |
| B | 0 | 13 | 0 |
| C | 0 | 13 | 0 |
| D | 0 | 13 | 0 |
| Mode SS | |||
|---|---|---|---|
| Quadrant | BADHDUFLAG | Total packets | Discarded packets |
| A | 0 | 116 | 0 |
| B | 0 | 120 | 0 |
| C | 0 | 114 | 0 |
| D | 0 | 118 | 0 |
| Quadrant | Total seconds | Saturated seconds | Saturation percentage |
|---|---|---|---|
| A | 5728 | 78 | 1.361732% |
| B | 5706 | 175 | 3.066947% |
| C | 5724 | 48 | 0.838574% |
| D | 5709 | 222 | 3.888597% |
Noise dominated data is calculated using 1-second bins in cleaned event files. If a bin has >2000 counts, and if more than 50% of those come from <1% of pixels, then it is considered to be noise-dominated and hence unusable.
| Quadrant | # 1 sec bins | Bins with >0 counts | Bins with >2000 counts | High rate bins dominated by noise | Noise dominated (total time) | Noise dominated (detector-on time) | Marked lightcurve |
|---|---|---|---|---|---|---|---|
| A | 7032 | 5825 | 0 | 0 | 0.00% | 0.00% | 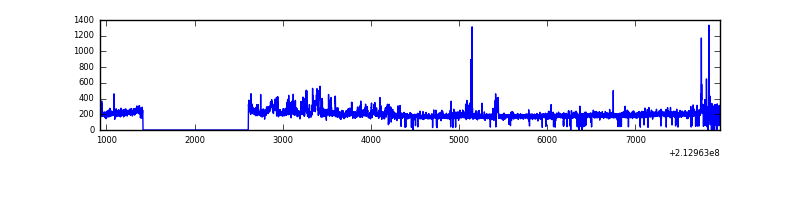 |
| B | 7032 | 5820 | 0 | 0 | 0.00% | 0.00% | 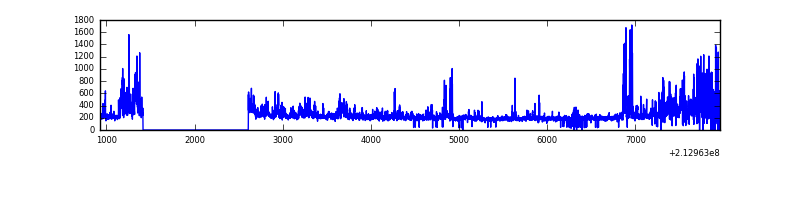 |
| C | 7032 | 5826 | 0 | 0 | 0.00% | 0.00% |  |
| D | 7032 | 5822 | 0 | 0 | 0.00% | 0.00% |  |
Top three noisy pixels from each quadrant. If the there are fewer than three noisy pixels in the level2.evt file, extra rows are filled as -1
| Pixel properties | Quadrant properties | ||||||
|---|---|---|---|---|---|---|---|
| Quadrant | DetID | PixID | Counts | Sigma | Mean | Median | Sigma |
| A | 14 | 188 | 334 | 10.79 | 83 | 78 | 23.7 |
| A | 0 | 29 | 303 | 9.48 | 83 | 78 | 23.7 |
| A | 9 | 19 | 260 | 7.67 | 83 | 78 | 23.7 |
| B | 2 | 9 | 274 | 10.65 | 81 | 77 | 18.5 |
| B | 2 | 8 | 228 | 8.16 | 81 | 77 | 18.5 |
| B | 12 | 226 | 228 | 8.16 | 81 | 77 | 18.5 |
| C | 1 | 81 | 245 | 6.9 | 84 | 78 | 24.2 |
| C | 9 | 188 | 234 | 6.45 | 84 | 78 | 24.2 |
| C | 1 | 65 | 232 | 6.36 | 84 | 78 | 24.2 |
| D | 11 | 82 | 202 | 5.93 | 76 | 69 | 22.4 |
| D | 6 | 38 | 199 | 5.79 | 76 | 69 | 22.4 |
| D | 1 | 31 | 196 | 5.66 | 76 | 69 | 22.4 |
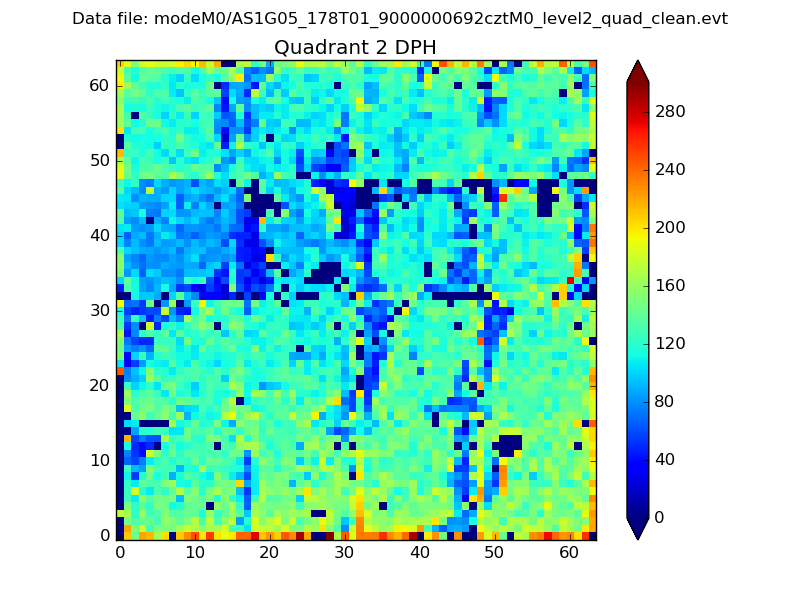
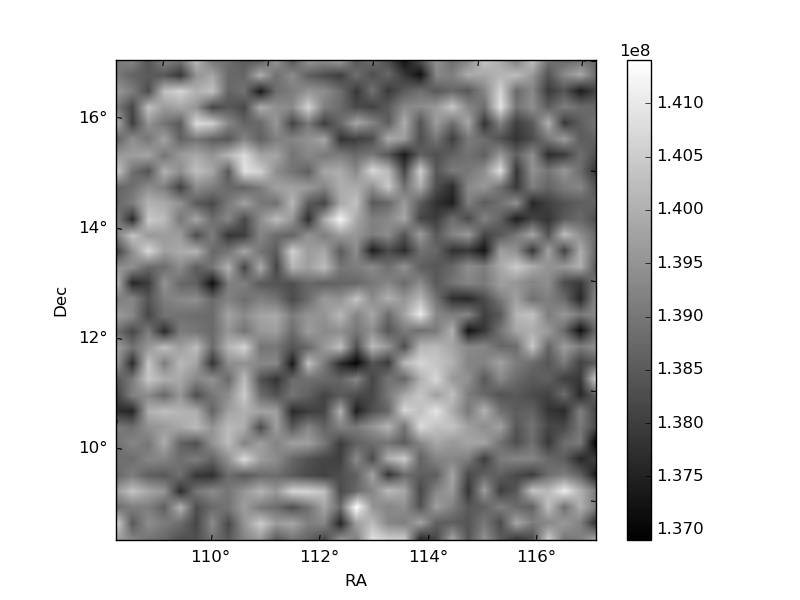
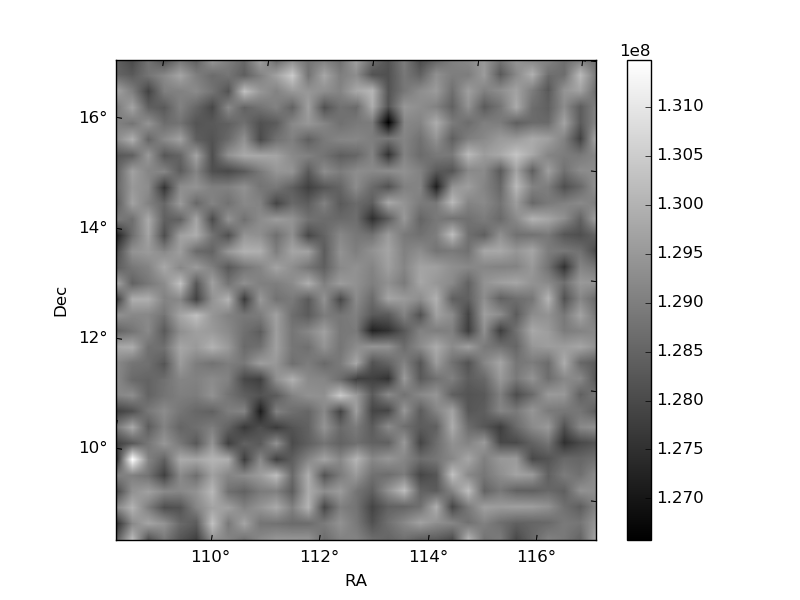
Histogram calculated using DETX and DETY for each event in the final _common_clean file
| Quadrant A | 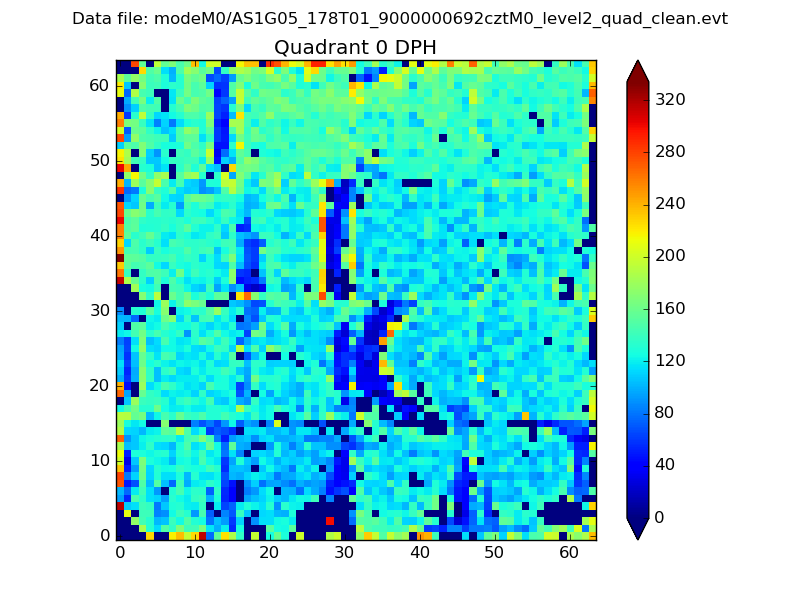 |
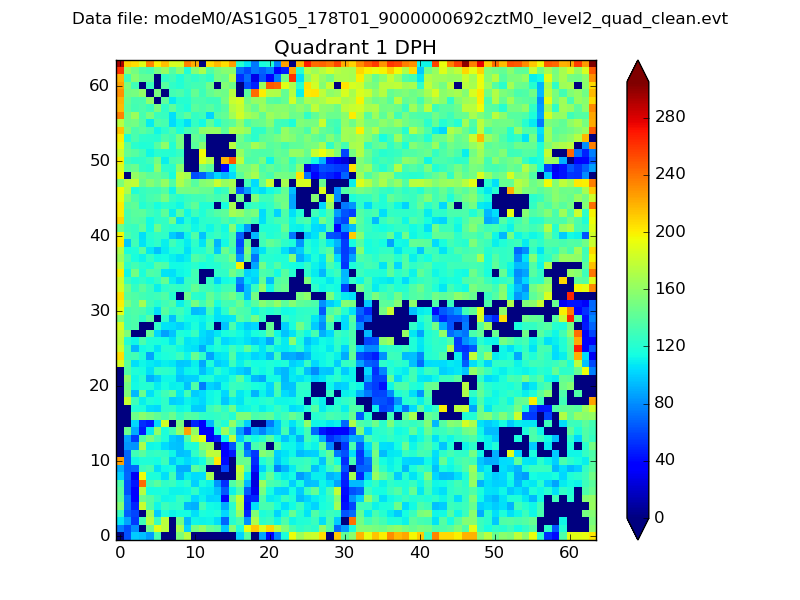 |
Quadrant B |
|---|---|---|---|
| Quadrant D | 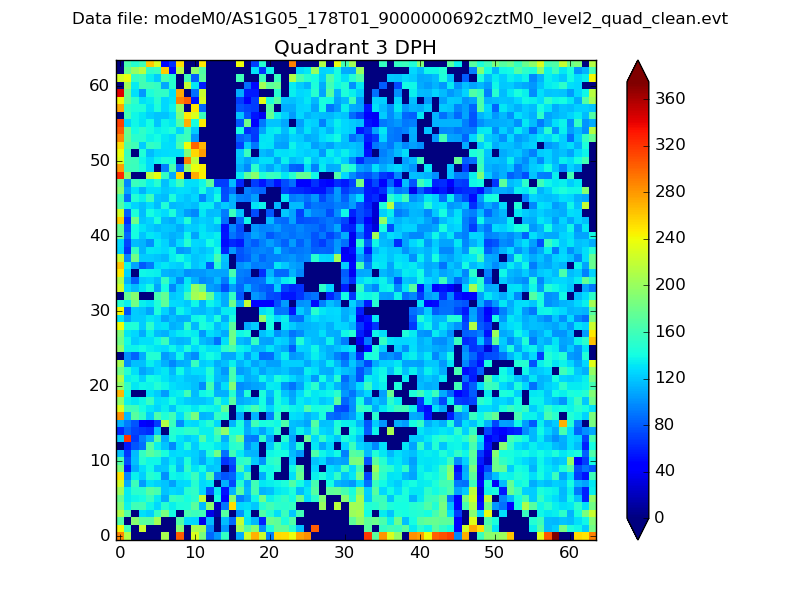 |
 |
Quadrant C |
| Plot type | Count rate plots | Images |
|---|---|---|
| Comparison with Poisson distribution Blue bars denote a histogram of data divided into 1 sec bins. Red curve is a Poisson curve with rate = median count rate of data. |
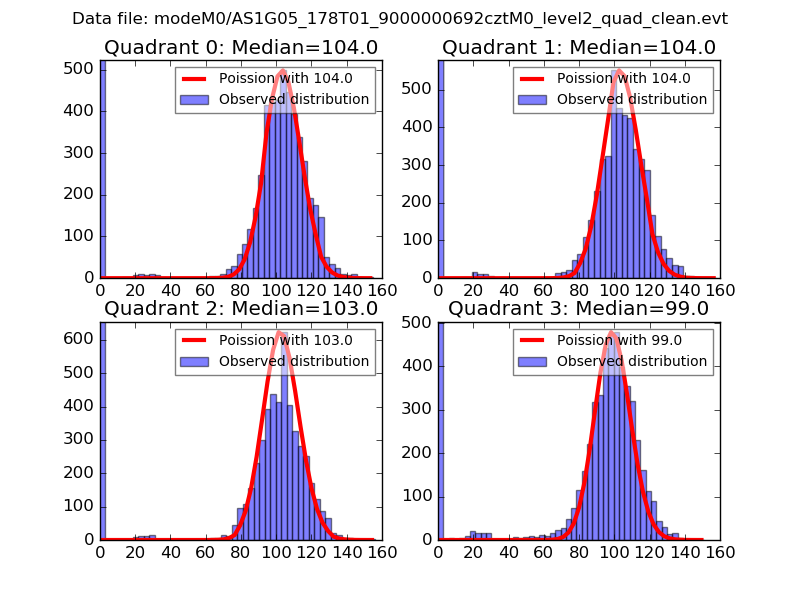 |
 |
| Quadrant-wise count rates Data is divided into 100 sec bins |
 |
|
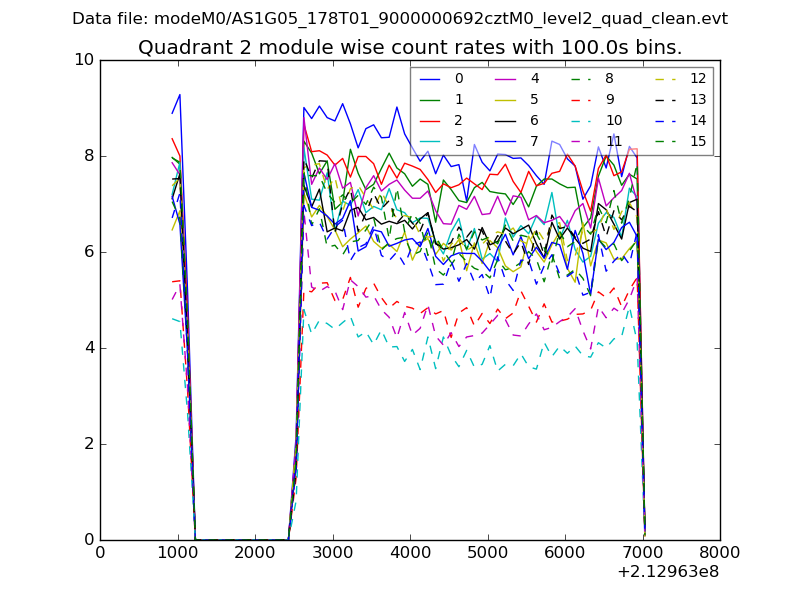
| Module-wise count rates for Quadrant A Data is divided into 100 sec bins |
 |
 |
| Module-wise count rates for Quadrant B Data is divided into 100 sec bins |
 |
 |
| Module-wise count rates for Quadrant C Data is divided into 100 sec bins |
 |
 |
| Module-wise count rates for Quadrant D Data is divided into 100 sec bins |
 |
 |
| Parameter | Plot |
|---|---|
| CZT HV Monitor |  |
| D_VDD | 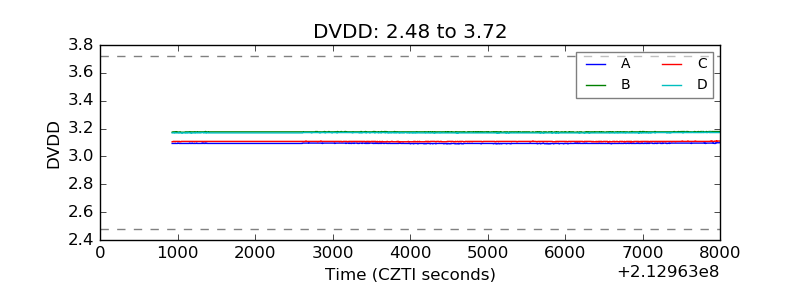 |
| Temperature 1 | 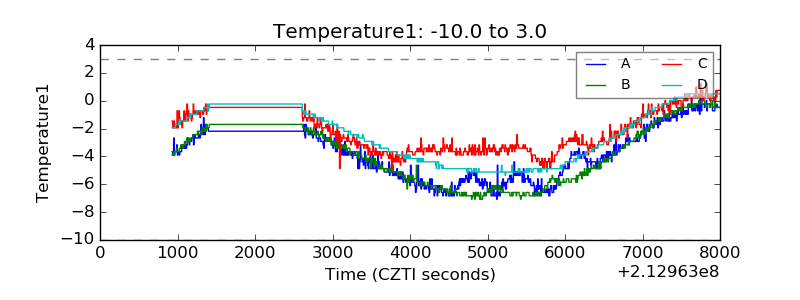 |
| Veto HV Monitor | 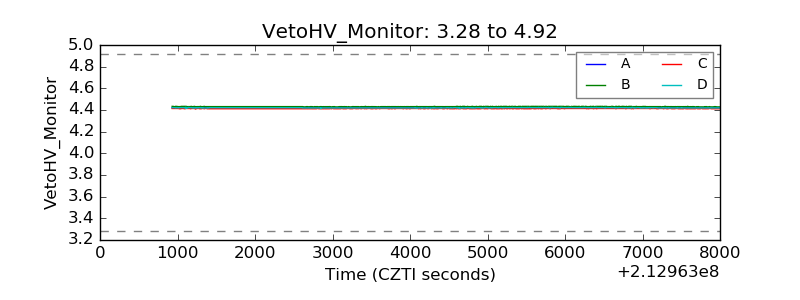 |
| Veto LLD |  |
| Alpha Counter |  |
| _CPM_Rate |  |
| CZT Counter | 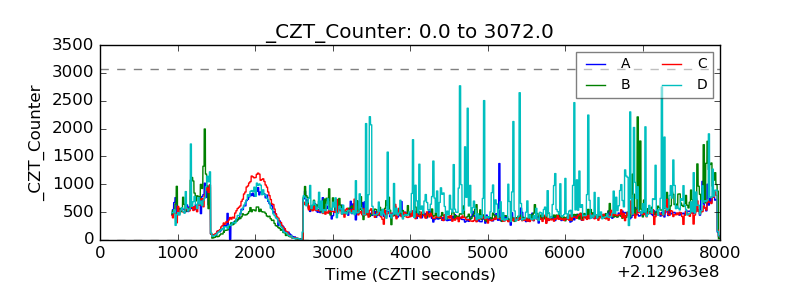 |
| +2.5 Volts monitor |  |
| +5 Volts monitor | 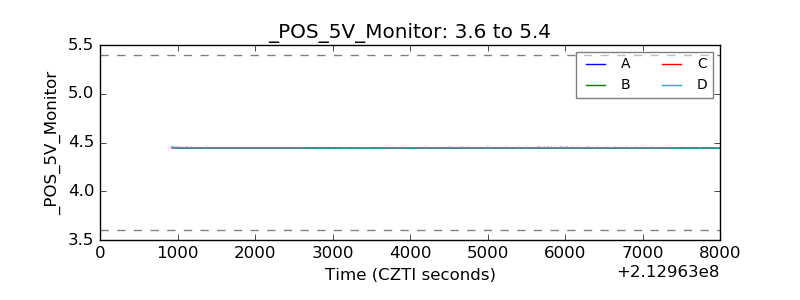 |
| _ROLL_ROT |  |
| _Roll_DEC | 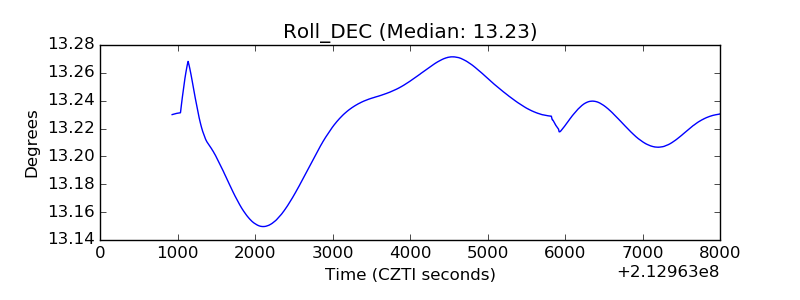 |
| _Roll_RA | 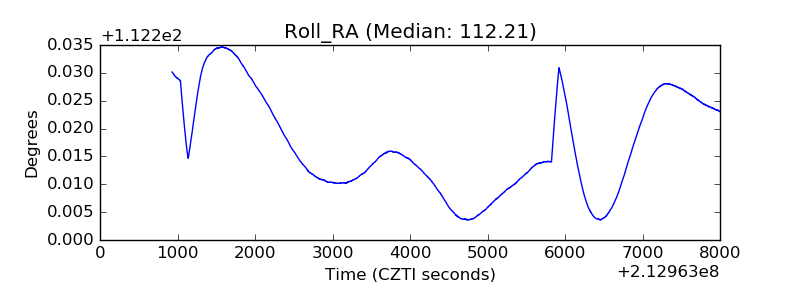 |
| Veto Counter |  |