| Param | Original file | Final file |
|---|---|---|
| Filename | modeM0/AS1G05_178T01_9000000692_05458cztM0_level2.evt | modeM0/AS1G05_178T01_9000000692_05458cztM0_level2_quad_clean.evt |
| Size (bytes) | 150,390,720 | 15,788,160 |
| Size | 143.4 MB | 15.1 MB |
| Events in quadrant A | 1,052,343 | 86,281 |
| Events in quadrant B | 1,162,835 | 86,864 |
| Events in quadrant C | 1,001,760 | 85,780 |
| Events in quadrant D | 1,208,348 | 82,125 |
| Mode M0 | |||
|---|---|---|---|
| Quadrant | BADHDUFLAG | Total packets | Discarded packets |
| A | 0 | 4322 | 2 |
| B | 0 | 4634 | 1 |
| C | 0 | 4130 | 1 |
| D | 0 | 4838 | 1 |
| Mode M9 | |||
|---|---|---|---|
| Quadrant | BADHDUFLAG | Total packets | Discarded packets |
| A | 0 | 12 | 0 |
| B | 0 | 12 | 0 |
| C | 0 | 12 | 0 |
| D | 0 | 12 | 0 |
| Mode SS | |||
|---|---|---|---|
| Quadrant | BADHDUFLAG | Total packets | Discarded packets |
| A | 0 | 38 | 0 |
| B | 0 | 38 | 0 |
| C | 0 | 38 | 0 |
| D | 0 | 38 | 0 |
| Quadrant | Total seconds | Saturated seconds | Saturation percentage |
|---|---|---|---|
| A | 1871 | 54 | 2.886157% |
| B | 1871 | 82 | 4.382683% |
| C | 1871 | 32 | 1.710315% |
| D | 1871 | 62 | 3.313736% |
Noise dominated data is calculated using 1-second bins in cleaned event files. If a bin has >2000 counts, and if more than 50% of those come from <1% of pixels, then it is considered to be noise-dominated and hence unusable.
| Quadrant | # 1 sec bins | Bins with >0 counts | Bins with >2000 counts | High rate bins dominated by noise | Noise dominated (total time) | Noise dominated (detector-on time) | Marked lightcurve |
|---|---|---|---|---|---|---|---|
| A | 3066 | 1872 | 0 | 0 | 0.00% | 0.00% | 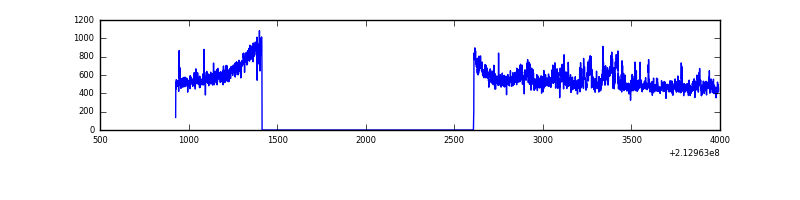 |
| B | 3066 | 1872 | 1 | 1 | 0.03% | 0.05% | 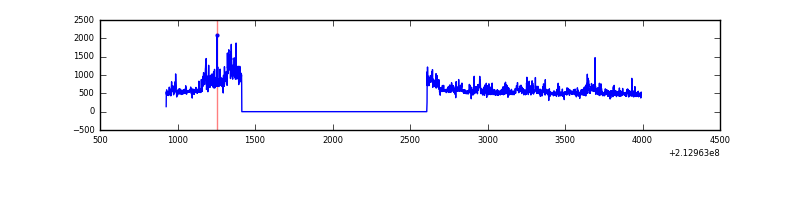 |
| C | 3066 | 1872 | 0 | 0 | 0.00% | 0.00% | 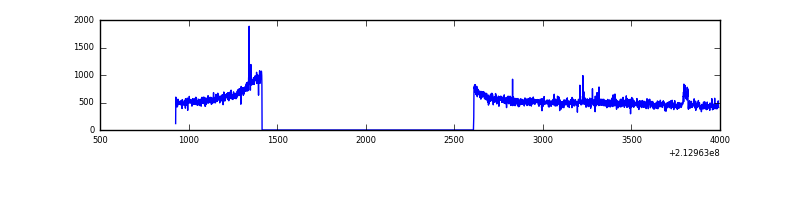 |
| D | 3066 | 1872 | 30 | 30 | 0.98% | 1.60% | 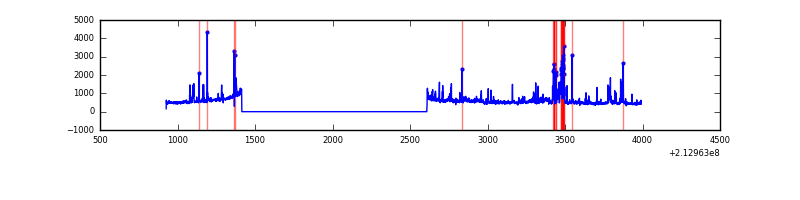 |
Top three noisy pixels from each quadrant. If the there are fewer than three noisy pixels in the level2.evt file, extra rows are filled as -1
| Pixel properties | Quadrant properties | ||||||
|---|---|---|---|---|---|---|---|
| Quadrant | DetID | PixID | Counts | Sigma | Mean | Median | Sigma |
| A | 13 | 251 | 54489 | 979.22 | 256 | 250 | 55.4 |
| A | 13 | 6 | 4614 | 78.79 | 256 | 250 | 55.4 |
| A | 12 | 194 | 2530 | 41.16 | 256 | 250 | 55.4 |
| B | 15 | 204 | 75535 | 1438.53 | 257 | 251 | 52.3 |
| B | 10 | 16 | 52103 | 990.79 | 257 | 251 | 52.3 |
| B | 11 | 51 | 19340 | 364.75 | 257 | 251 | 52.3 |
| C | 14 | 67 | 16658 | 268.29 | 250 | 251 | 61.2 |
| C | 9 | 247 | 4502 | 69.51 | 250 | 251 | 61.2 |
| C | 12 | 4 | 3937 | 60.27 | 250 | 251 | 61.2 |
| D | 2 | 33 | 159025 | 2494.91 | 248 | 240 | 63.6 |
| D | 2 | 136 | 34527 | 538.73 | 248 | 240 | 63.6 |
| D | 2 | 152 | 26823 | 417.68 | 248 | 240 | 63.6 |
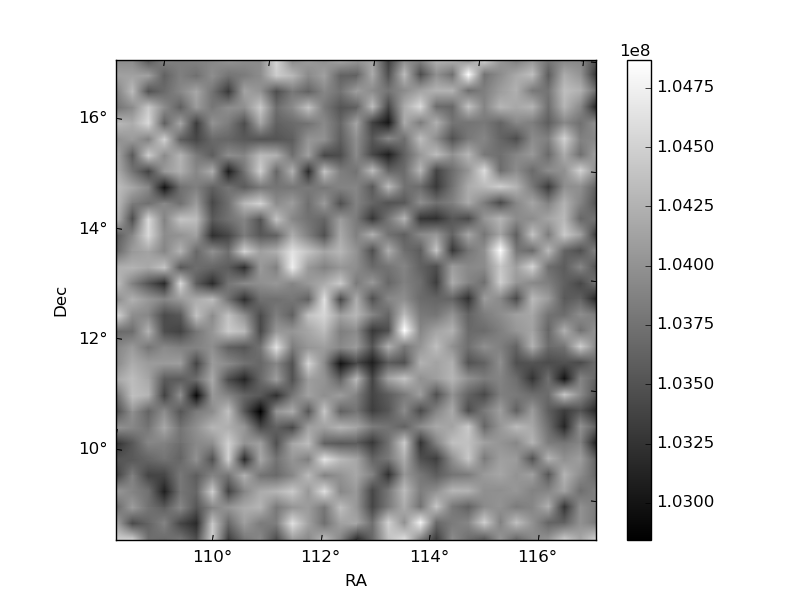
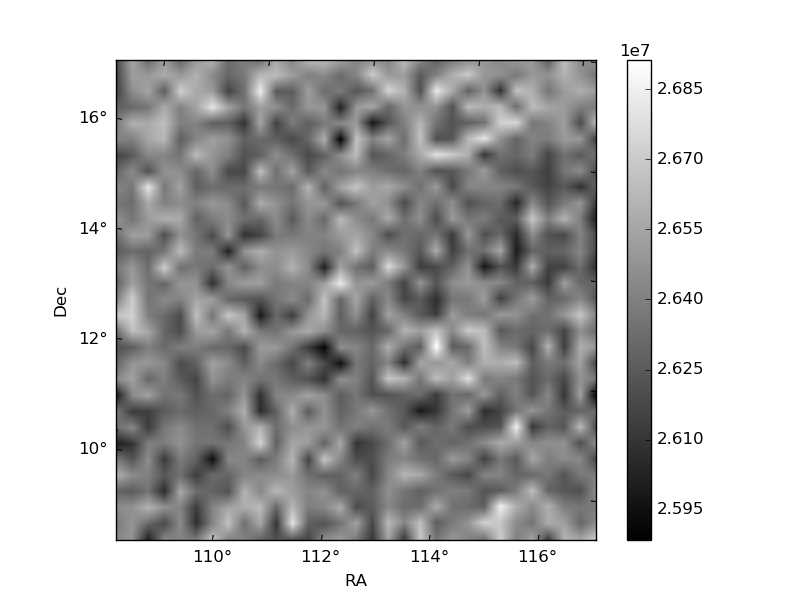
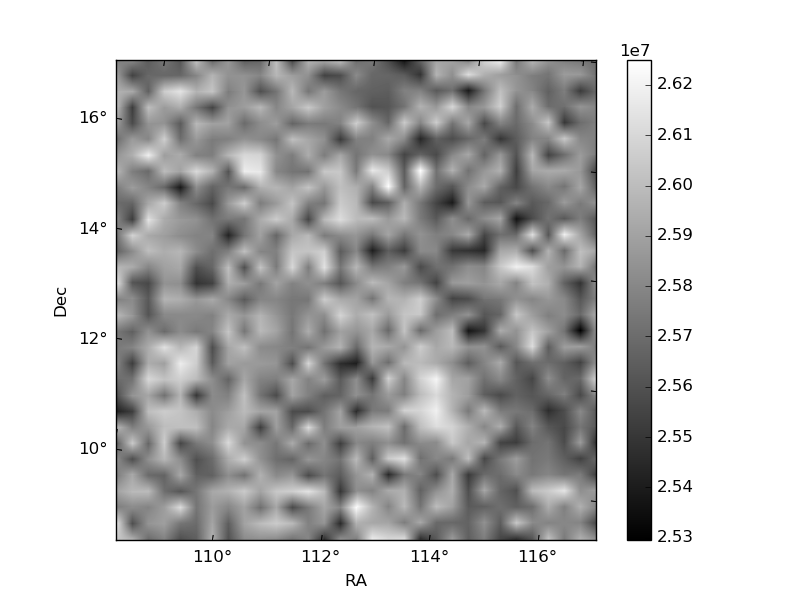
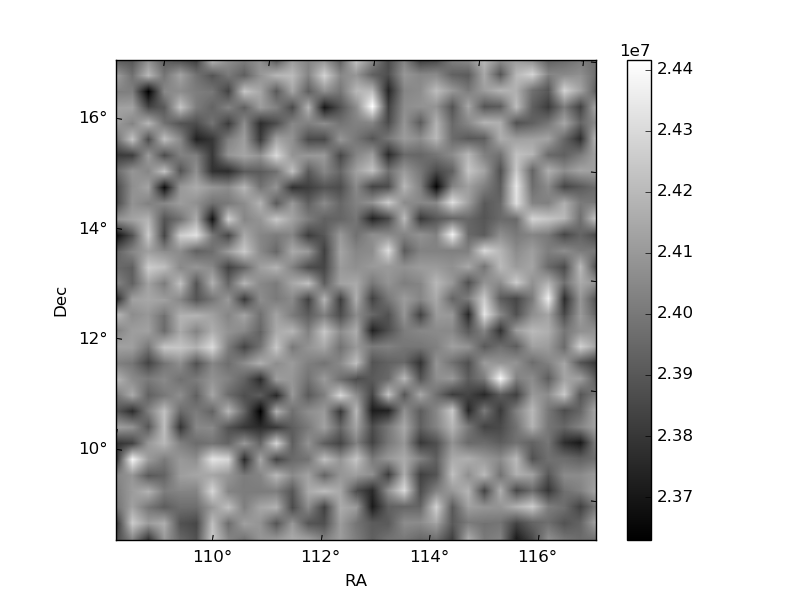
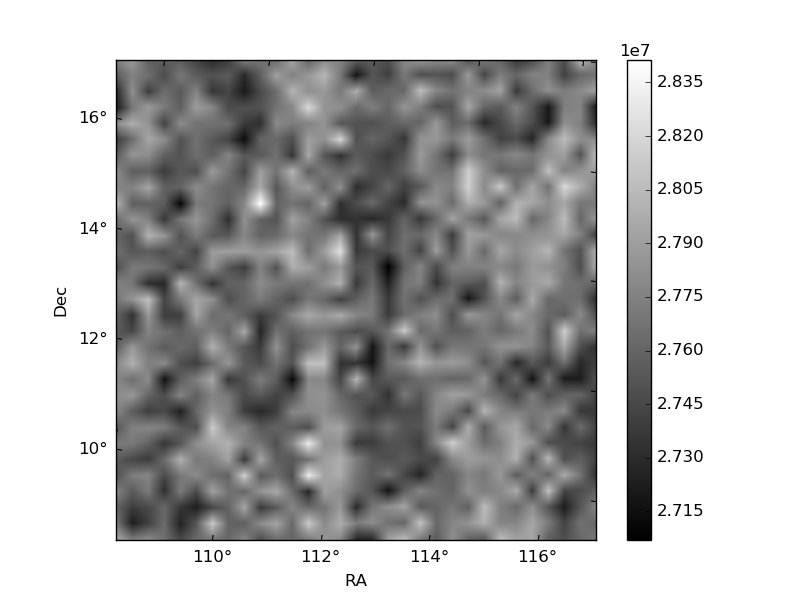
Histogram calculated using DETX and DETY for each event in the final _common_clean file
| Quadrant A | 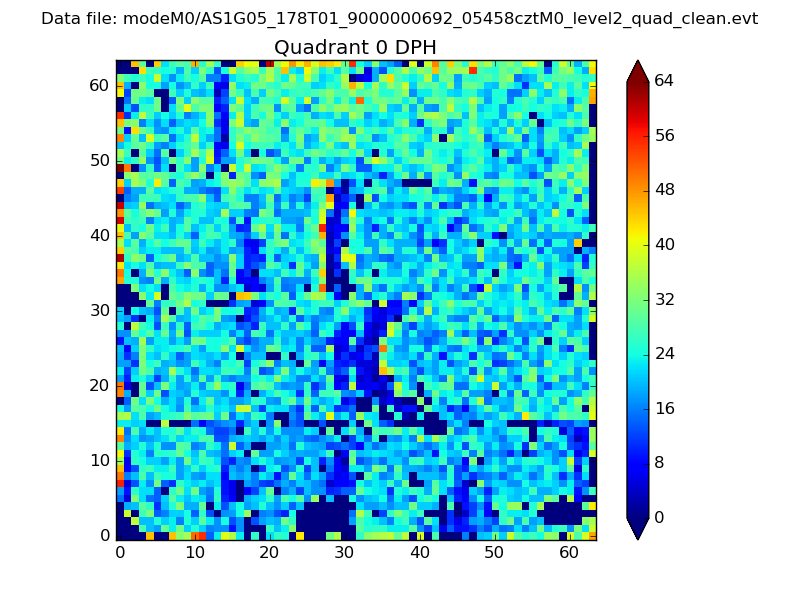 |
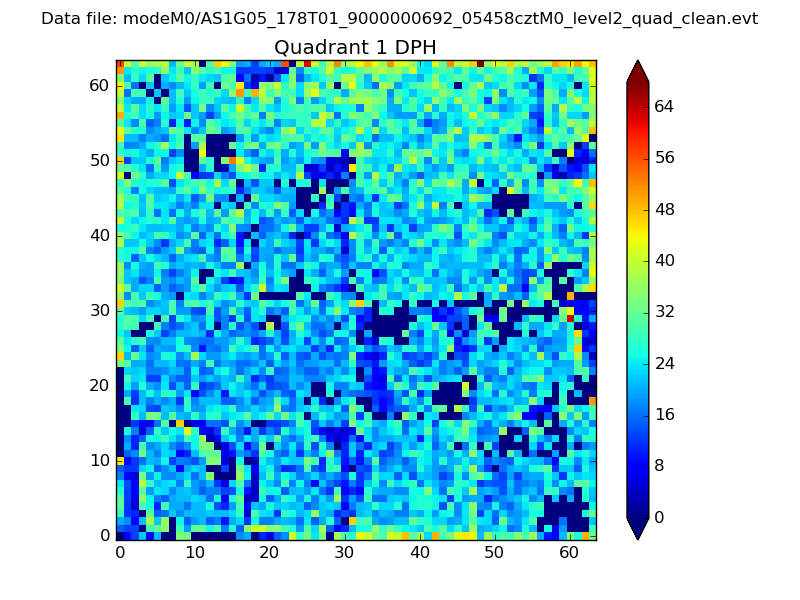 |
Quadrant B |
|---|---|---|---|
| Quadrant D | 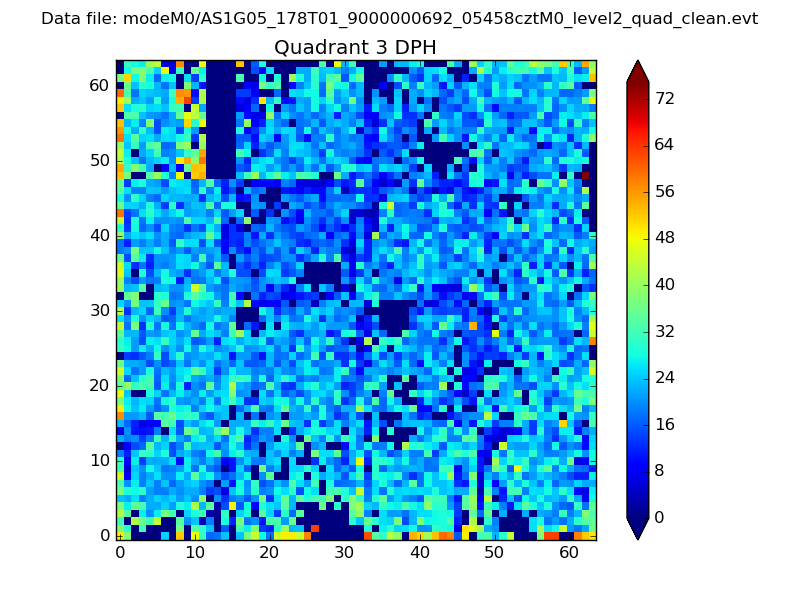 |
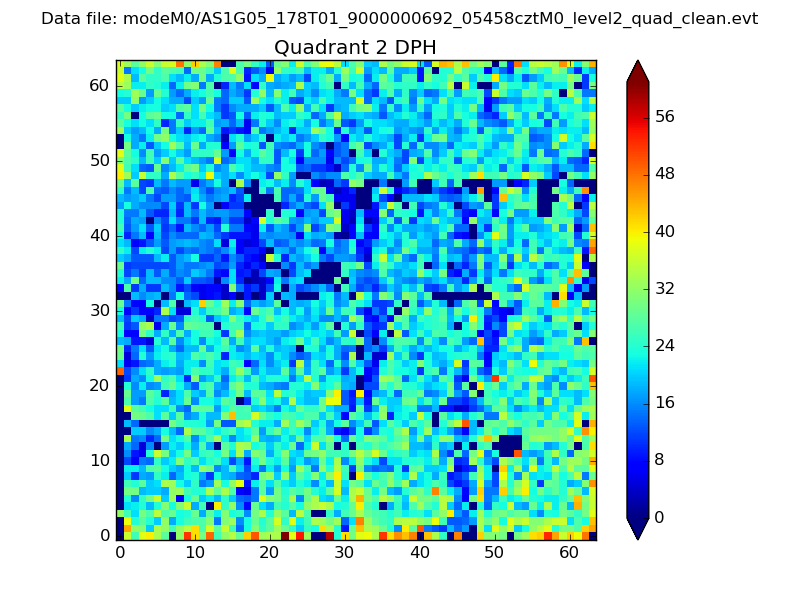 |
Quadrant C |
| Plot type | Count rate plots | Images |
|---|---|---|
| Comparison with Poisson distribution Blue bars denote a histogram of data divided into 1 sec bins. Red curve is a Poisson curve with rate = median count rate of data. |
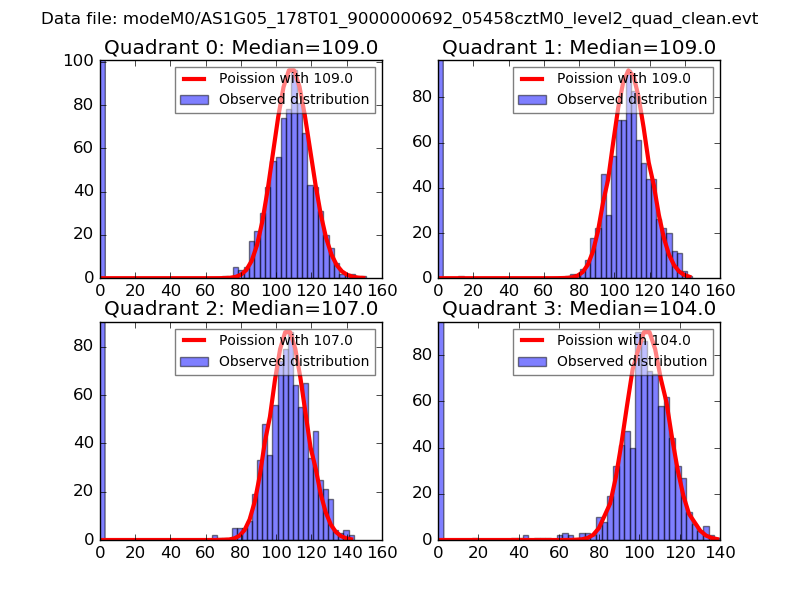 |
 |
| Quadrant-wise count rates Data is divided into 100 sec bins |
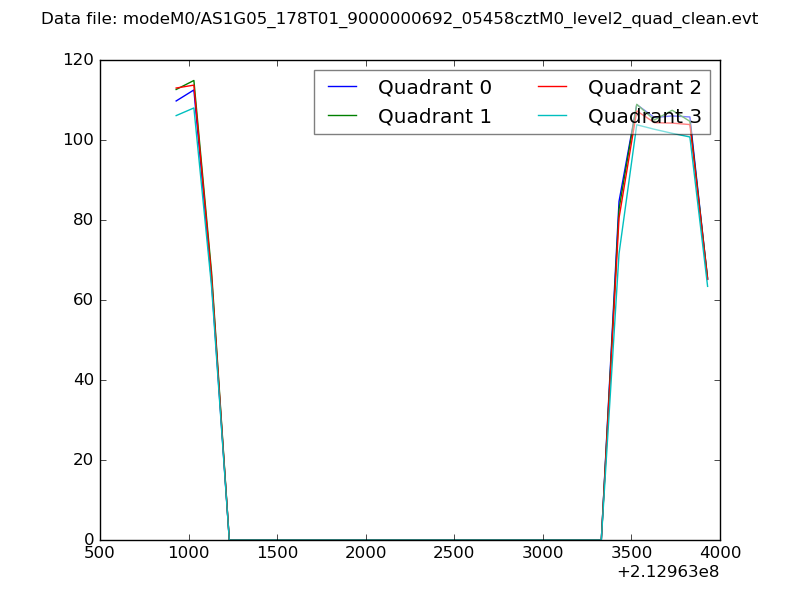 |
|
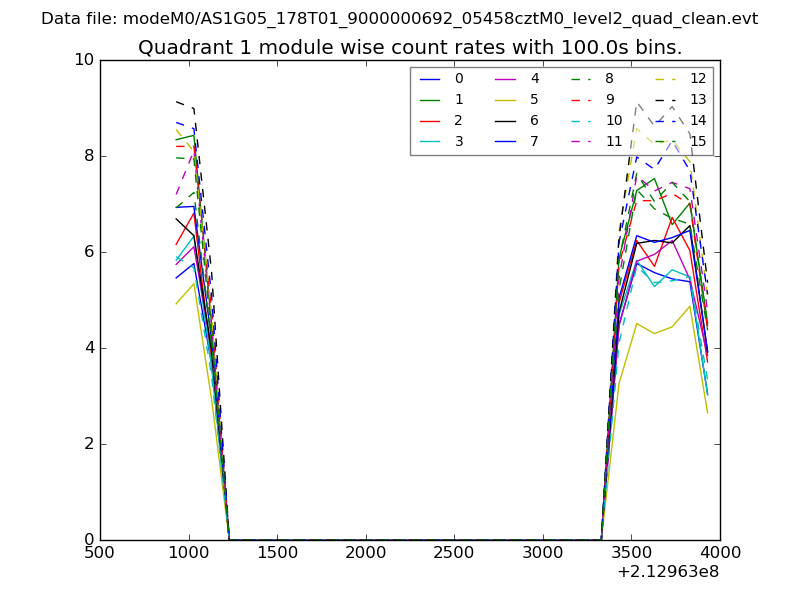
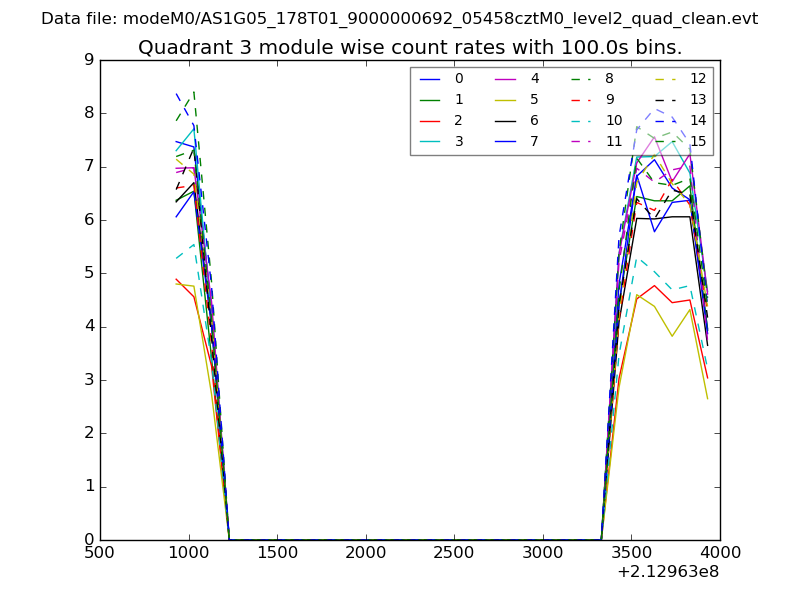
| Module-wise count rates for Quadrant A Data is divided into 100 sec bins |
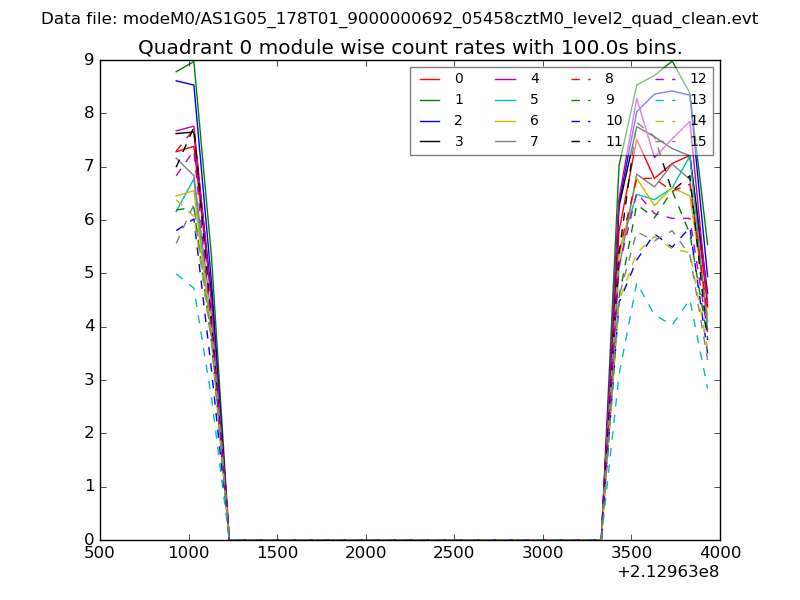 |
 |
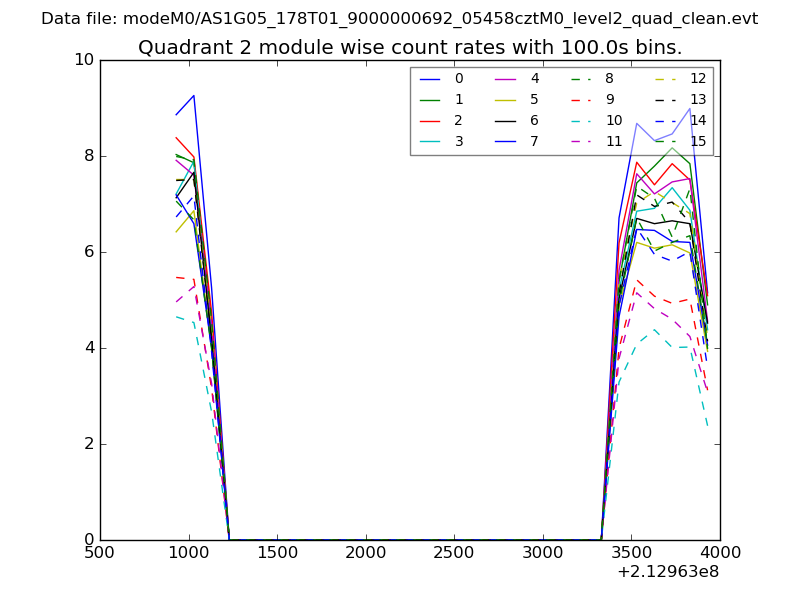
| Module-wise count rates for Quadrant B Data is divided into 100 sec bins |
 |
 |
| Module-wise count rates for Quadrant C Data is divided into 100 sec bins |
 |
 |
| Module-wise count rates for Quadrant D Data is divided into 100 sec bins |
 |
 |
| Parameter | Plot |
|---|---|
| CZT HV Monitor | 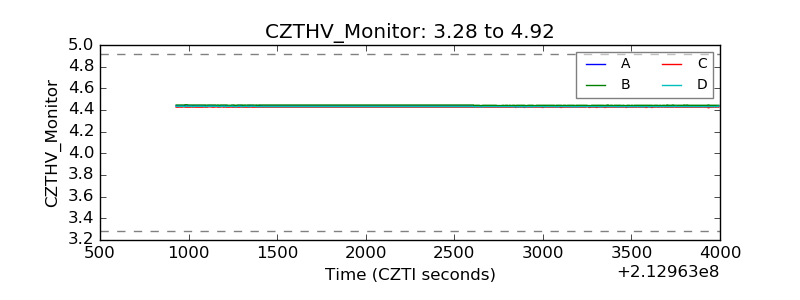 |
| D_VDD | 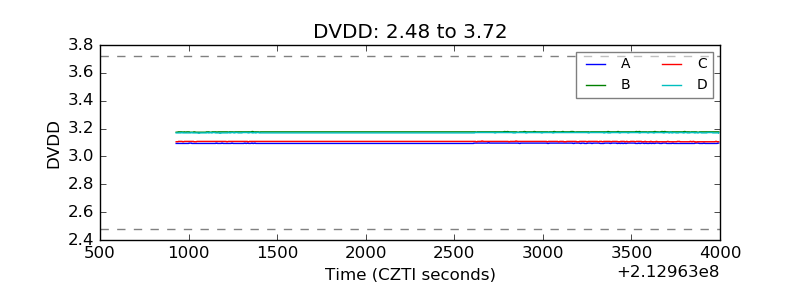 |
| Temperature 1 | 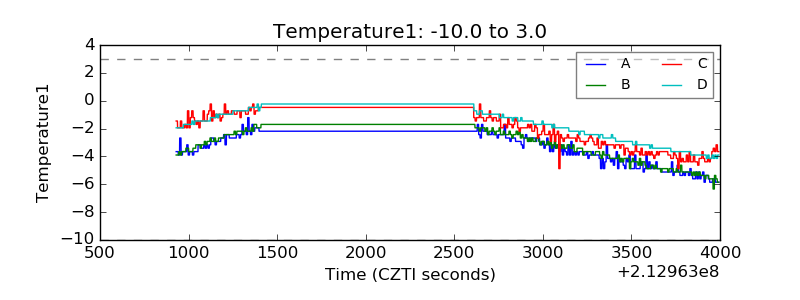 |
| Veto HV Monitor | 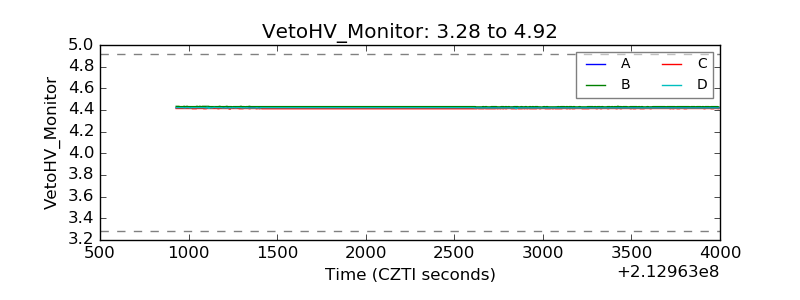 |
| Veto LLD | 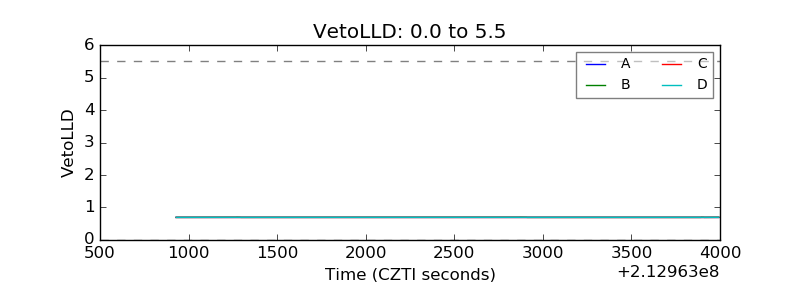 |
| Alpha Counter | 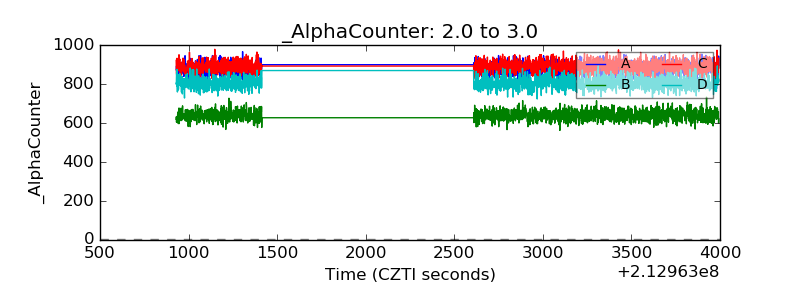 |
| _CPM_Rate | 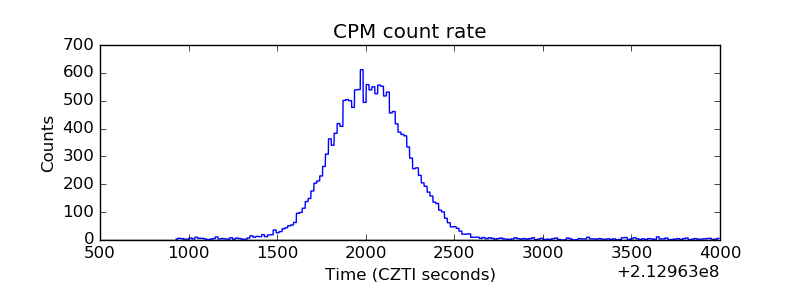 |
| CZT Counter | 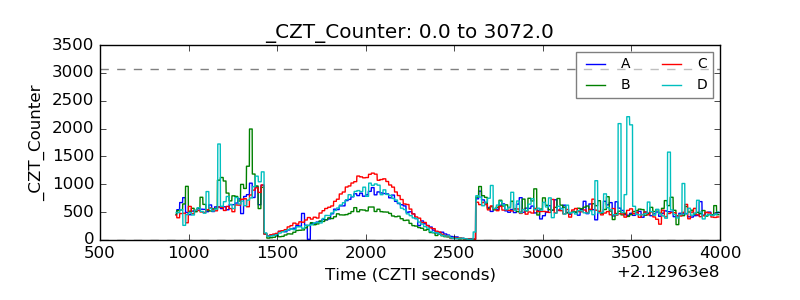 |
| +2.5 Volts monitor | 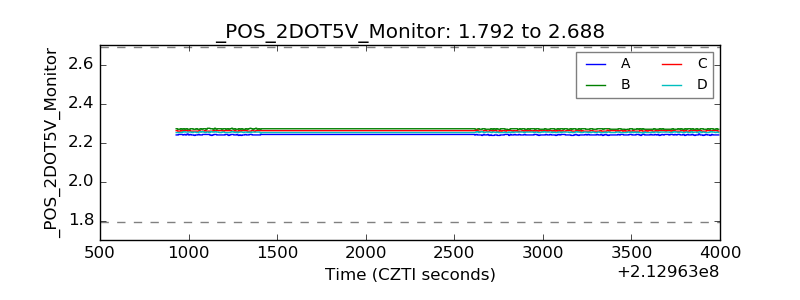 |
| +5 Volts monitor |  |
| _ROLL_ROT | 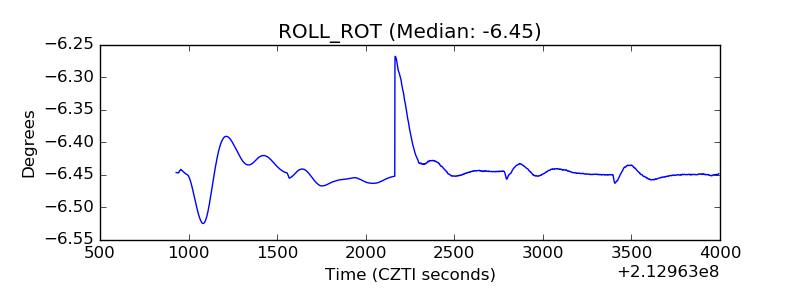 |
| _Roll_DEC | 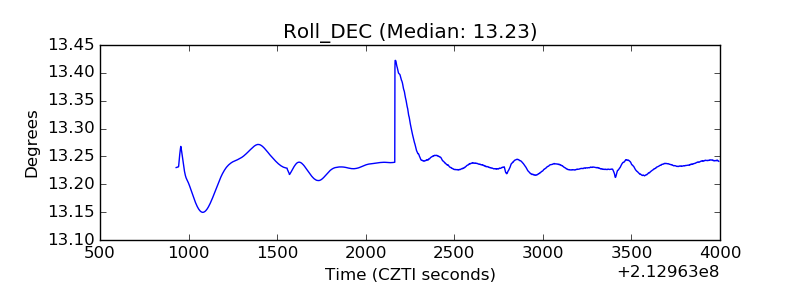 |
| _Roll_RA | 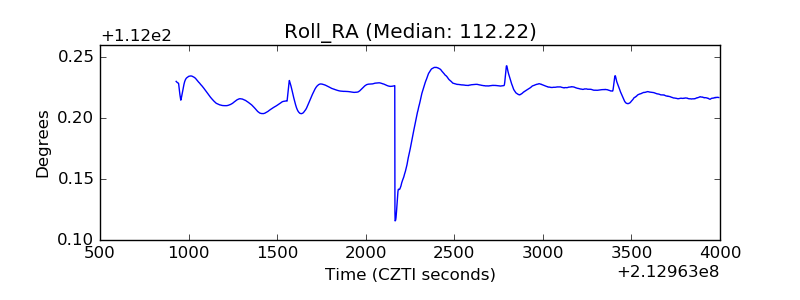 |
| Veto Counter | 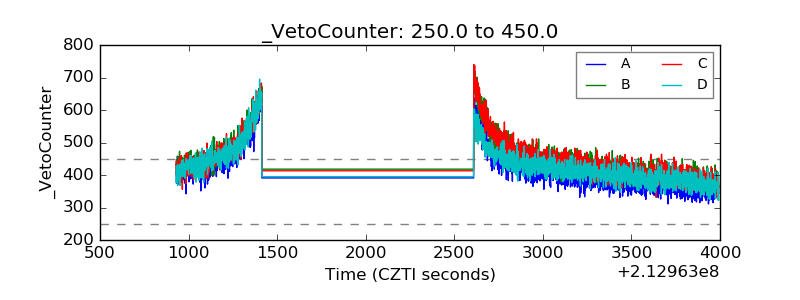 |