| Param | Original file | Final file |
|---|---|---|
| Filename | modeM0/AS1G05_178T01_9000000692_05459cztM0_level2.evt | modeM0/AS1G05_178T01_9000000692_05459cztM0_level2_quad_clean.evt |
| Size (bytes) | 382,720,320 | 58,760,640 |
| Size | 365.0 MB | 56.0 MB |
| Events in quadrant A | 2,445,742 | 360,723 |
| Events in quadrant B | 2,845,021 | 358,880 |
| Events in quadrant C | 2,342,410 | 355,630 |
| Events in quadrant D | 3,602,262 | 338,441 |
| Mode M0 | |||
|---|---|---|---|
| Quadrant | BADHDUFLAG | Total packets | Discarded packets |
| A | 0 | 11275 | 286 |
| B | 0 | 12535 | 441 |
| C | 0 | 10976 | 279 |
| D | 0 | 14763 | 497 |
| Mode M9 | |||
|---|---|---|---|
| Quadrant | BADHDUFLAG | Total packets | Discarded packets |
| A | 0 | 5 | 0 |
| B | 0 | 5 | 0 |
| C | 0 | 5 | 0 |
| D | 0 | 6 | 0 |
| Mode SS | |||
|---|---|---|---|
| Quadrant | BADHDUFLAG | Total packets | Discarded packets |
| A | 0 | 108 | 4 |
| B | 0 | 108 | 0 |
| C | 0 | 107 | 5 |
| D | 0 | 108 | 2 |
| Quadrant | Total seconds | Saturated seconds | Saturation percentage |
|---|---|---|---|
| A | 5227 | 35 | 0.669600% |
| B | 5210 | 109 | 2.092131% |
| C | 5223 | 19 | 0.363776% |
| D | 5212 | 185 | 3.549501% |
Noise dominated data is calculated using 1-second bins in cleaned event files. If a bin has >2000 counts, and if more than 50% of those come from <1% of pixels, then it is considered to be noise-dominated and hence unusable.
| Quadrant | # 1 sec bins | Bins with >0 counts | Bins with >2000 counts | High rate bins dominated by noise | Noise dominated (total time) | Noise dominated (detector-on time) | Marked lightcurve |
|---|---|---|---|---|---|---|---|
| A | 5350 | 5339 | 1 | 1 | 0.02% | 0.02% | 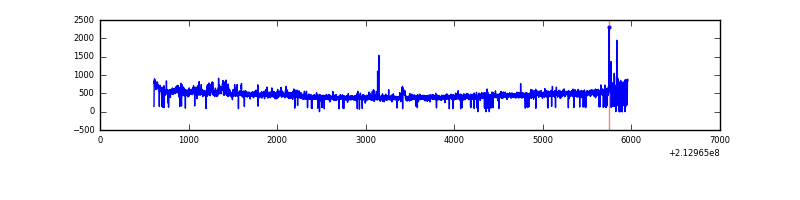 |
| B | 5350 | 5333 | 20 | 20 | 0.37% | 0.38% | 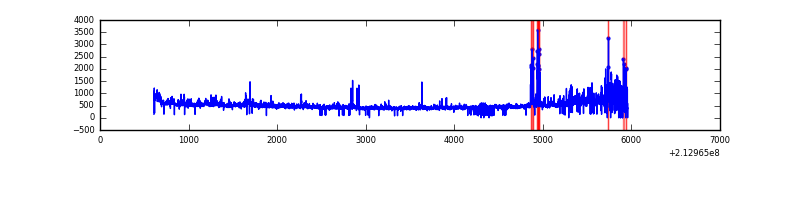 |
| C | 5350 | 5339 | 0 | 0 | 0.00% | 0.00% | 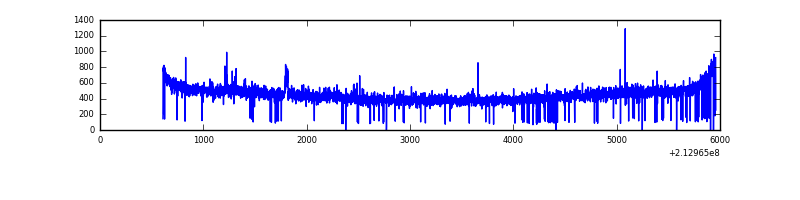 |
| D | 5350 | 5338 | 154 | 154 | 2.88% | 2.88% | 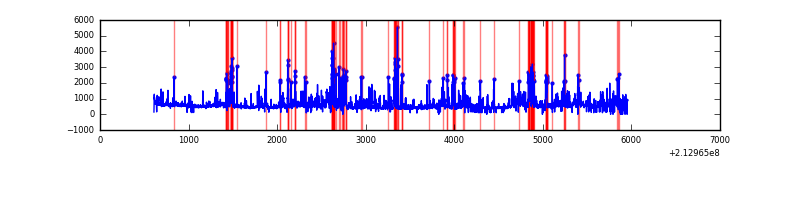 |
Top three noisy pixels from each quadrant. If the there are fewer than three noisy pixels in the level2.evt file, extra rows are filled as -1
| Pixel properties | Quadrant properties | ||||||
|---|---|---|---|---|---|---|---|
| Quadrant | DetID | PixID | Counts | Sigma | Mean | Median | Sigma |
| A | 13 | 251 | 66450 | 524.05 | 606 | 592 | 125.7 |
| A | 0 | 50 | 29243 | 227.98 | 606 | 592 | 125.7 |
| A | 13 | 6 | 9465 | 70.61 | 606 | 592 | 125.7 |
| B | 15 | 204 | 234830 | 2015.83 | 606 | 593 | 116.2 |
| B | 4 | 48 | 98968 | 846.61 | 606 | 593 | 116.2 |
| B | 11 | 51 | 71464 | 609.91 | 606 | 593 | 116.2 |
| C | 14 | 67 | 19613 | 137.8 | 591 | 595 | 138.0 |
| C | 12 | 4 | 5148 | 32.99 | 591 | 595 | 138.0 |
| C | 13 | 61 | 4758 | 30.16 | 591 | 595 | 138.0 |
| D | 2 | 33 | 853845 | 5881.83 | 584 | 565 | 145.1 |
| D | 2 | 136 | 204505 | 1405.8 | 584 | 565 | 145.1 |
| D | 2 | 152 | 83377 | 570.84 | 584 | 565 | 145.1 |
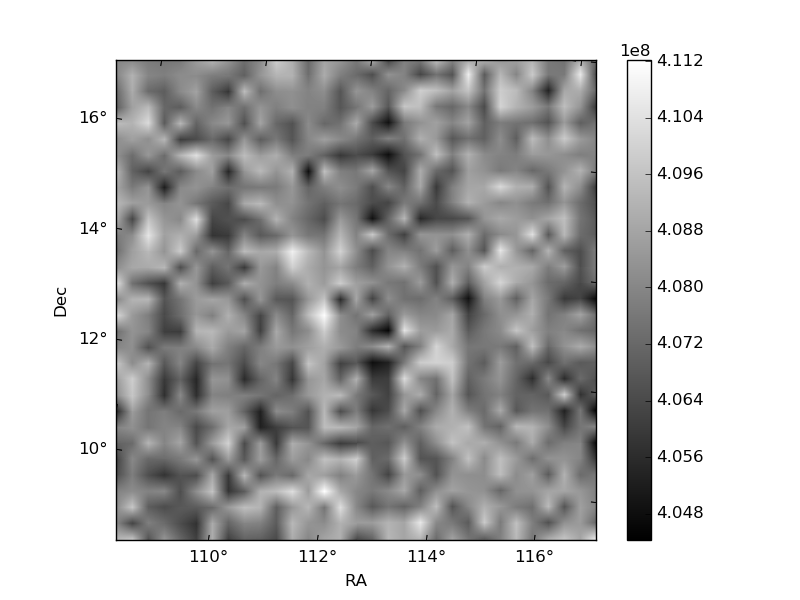
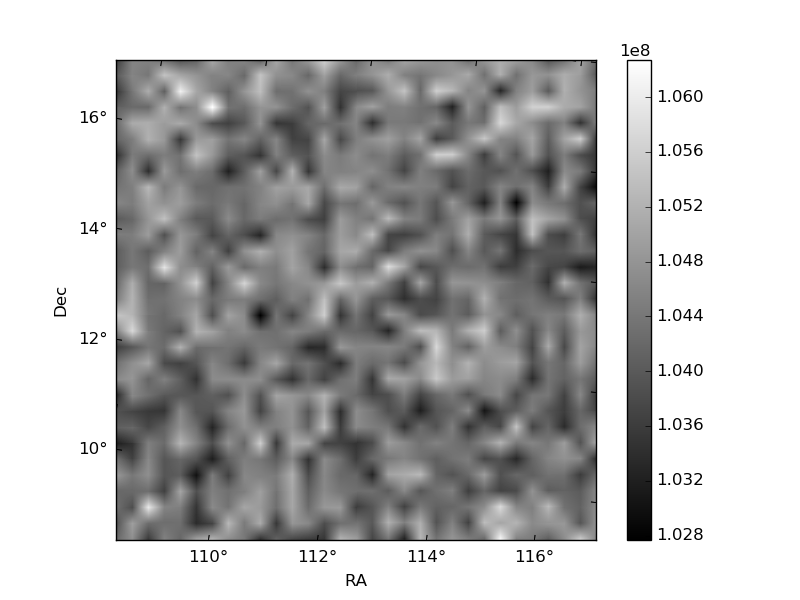
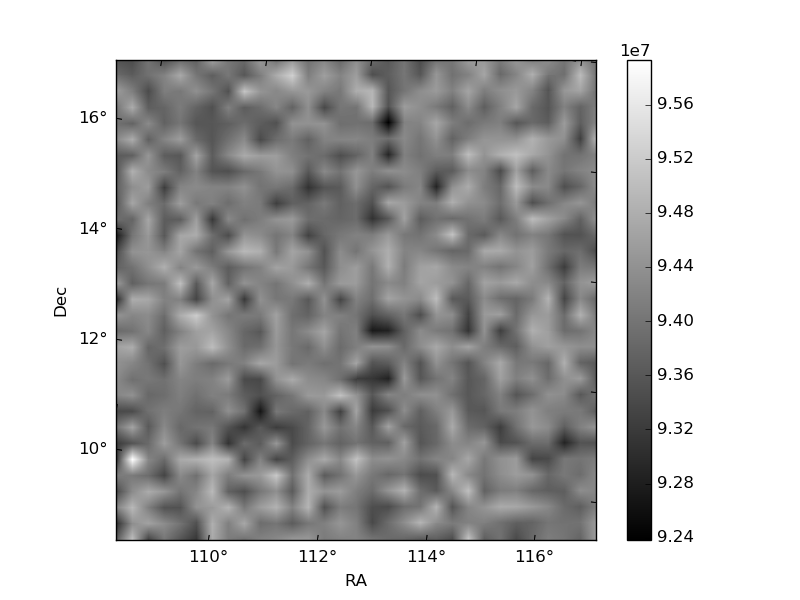
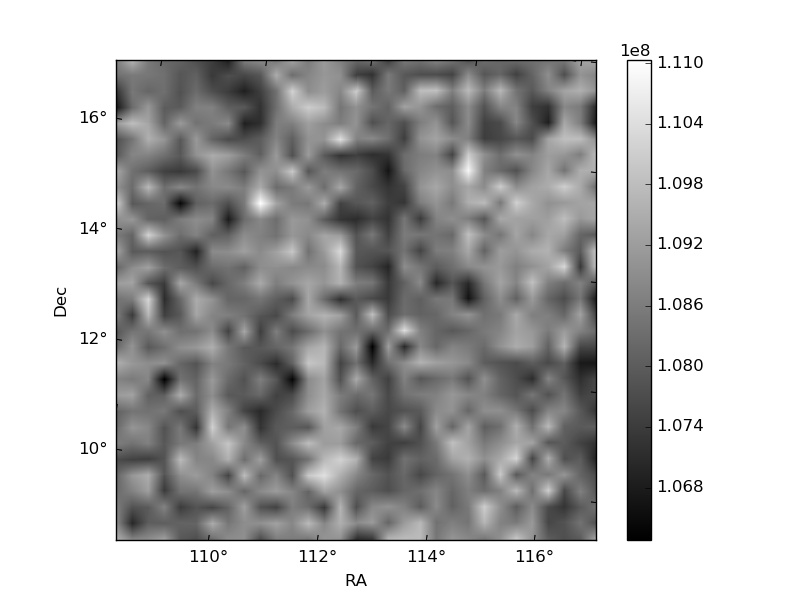
Histogram calculated using DETX and DETY for each event in the final _common_clean file
| Quadrant A | 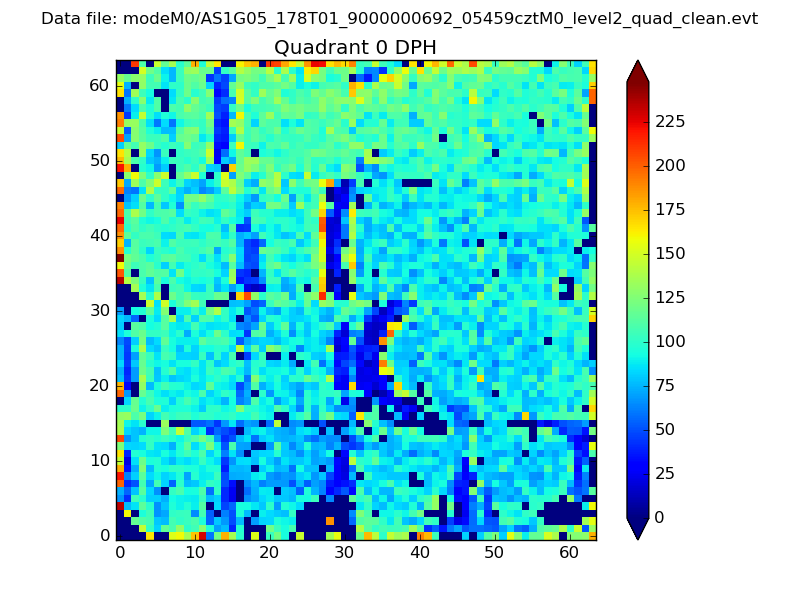 |
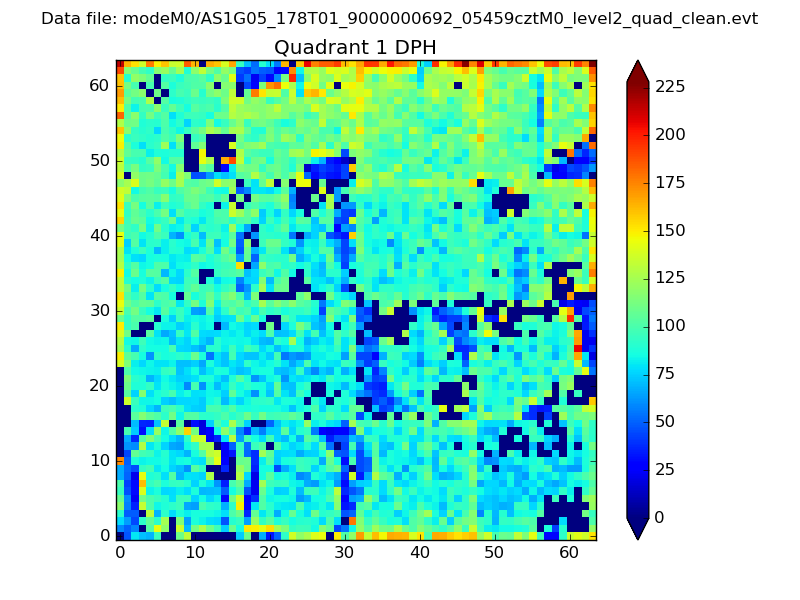 |
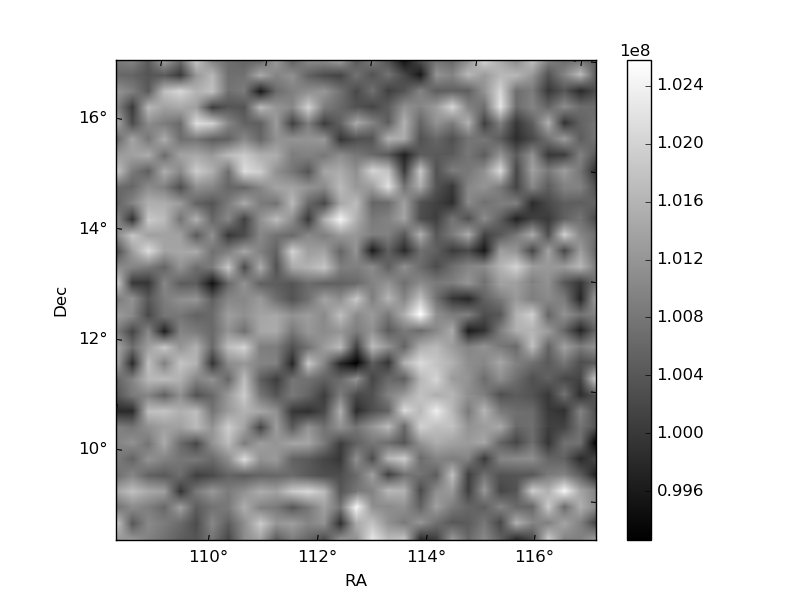
Quadrant B |
|---|---|---|---|
| Quadrant D | 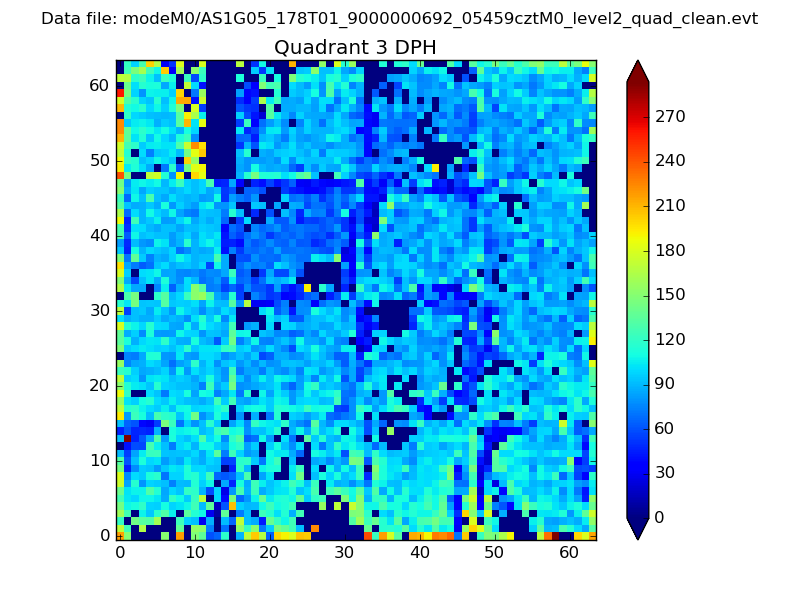 |
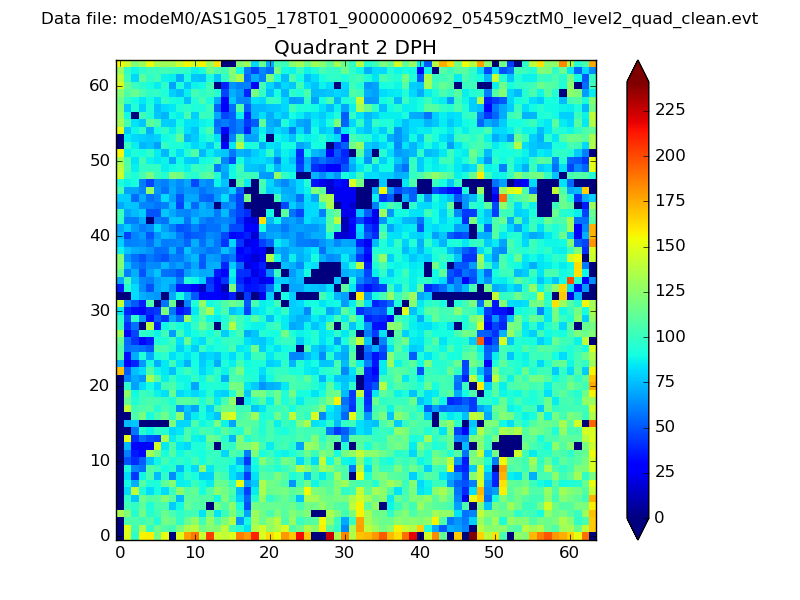 |
Quadrant C |
| Plot type | Count rate plots | Images |
|---|---|---|
| Comparison with Poisson distribution Blue bars denote a histogram of data divided into 1 sec bins. Red curve is a Poisson curve with rate = median count rate of data. |
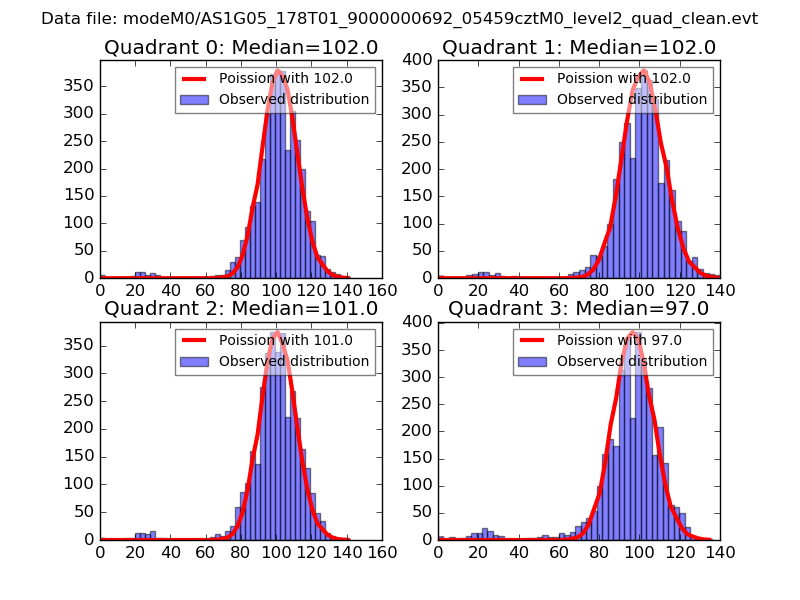 |
 |
| Quadrant-wise count rates Data is divided into 100 sec bins |
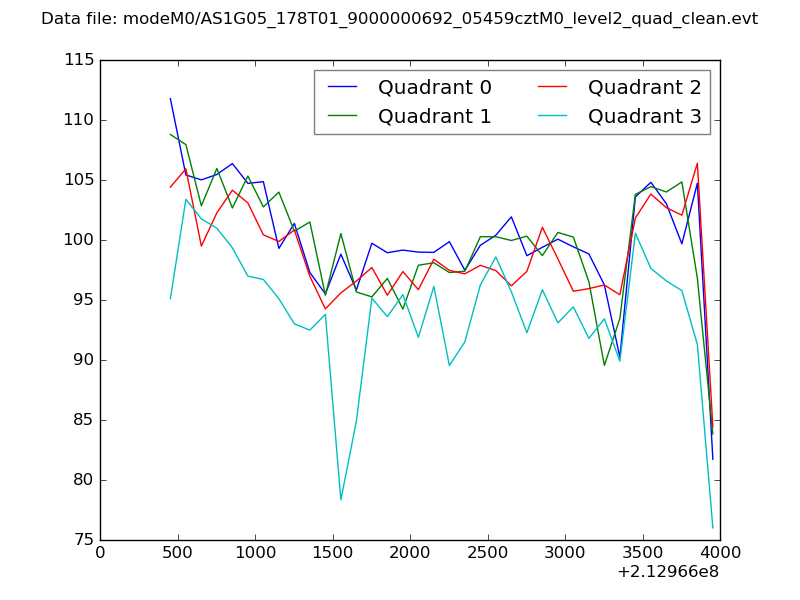 |
|
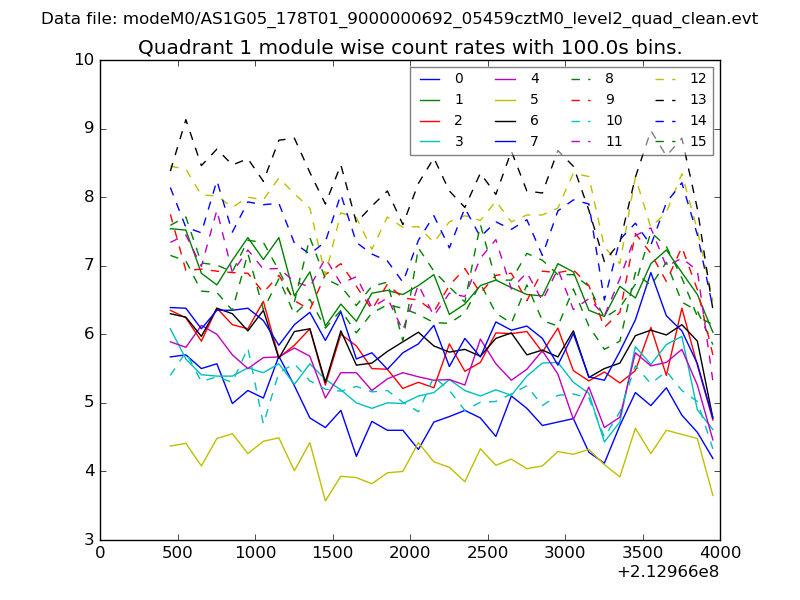
| Module-wise count rates for Quadrant A Data is divided into 100 sec bins |
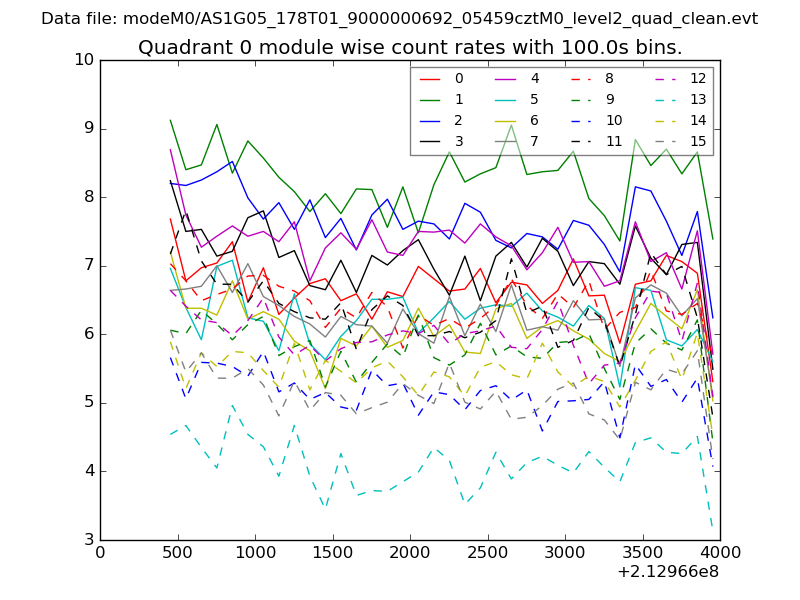 |
 |
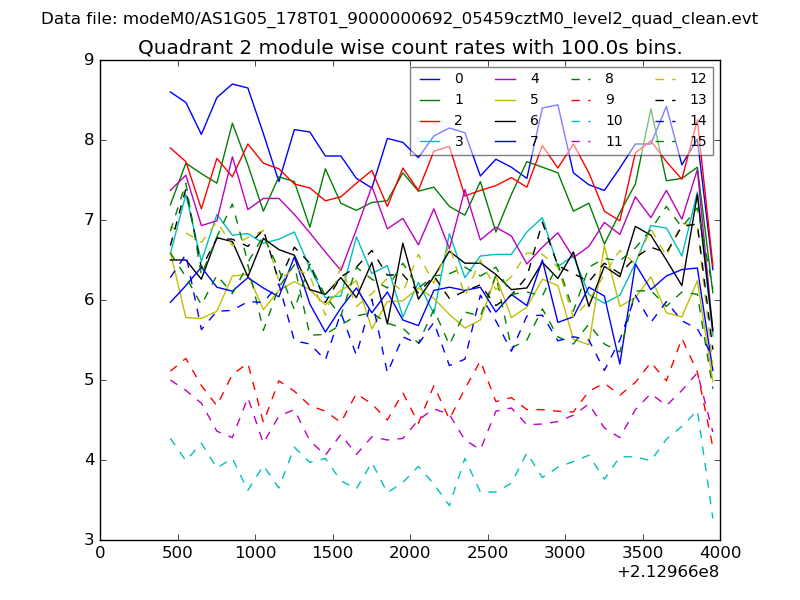
| Module-wise count rates for Quadrant B Data is divided into 100 sec bins |
 |
 |
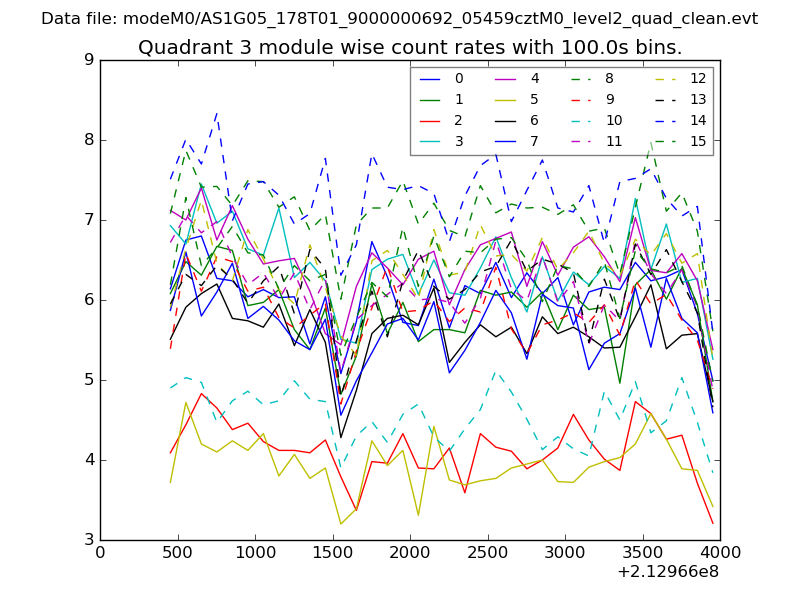
| Module-wise count rates for Quadrant C Data is divided into 100 sec bins |
 |
 |
| Module-wise count rates for Quadrant D Data is divided into 100 sec bins |
 |
 |
| Parameter | Plot |
|---|---|
| CZT HV Monitor | 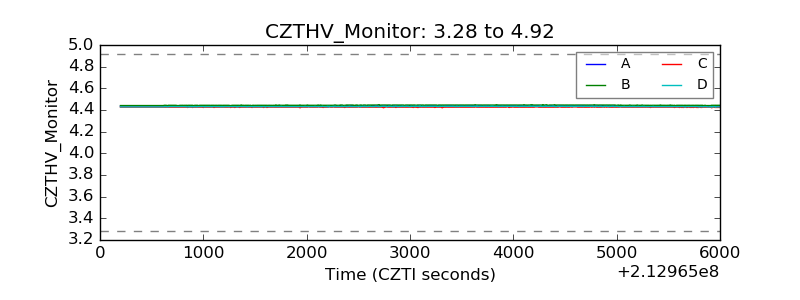 |
| D_VDD | 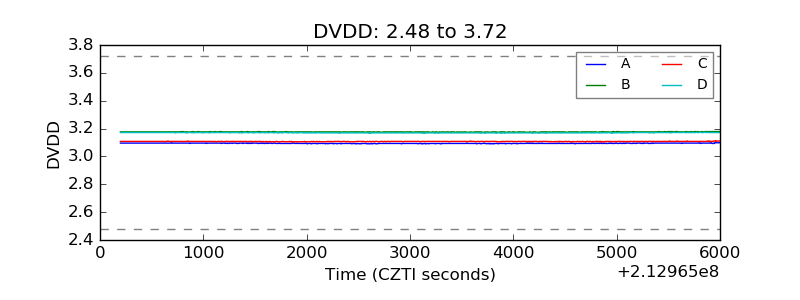 |
| Temperature 1 | 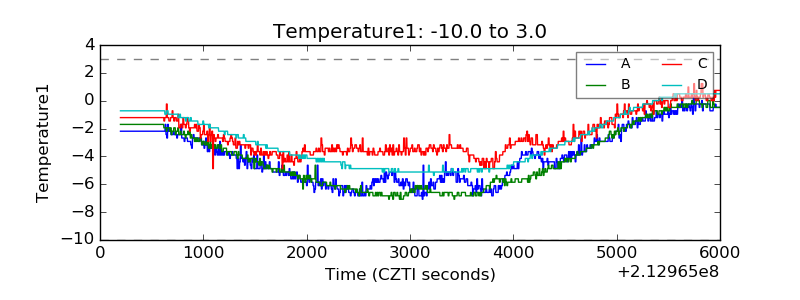 |
| Veto HV Monitor | 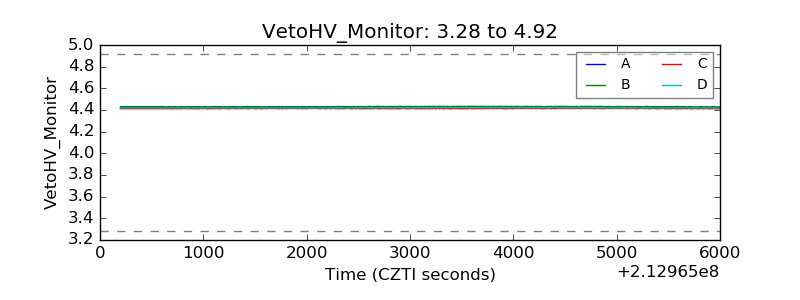 |
| Veto LLD | 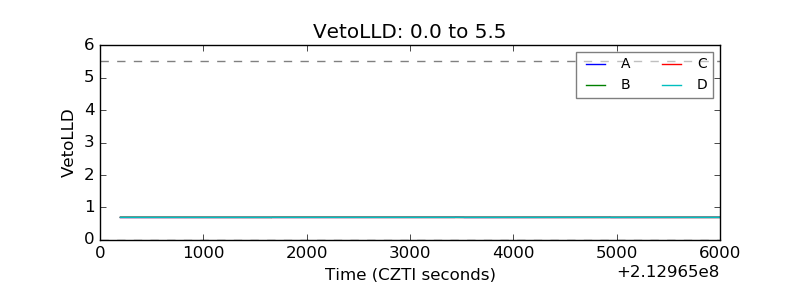 |
| Alpha Counter | 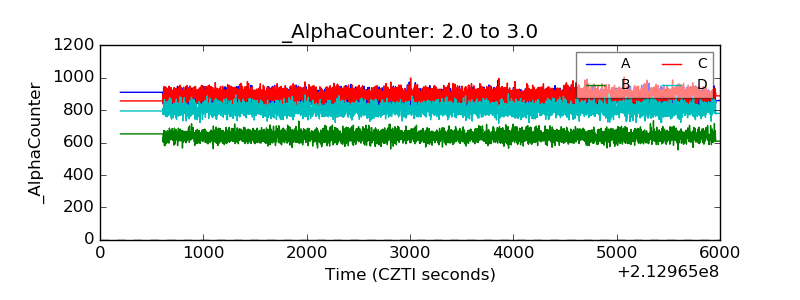 |
| _CPM_Rate | 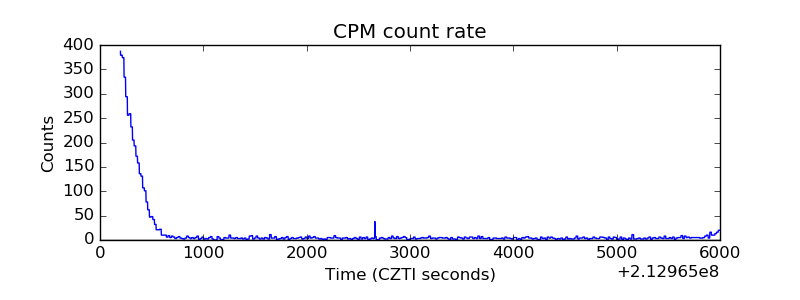 |
| CZT Counter | 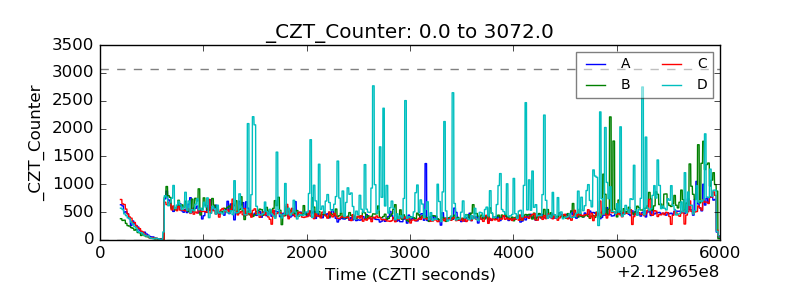 |
| +2.5 Volts monitor | 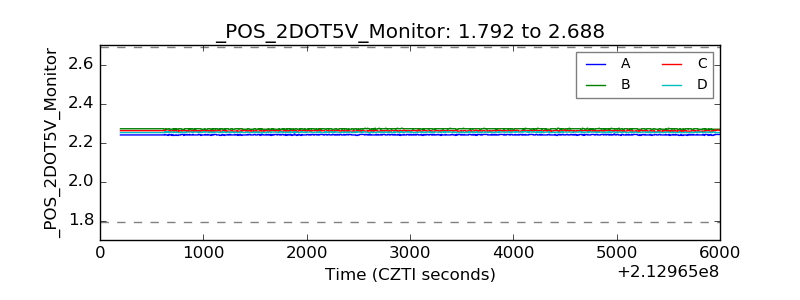 |
| +5 Volts monitor |  |
| _ROLL_ROT | 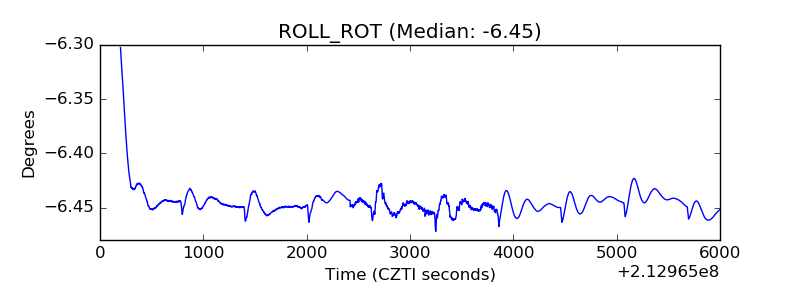 |
| _Roll_DEC |  |
| _Roll_RA | 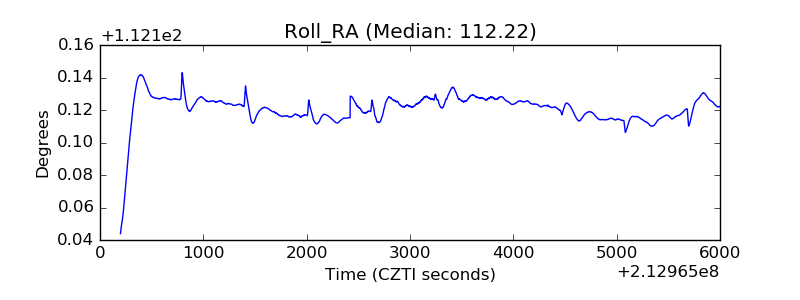 |
| Veto Counter | 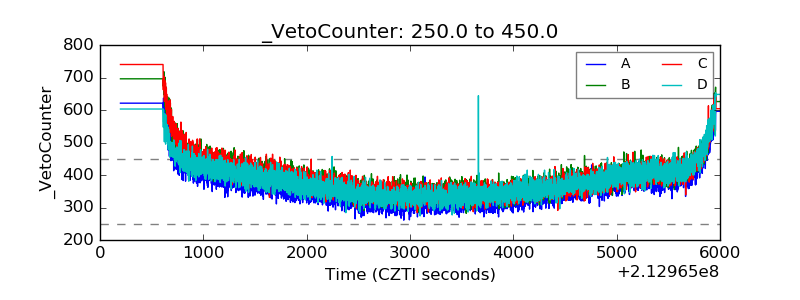 |