| Param | Original file | Final file |
|---|---|---|
| Filename | modeM0/AS1G05_187T01_9000000690cztM0_level2.fits | modeM0/AS1G05_187T01_9000000690cztM0_level2_quad_clean.evt |
| Size (bytes) | 48,216,960 | 29,701,440 |
| Size | 46.0 MB | 28.3 MB |
| Events in quadrant A | 290,706 | 142,734 |
| Events in quadrant B | 282,008 | 142,346 |
| Events in quadrant C | 287,290 | 135,287 |
| Events in quadrant D | 246,854 | 124,316 |
| Mode M9 | |||
|---|---|---|---|
| Quadrant | BADHDUFLAG | Total packets | Discarded packets |
| A | 0 | 13 | 0 |
| B | 0 | 13 | 0 |
| C | 0 | 13 | 0 |
| D | 0 | 13 | 0 |
| Mode M0 | |||
|---|---|---|---|
| Quadrant | BADHDUFLAG | Total packets | Discarded packets |
| A | 0 | 10506 | 0 |
| B | 0 | 11654 | 0 |
| C | 0 | 11858 | 0 |
| D | 0 | 12845 | 0 |
| Mode SS | |||
|---|---|---|---|
| Quadrant | BADHDUFLAG | Total packets | Discarded packets |
| A | 0 | 102 | 0 |
| B | 0 | 102 | 0 |
| C | 0 | 102 | 0 |
| D | 0 | 102 | 0 |
| Quadrant | Total seconds | Saturated seconds | Saturation percentage |
|---|---|---|---|
| A | 5045 | 79 | 1.565907% |
| B | 5045 | 103 | 2.041625% |
| C | 5045 | 146 | 2.893954% |
| D | 5045 | 126 | 2.497522% |
Noise dominated data is calculated using 1-second bins in cleaned event files. If a bin has >2000 counts, and if more than 50% of those come from <1% of pixels, then it is considered to be noise-dominated and hence unusable.
| Quadrant | # 1 sec bins | Bins with >0 counts | Bins with >2000 counts | High rate bins dominated by noise | Noise dominated (total time) | Noise dominated (detector-on time) | Marked lightcurve |
|---|---|---|---|---|---|---|---|
| A | 6330 | 5045 | 0 | 0 | 0.00% | 0.00% |  |
| B | 6330 | 5042 | 0 | 0 | 0.00% | 0.00% |  |
| C | 6330 | 5045 | 0 | 0 | 0.00% | 0.00% |  |
| D | 6330 | 5045 | 0 | 0 | 0.00% | 0.00% |  |
Top three noisy pixels from each quadrant. If the there are fewer than three noisy pixels in the level2.evt file, extra rows are filled as -1
| Pixel properties | Quadrant properties | ||||||
|---|---|---|---|---|---|---|---|
| Quadrant | DetID | PixID | Counts | Sigma | Mean | Median | Sigma |
| A | 0 | 29 | 271 | 9.44 | 75 | 70 | 21.3 |
| A | 7 | 110 | 253 | 8.6 | 75 | 70 | 21.3 |
| A | 9 | 19 | 237 | 7.85 | 75 | 70 | 21.3 |
| B | 2 | 9 | 243 | 9.65 | 74 | 71 | 17.8 |
| B | 12 | 226 | 210 | 7.8 | 74 | 71 | 17.8 |
| B | 12 | 37 | 186 | 6.45 | 74 | 71 | 17.8 |
| C | 1 | 81 | 217 | 6.67 | 75 | 70 | 22.1 |
| C | 12 | 241 | 208 | 6.26 | 75 | 70 | 22.1 |
| C | 1 | 80 | 208 | 6.26 | 75 | 70 | 22.1 |
| D | 3 | 14 | 205 | 6.9 | 70 | 64 | 20.4 |
| D | 7 | 3 | 191 | 6.21 | 70 | 64 | 20.4 |
| D | 4 | 160 | 190 | 6.16 | 70 | 64 | 20.4 |
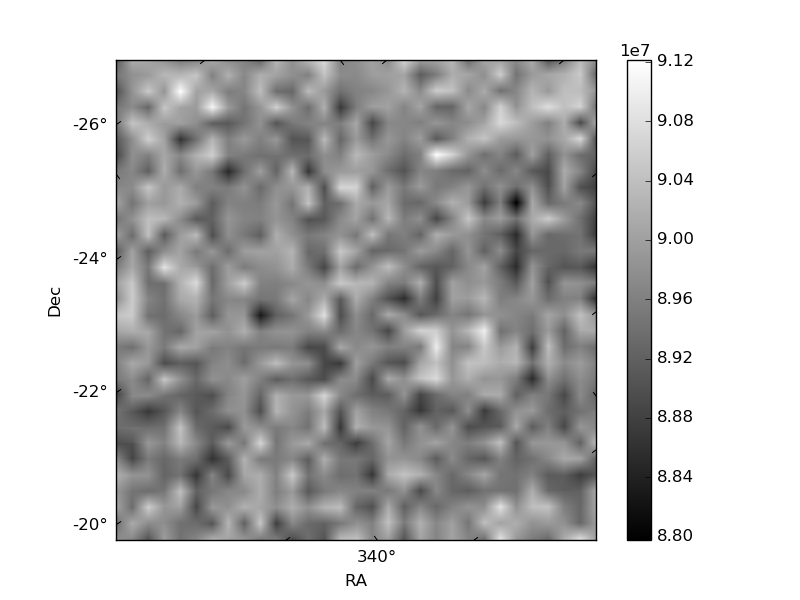
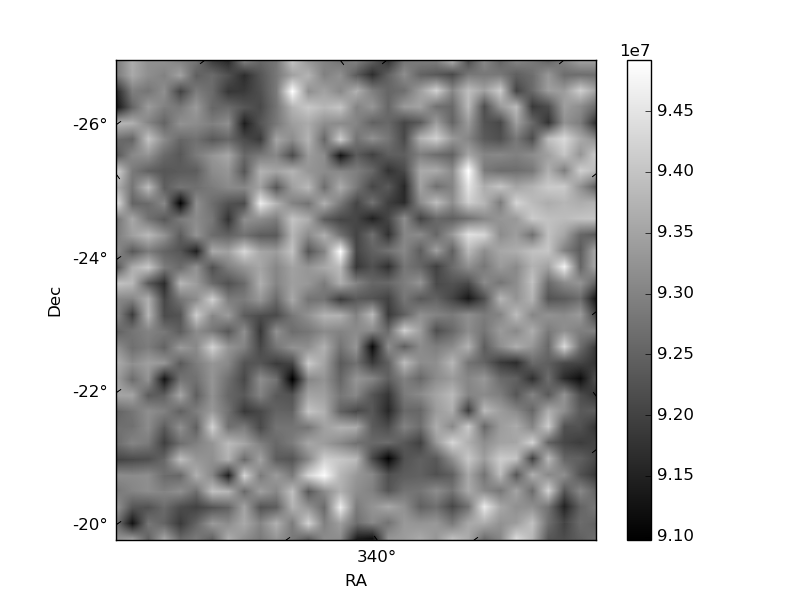
Histogram calculated using DETX and DETY for each event in the final _common_clean file
| Quadrant A | 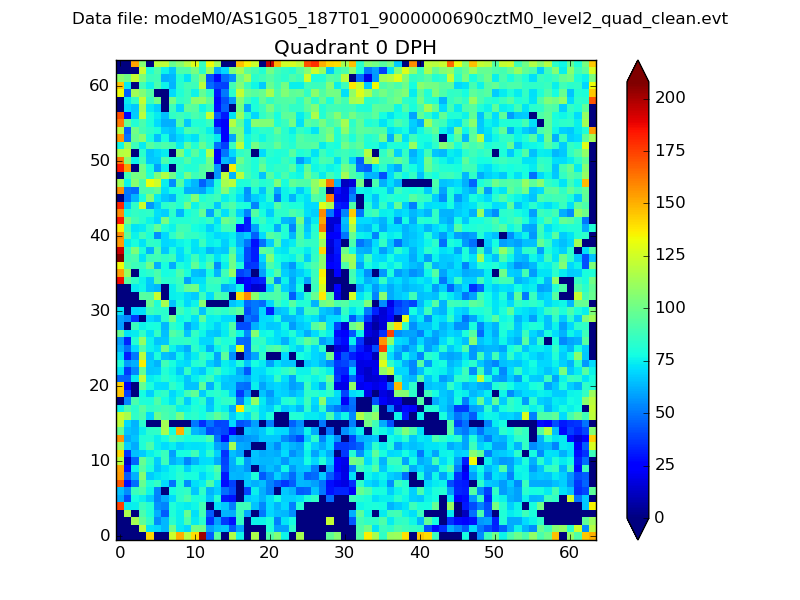 |
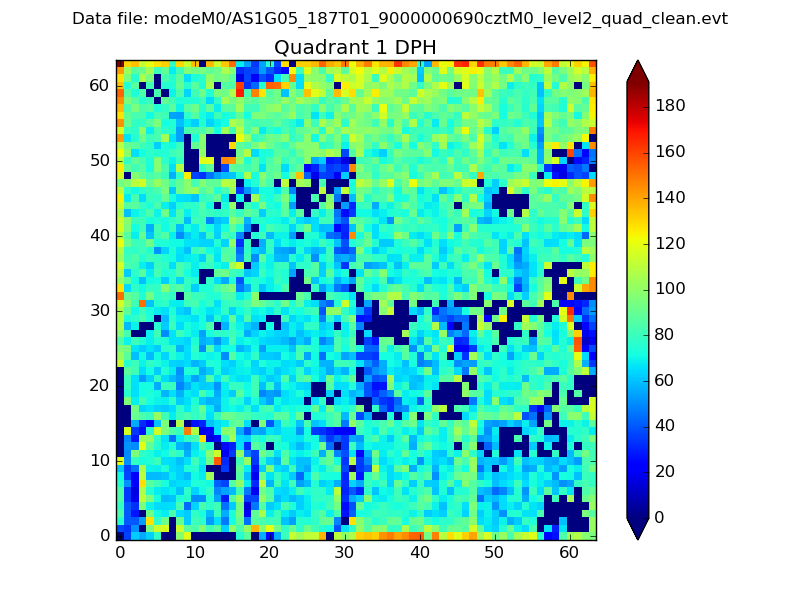 |
Quadrant B |
|---|---|---|---|
| Quadrant D | 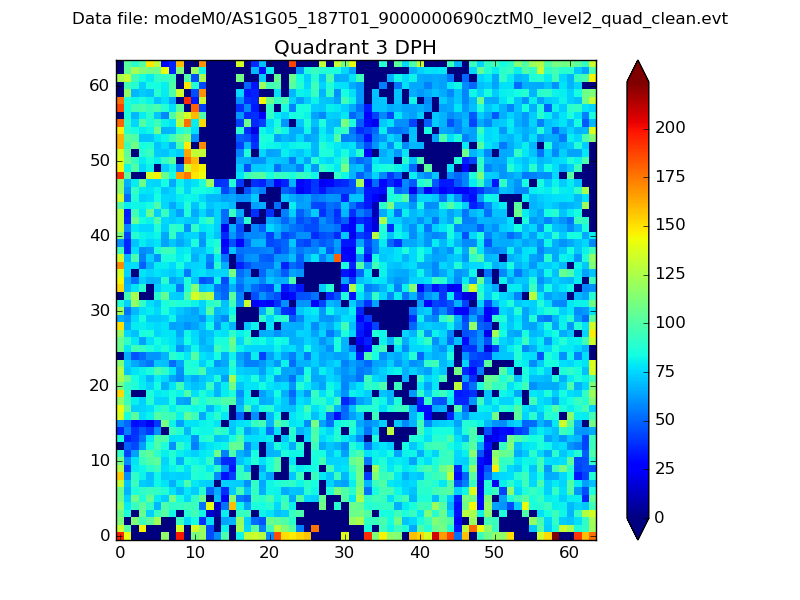 |
 |
Quadrant C |
| Plot type | Count rate plots | Images |
|---|---|---|
| Comparison with Poisson distribution Blue bars denote a histogram of data divided into 1 sec bins. Red curve is a Poisson curve with rate = median count rate of data. |
 |
 |
| Quadrant-wise count rates Data is divided into 100 sec bins |
 |
|
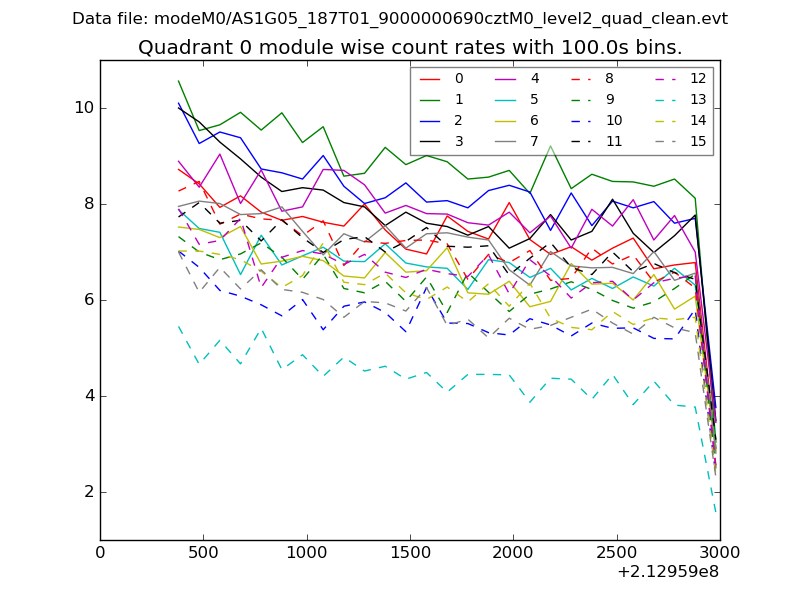
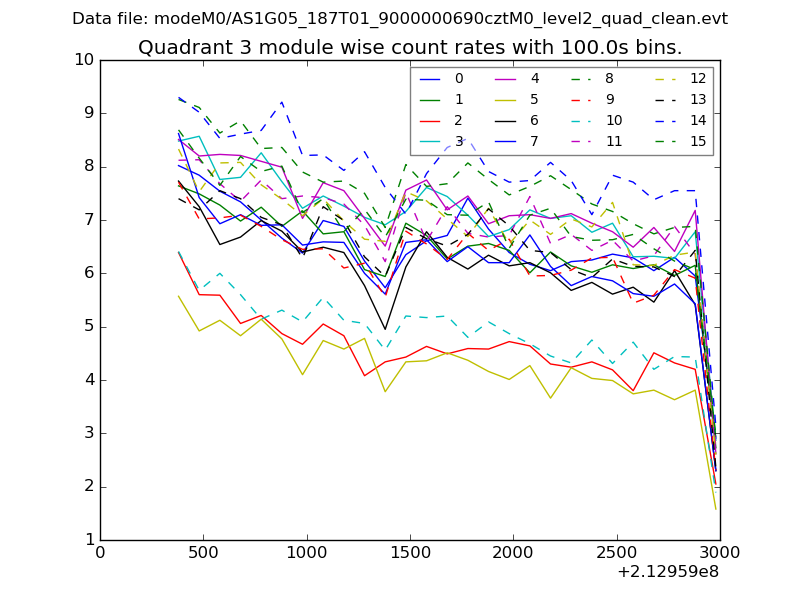
| Module-wise count rates for Quadrant A Data is divided into 100 sec bins |
 |
 |
| Module-wise count rates for Quadrant B Data is divided into 100 sec bins |
 |
 |
| Module-wise count rates for Quadrant C Data is divided into 100 sec bins |
 |
 |
| Module-wise count rates for Quadrant D Data is divided into 100 sec bins |
 |
 |
| Parameter | Plot |
|---|---|
| CZT HV Monitor |  |
| D_VDD | 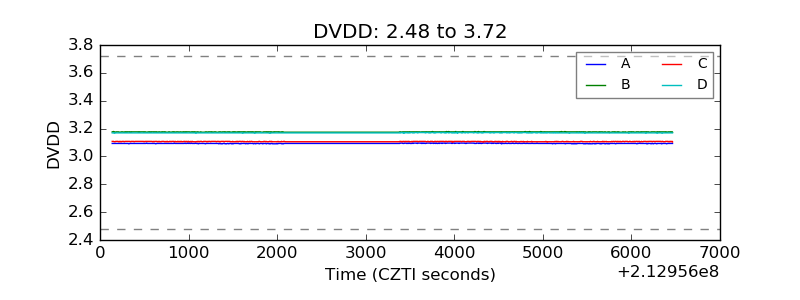 |
| Temperature 1 |  |
| Veto HV Monitor |  |
| Veto LLD | 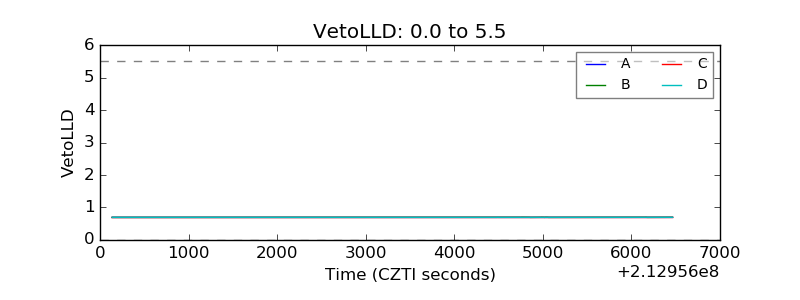 |
| Alpha Counter |  |
| _CPM_Rate |  |
| CZT Counter |  |
| +2.5 Volts monitor |  |
| +5 Volts monitor |  |
| _ROLL_ROT | 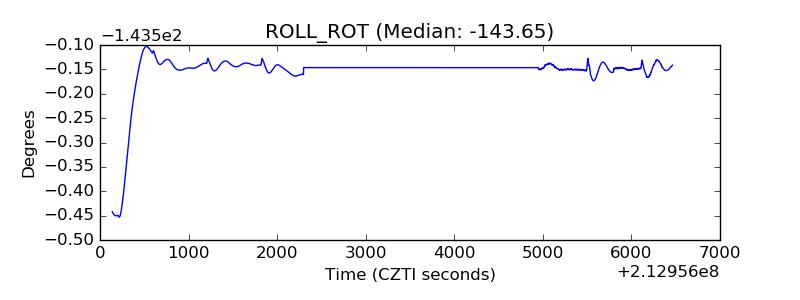 |
| _Roll_DEC |  |
| _Roll_RA | 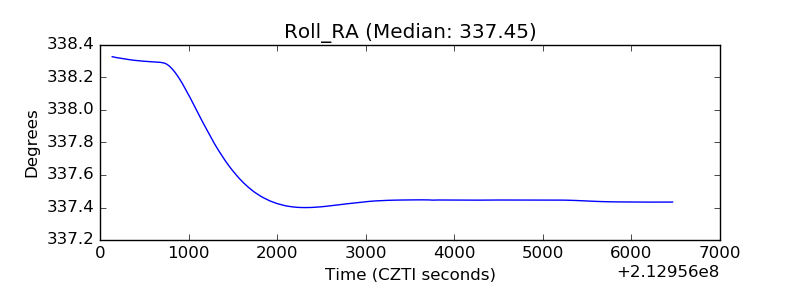 |
| Veto Counter | 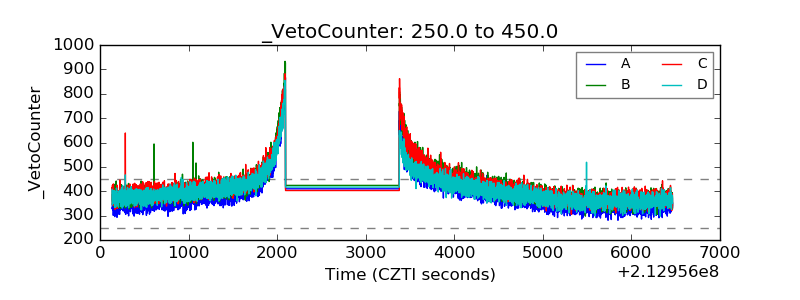 |