| Param | Original file | Final file |
|---|---|---|
| Filename | modeM0/AS1T01_137T01_9000000694cztM0_level2.fits | modeM0/AS1T01_137T01_9000000694cztM0_level2_quad_clean.evt |
| Size (bytes) | 27,527,040 | 20,753,280 |
| Size | 26.3 MB | 19.8 MB |
| Events in quadrant A | 161,748 | 105,824 |
| Events in quadrant B | 155,584 | 104,606 |
| Events in quadrant C | 154,136 | 98,960 |
| Events in quadrant D | 132,992 | 88,910 |
| Mode SS | |||
|---|---|---|---|
| Quadrant | BADHDUFLAG | Total packets | Discarded packets |
| A | 0 | 68 | 0 |
| B | 0 | 68 | 0 |
| C | 0 | 66 | 0 |
| D | 0 | 66 | 0 |
| Mode M0 | |||
|---|---|---|---|
| Quadrant | BADHDUFLAG | Total packets | Discarded packets |
| A | 0 | 6514 | 0 |
| B | 0 | 6781 | 0 |
| C | 0 | 7316 | 0 |
| D | 0 | 8760 | 0 |
| Quadrant | Total seconds | Saturated seconds | Saturation percentage |
|---|---|---|---|
| A | 3238 | 1 | 0.030883% |
| B | 3224 | 15 | 0.465261% |
| C | 3212 | 118 | 3.673724% |
| D | 3195 | 75 | 2.347418% |
Noise dominated data is calculated using 1-second bins in cleaned event files. If a bin has >2000 counts, and if more than 50% of those come from <1% of pixels, then it is considered to be noise-dominated and hence unusable.
| Quadrant | # 1 sec bins | Bins with >0 counts | Bins with >2000 counts | High rate bins dominated by noise | Noise dominated (total time) | Noise dominated (detector-on time) | Marked lightcurve |
|---|---|---|---|---|---|---|---|
| A | 3305 | 3299 | 0 | 0 | 0.00% | 0.00% | 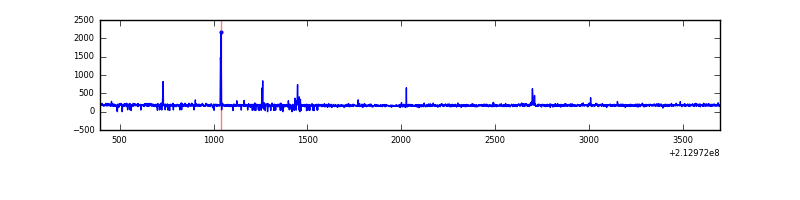 |
| B | 3305 | 3295 | 0 | 0 | 0.00% | 0.00% |  |
| C | 3305 | 3290 | 0 | 0 | 0.00% | 0.00% |  |
| D | 3305 | 3282 | 0 | 0 | 0.00% | 0.00% | 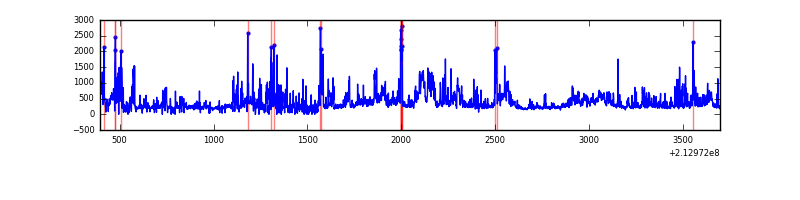 |
Top three noisy pixels from each quadrant. If the there are fewer than three noisy pixels in the level2.evt file, extra rows are filled as -1
| Pixel properties | Quadrant properties | ||||||
|---|---|---|---|---|---|---|---|
| Quadrant | DetID | PixID | Counts | Sigma | Mean | Median | Sigma |
| A | 7 | 110 | 146 | 8.25 | 42 | 39 | 13.0 |
| A | 0 | 29 | 143 | 8.02 | 42 | 39 | 13.0 |
| A | 9 | 19 | 122 | 6.4 | 42 | 39 | 13.0 |
| B | 2 | 9 | 139 | 9.42 | 41 | 39 | 10.6 |
| B | 13 | 245 | 109 | 6.59 | 41 | 39 | 10.6 |
| B | 5 | 128 | 106 | 6.31 | 41 | 39 | 10.6 |
| C | 1 | 80 | 123 | 6.85 | 40 | 38 | 12.4 |
| C | 1 | 81 | 118 | 6.45 | 40 | 38 | 12.4 |
| C | 2 | 17 | 111 | 5.88 | 40 | 38 | 12.4 |
| D | 6 | 231 | 109 | 6.4 | 37 | 34 | 11.7 |
| D | 10 | 113 | 107 | 6.23 | 37 | 34 | 11.7 |
| D | 11 | 82 | 104 | 5.97 | 37 | 34 | 11.7 |
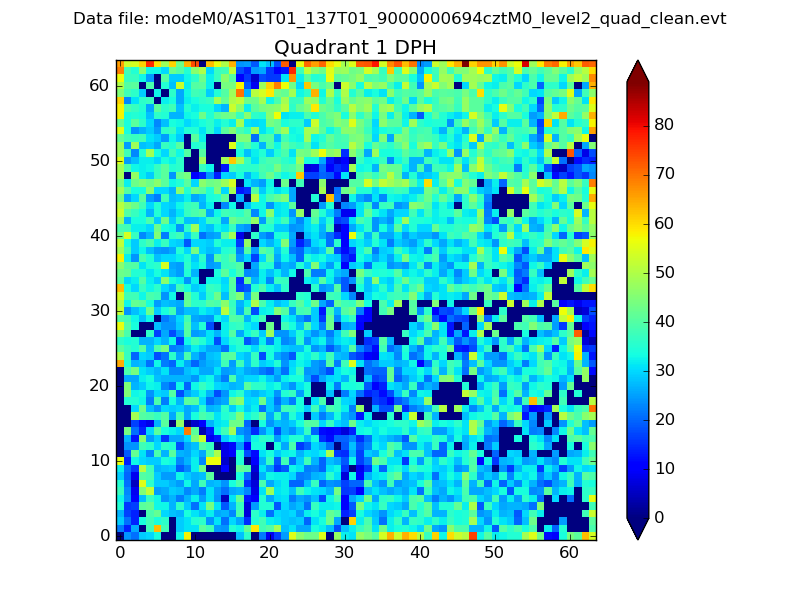
Histogram calculated using DETX and DETY for each event in the final _common_clean file
| Quadrant A |  |
 |
Quadrant B |
|---|---|---|---|
| Quadrant D |  |
 |
Quadrant C |
| Plot type | Count rate plots | Images |
|---|---|---|
| Comparison with Poisson distribution Blue bars denote a histogram of data divided into 1 sec bins. Red curve is a Poisson curve with rate = median count rate of data. |
 |
 |
| Quadrant-wise count rates Data is divided into 100 sec bins |
 |
|
| Module-wise count rates for Quadrant A Data is divided into 100 sec bins |
 |
 |
| Module-wise count rates for Quadrant B Data is divided into 100 sec bins |
 |
 |
| Module-wise count rates for Quadrant C Data is divided into 100 sec bins |
 |
 |
| Module-wise count rates for Quadrant D Data is divided into 100 sec bins |
 |
 |
| Parameter | Plot |
|---|---|
| CZT HV Monitor |  |
| D_VDD | 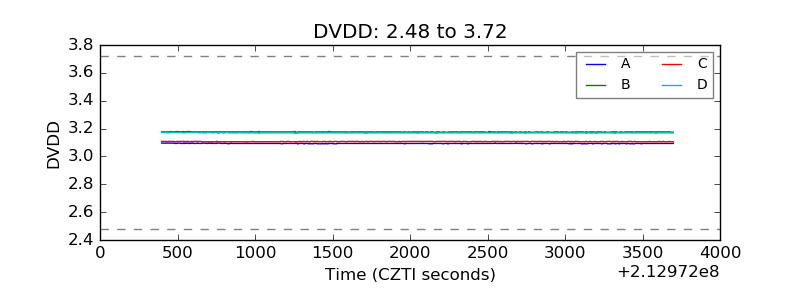 |
| Temperature 1 |  |
| Veto HV Monitor |  |
| Veto LLD |  |
| Alpha Counter |  |
| _CPM_Rate |  |
| CZT Counter |  |
| +2.5 Volts monitor |  |
| +5 Volts monitor |  |
| _ROLL_ROT |  |
| _Roll_DEC |  |
| _Roll_RA |  |
| Veto Counter |  |