| Param | Original file | Final file |
|---|---|---|
| Filename | modeM0/AS1T01_137T01_9000000694_05460cztM0_level2.evt | modeM0/AS1T01_137T01_9000000694_05460cztM0_level2_quad_clean.evt |
| Size (bytes) | 232,528,320 | 25,009,920 |
| Size | 221.8 MB | 23.9 MB |
| Events in quadrant A | 1,336,651 | 133,685 |
| Events in quadrant B | 1,544,985 | 133,891 |
| Events in quadrant C | 1,628,395 | 130,195 |
| Events in quadrant D | 2,305,261 | 123,731 |
| Mode SS | |||
|---|---|---|---|
| Quadrant | BADHDUFLAG | Total packets | Discarded packets |
| A | 0 | 68 | 0 |
| B | 0 | 68 | 0 |
| C | 0 | 68 | 0 |
| D | 0 | 68 | 0 |
| Mode M0 | |||
|---|---|---|---|
| Quadrant | BADHDUFLAG | Total packets | Discarded packets |
| A | 0 | 6650 | 0 |
| B | 0 | 6951 | 0 |
| C | 0 | 7502 | 0 |
| D | 0 | 9124 | 2 |
| Quadrant | Total seconds | Saturated seconds | Saturation percentage |
|---|---|---|---|
| A | 3305 | 1 | 0.030257% |
| B | 3305 | 15 | 0.453858% |
| C | 3305 | 118 | 3.570348% |
| D | 3304 | 85 | 2.572639% |
Noise dominated data is calculated using 1-second bins in cleaned event files. If a bin has >2000 counts, and if more than 50% of those come from <1% of pixels, then it is considered to be noise-dominated and hence unusable.
| Quadrant | # 1 sec bins | Bins with >0 counts | Bins with >2000 counts | High rate bins dominated by noise | Noise dominated (total time) | Noise dominated (detector-on time) | Marked lightcurve |
|---|---|---|---|---|---|---|---|
| A | 3305 | 3305 | 1 | 1 | 0.03% | 0.03% | 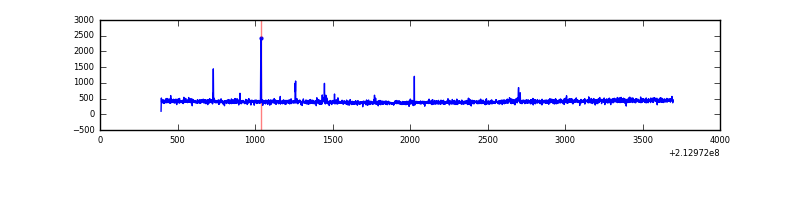 |
| B | 3305 | 3305 | 10 | 10 | 0.30% | 0.30% | 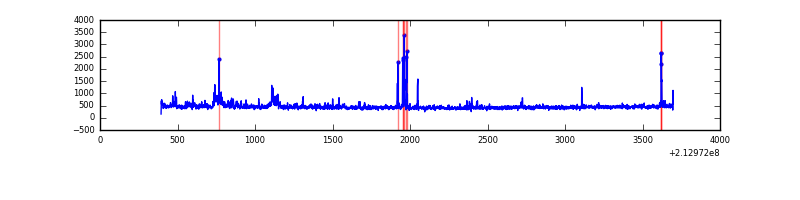 |
| C | 3305 | 3305 | 98 | 98 | 2.97% | 2.97% | 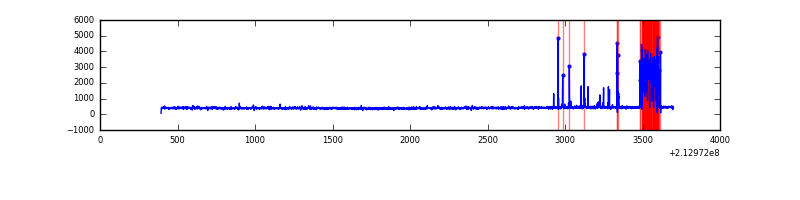 |
| D | 3305 | 3305 | 81 | 81 | 2.45% | 2.45% | 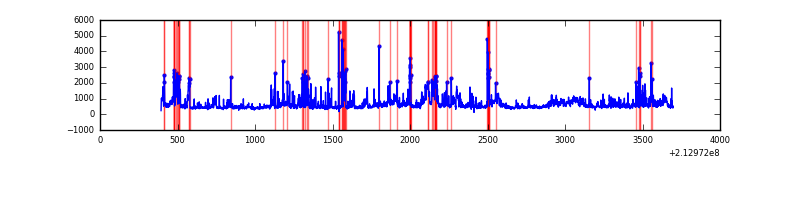 |
Top three noisy pixels from each quadrant. If the there are fewer than three noisy pixels in the level2.evt file, extra rows are filled as -1
| Pixel properties | Quadrant properties | ||||||
|---|---|---|---|---|---|---|---|
| Quadrant | DetID | PixID | Counts | Sigma | Mean | Median | Sigma |
| A | 0 | 50 | 11227 | 153.75 | 341 | 333 | 70.9 |
| A | 0 | 247 | 5119 | 67.55 | 341 | 333 | 70.9 |
| A | 0 | 226 | 3743 | 48.13 | 341 | 333 | 70.9 |
| B | 15 | 204 | 88665 | 1302.71 | 348 | 340 | 67.8 |
| B | 4 | 48 | 48383 | 708.59 | 348 | 340 | 67.8 |
| B | 11 | 51 | 28195 | 410.83 | 348 | 340 | 67.8 |
| C | 1 | 241 | 335746 | 4344.46 | 329 | 331 | 77.2 |
| C | 14 | 67 | 3550 | 41.69 | 329 | 331 | 77.2 |
| C | 13 | 61 | 2585 | 29.19 | 329 | 331 | 77.2 |
| D | 2 | 33 | 688887 | 8323.04 | 330 | 320 | 82.7 |
| D | 11 | 192 | 122766 | 1480.06 | 330 | 320 | 82.7 |
| D | 2 | 152 | 94042 | 1132.86 | 330 | 320 | 82.7 |
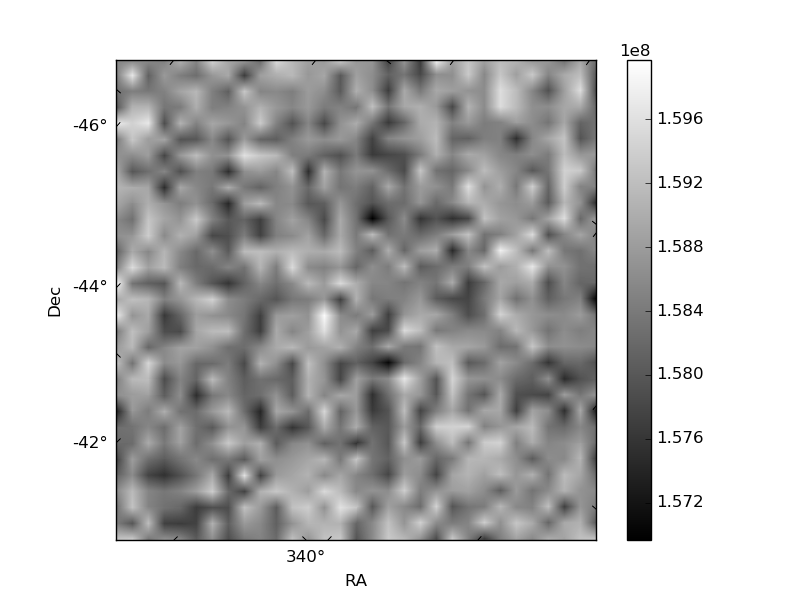
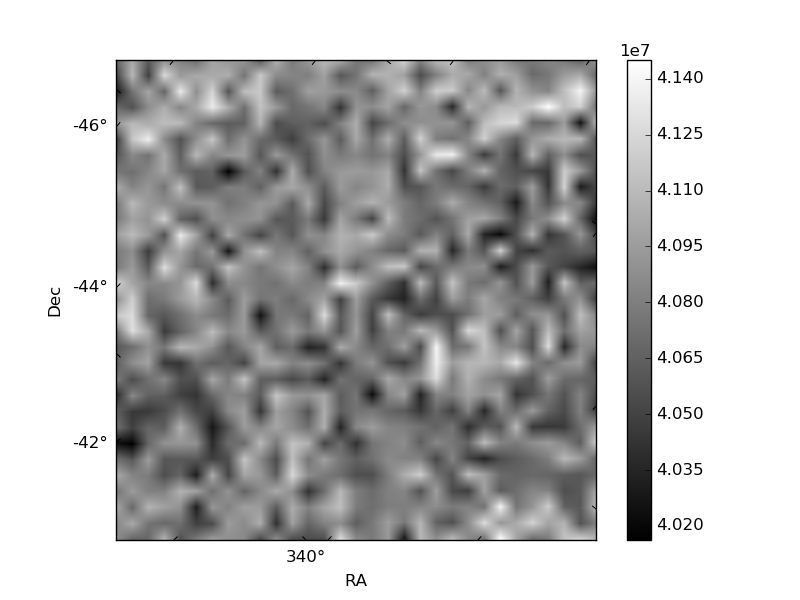
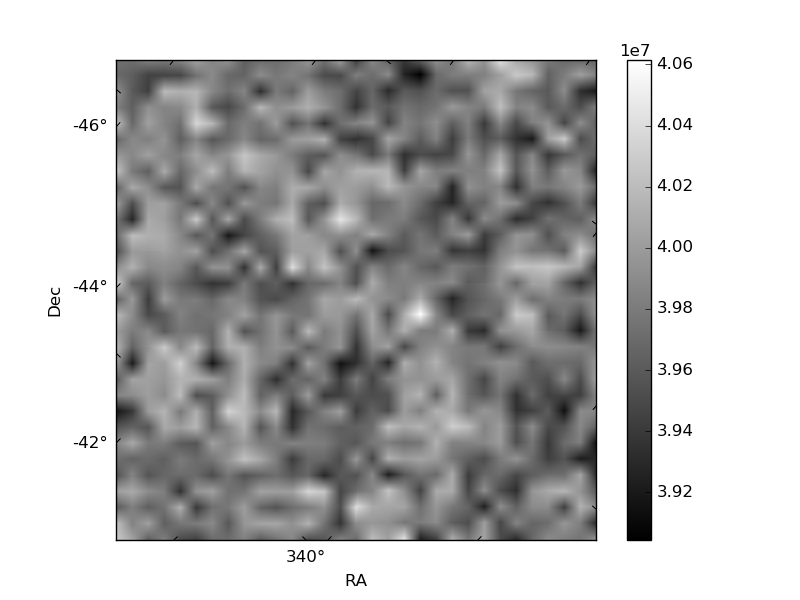
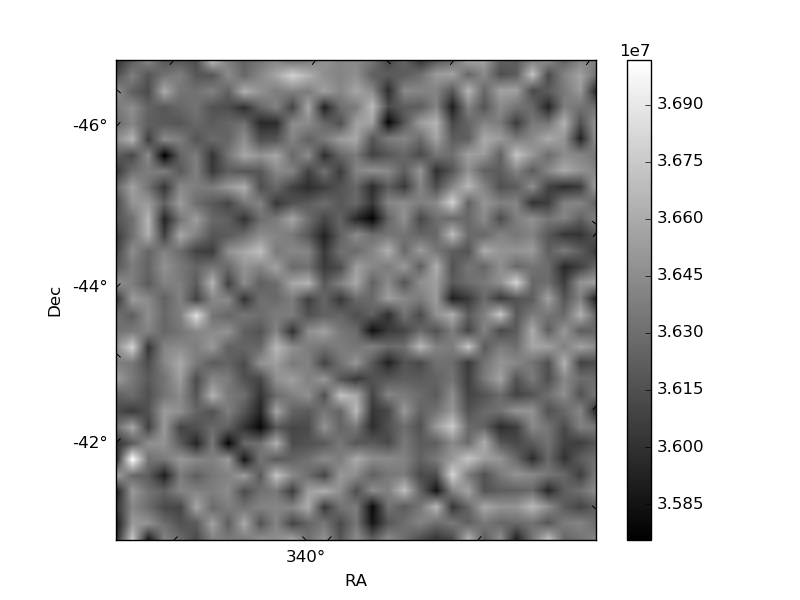
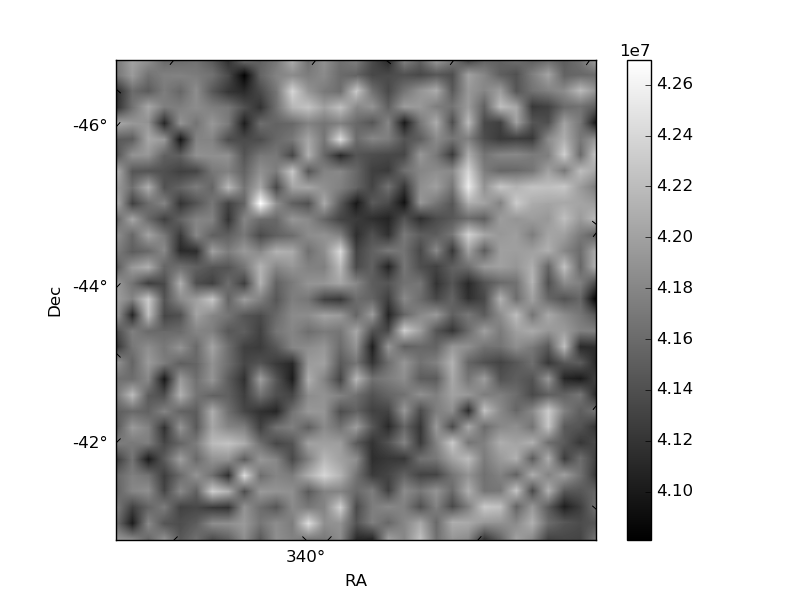
Histogram calculated using DETX and DETY for each event in the final _common_clean file
| Quadrant A | 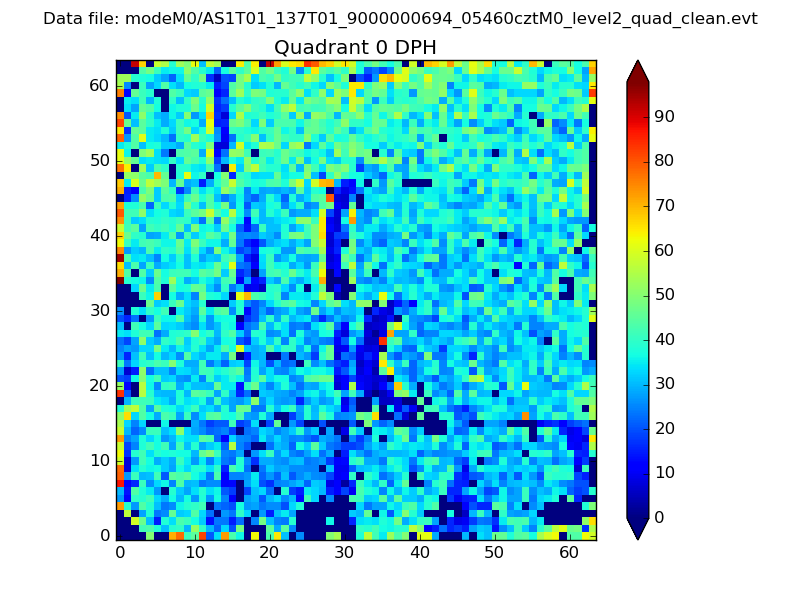 |
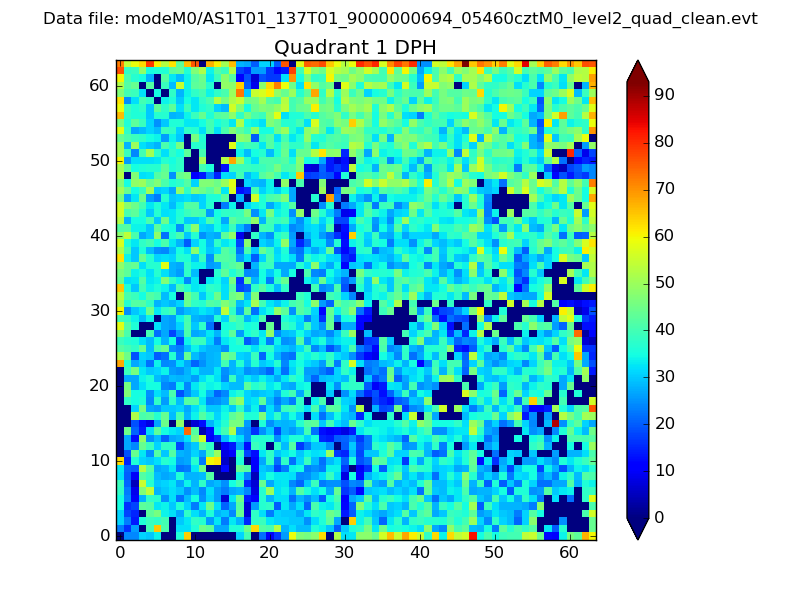 |
Quadrant B |
|---|---|---|---|
| Quadrant D | 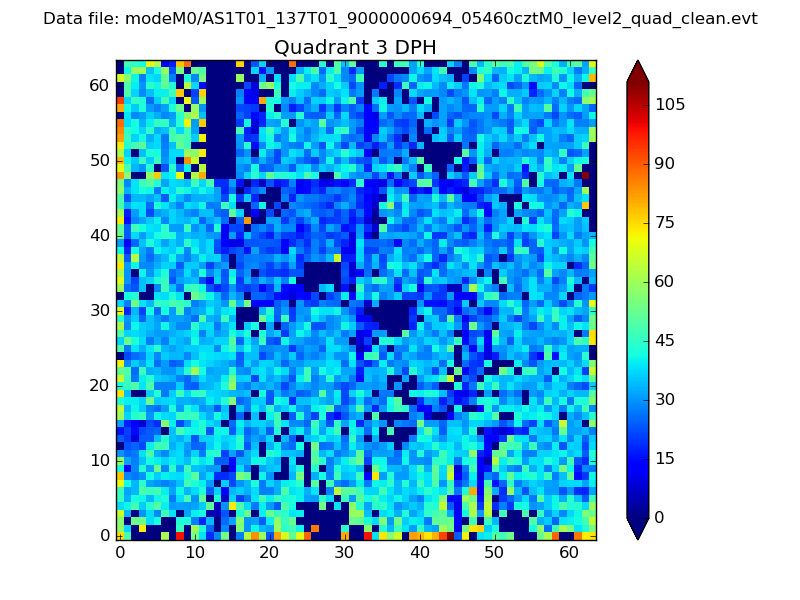 |
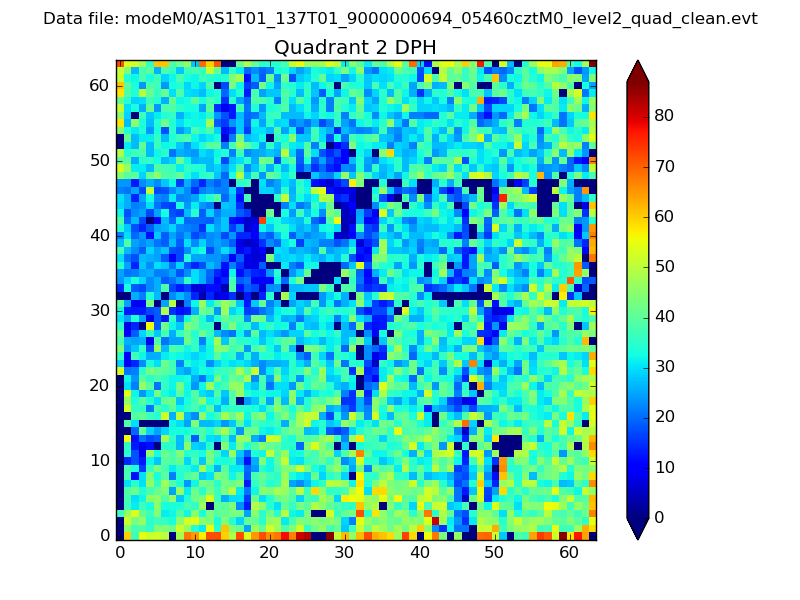 |
Quadrant C |
| Plot type | Count rate plots | Images |
|---|---|---|
| Comparison with Poisson distribution Blue bars denote a histogram of data divided into 1 sec bins. Red curve is a Poisson curve with rate = median count rate of data. |
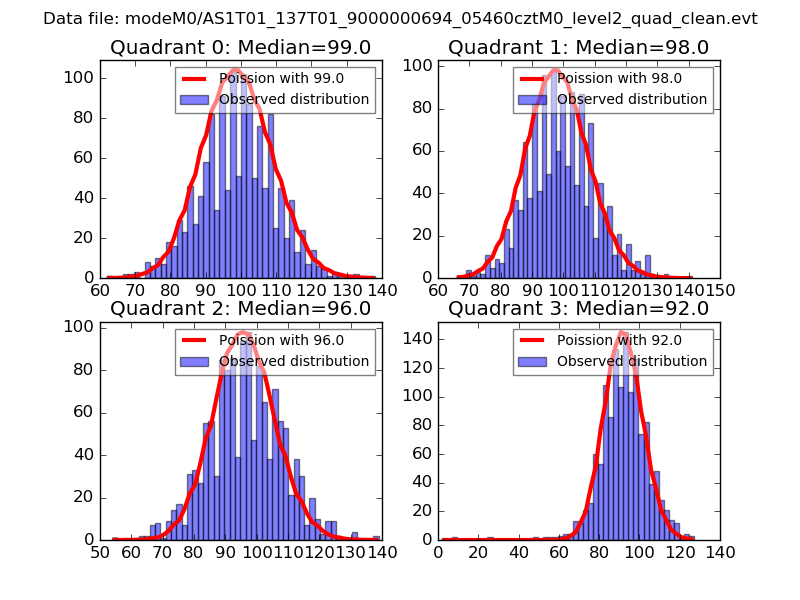 |
 |
| Quadrant-wise count rates Data is divided into 100 sec bins |
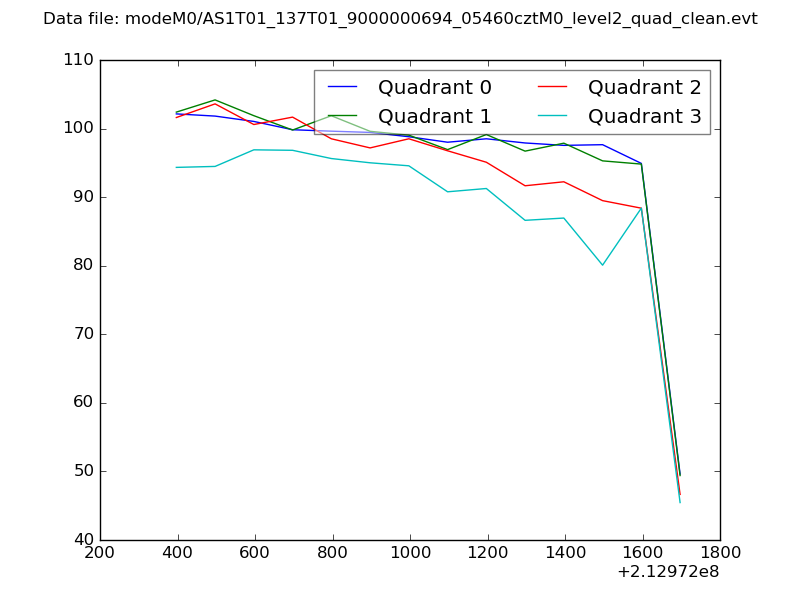 |
|
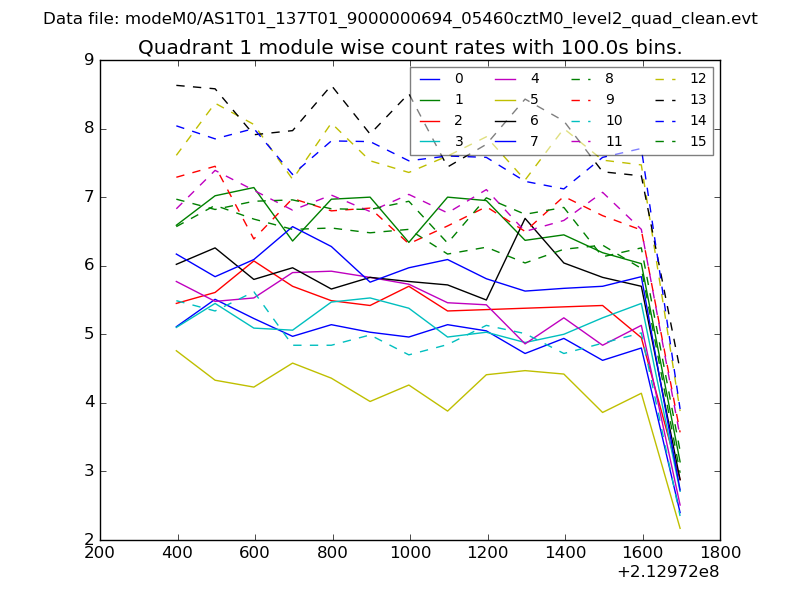
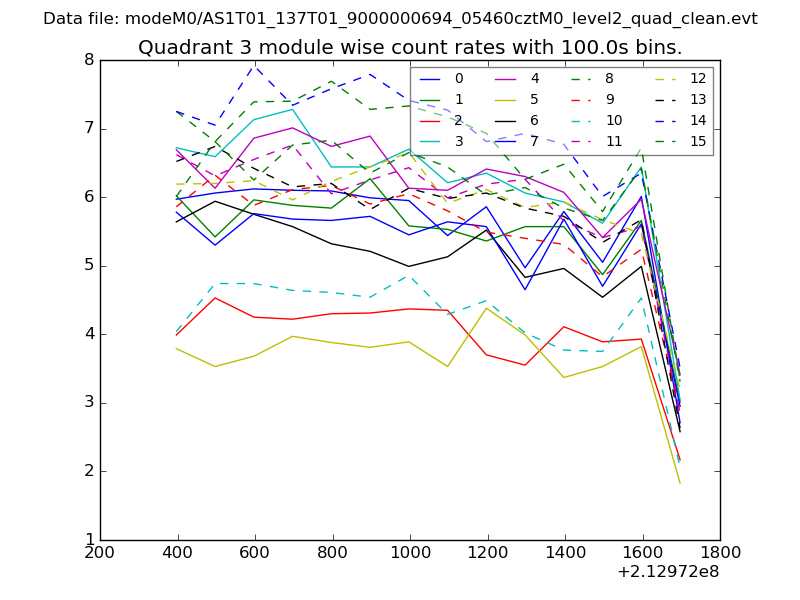
| Module-wise count rates for Quadrant A Data is divided into 100 sec bins |
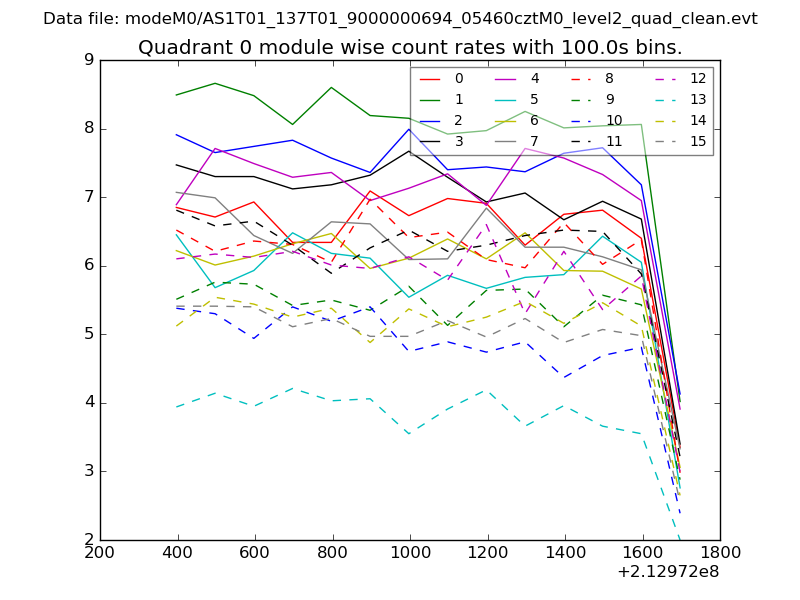 |
 |
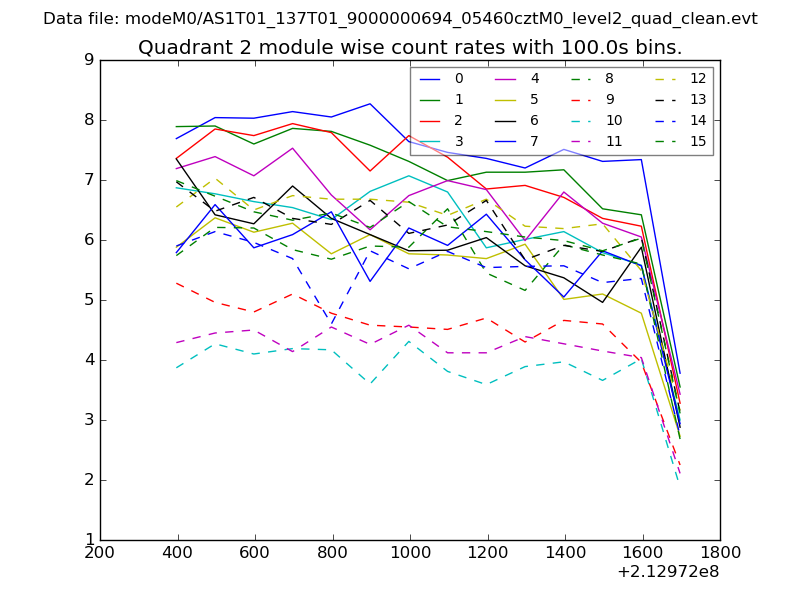
| Module-wise count rates for Quadrant B Data is divided into 100 sec bins |
 |
 |
| Module-wise count rates for Quadrant C Data is divided into 100 sec bins |
 |
 |
| Module-wise count rates for Quadrant D Data is divided into 100 sec bins |
 |
 |
| Parameter | Plot |
|---|---|
| CZT HV Monitor | 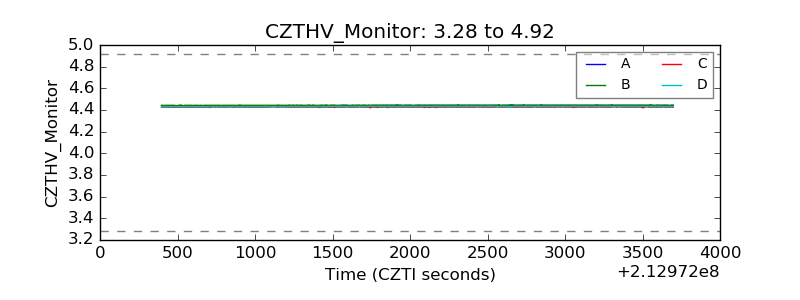 |
| D_VDD | 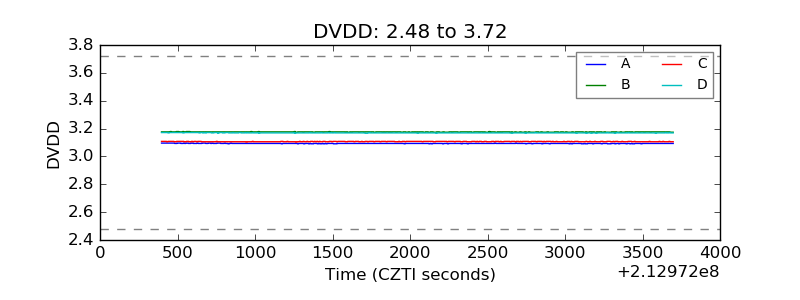 |
| Temperature 1 | 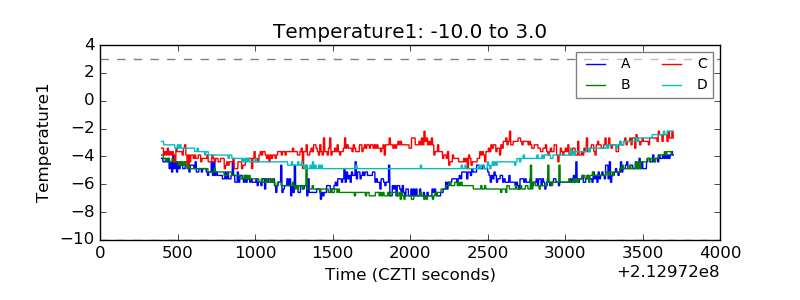 |
| Veto HV Monitor | 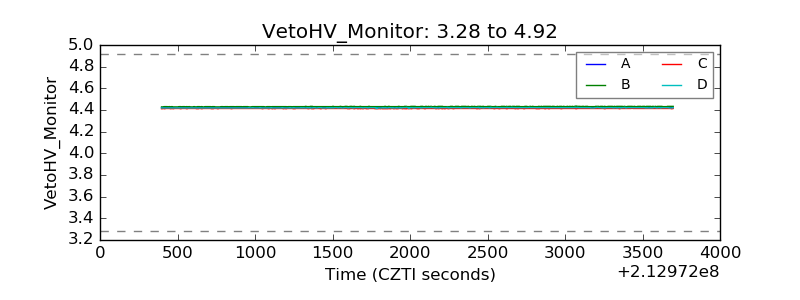 |
| Veto LLD | 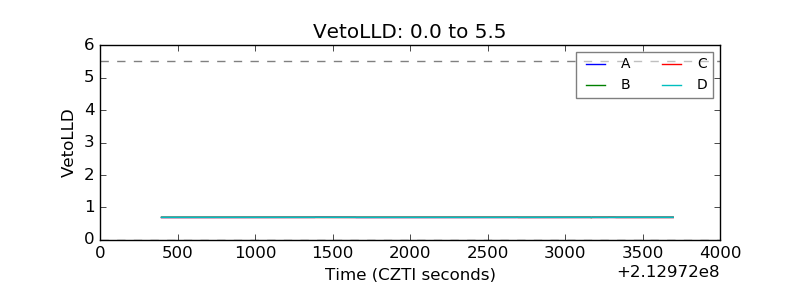 |
| Alpha Counter | 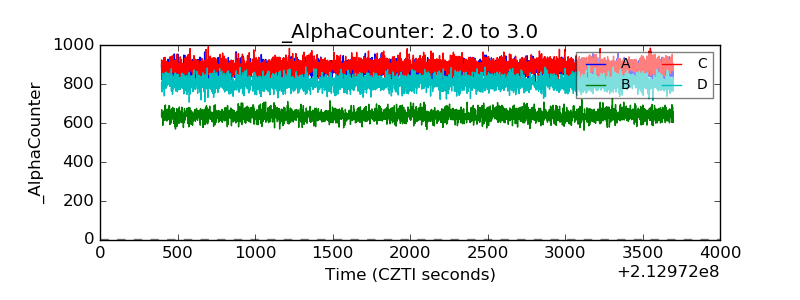 |
| _CPM_Rate | 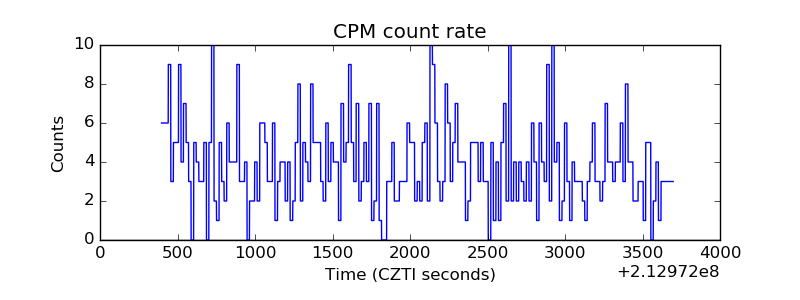 |
| CZT Counter | 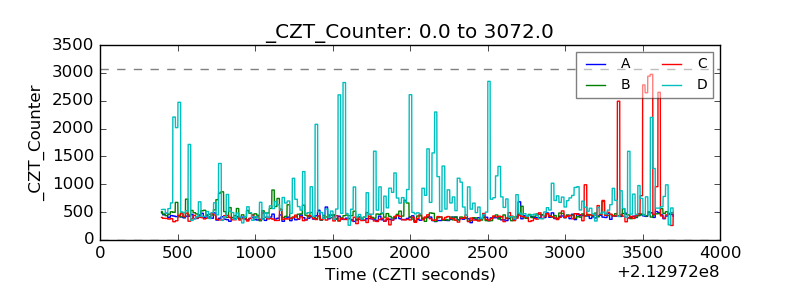 |
| +2.5 Volts monitor | 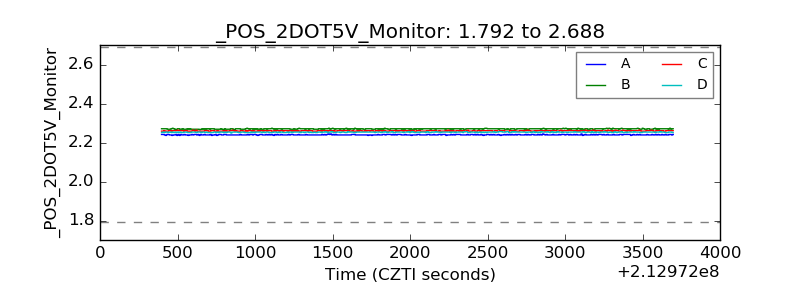 |
| +5 Volts monitor |  |
| _ROLL_ROT | 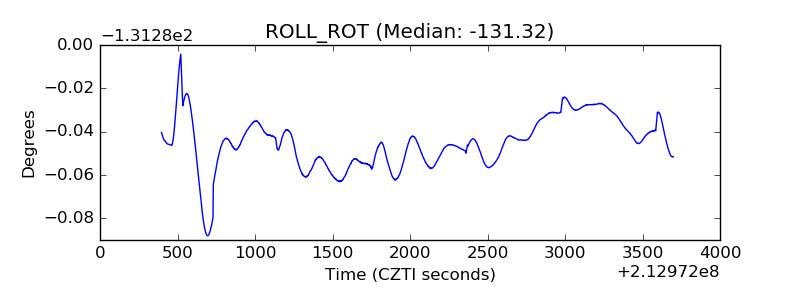 |
| _Roll_DEC | 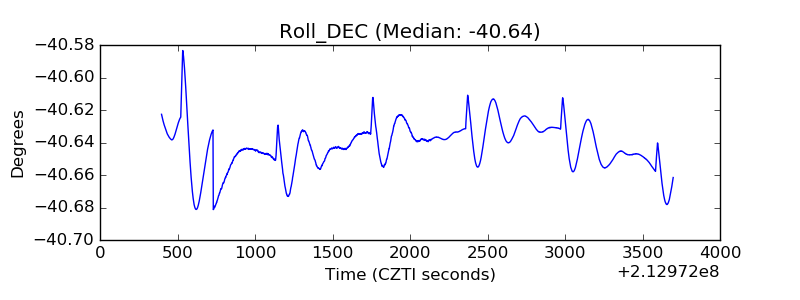 |
| _Roll_RA | 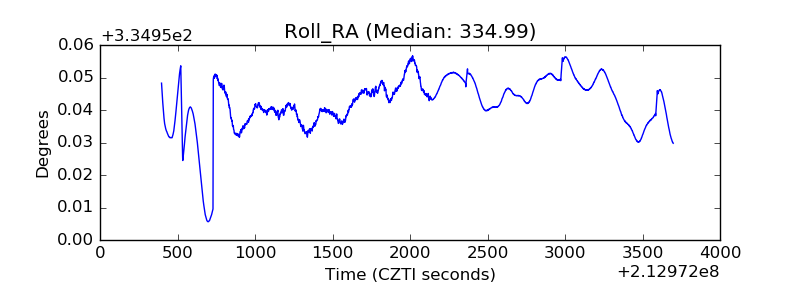 |
| Veto Counter | 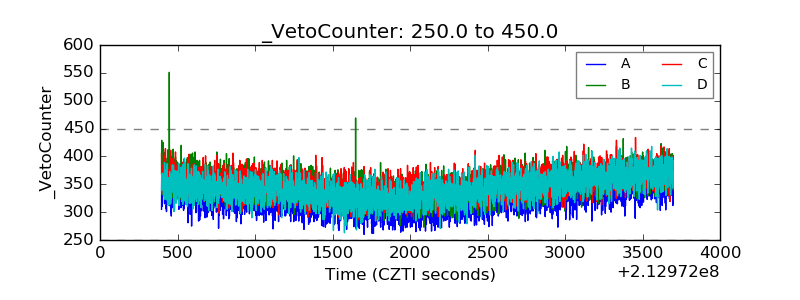 |