| Param | Original file | Final file |
|---|---|---|
| Filename | modeM0/AS1G06_087T03_9000000696cztM0_level2.fits | modeM0/AS1G06_087T03_9000000696cztM0_level2_quad_clean.evt |
| Size (bytes) | 221,273,280 | 212,293,440 |
| Size | 211.0 MB | 202.5 MB |
| Events in quadrant A | 1,321,794 | 1,249,442 |
| Events in quadrant B | 1,271,330 | 1,222,699 |
| Events in quadrant C | 1,304,567 | 1,208,460 |
| Events in quadrant D | 1,082,686 | 1,029,360 |
| Mode SS | |||
|---|---|---|---|
| Quadrant | BADHDUFLAG | Total packets | Discarded packets |
| A | 0 | 507 | 0 |
| B | 0 | 510 | 0 |
| C | 0 | 498 | 0 |
| D | 0 | 514 | 0 |
| Mode M9 | |||
|---|---|---|---|
| Quadrant | BADHDUFLAG | Total packets | Discarded packets |
| A | 0 | 27 | 0 |
| B | 0 | 27 | 0 |
| C | 0 | 27 | 0 |
| D | 0 | 27 | 0 |
| Mode M0 | |||
|---|---|---|---|
| Quadrant | BADHDUFLAG | Total packets | Discarded packets |
| A | 0 | 52346 | 0 |
| B | 0 | 54824 | 0 |
| C | 0 | 53950 | 0 |
| D | 0 | 67220 | 0 |
| Quadrant | Total seconds | Saturated seconds | Saturation percentage |
|---|---|---|---|
| A | 25174 | 365 | 1.449909% |
| B | 25009 | 462 | 1.847335% |
| C | 25154 | 595 | 2.365429% |
| D | 24600 | 1286 | 5.227642% |
Noise dominated data is calculated using 1-second bins in cleaned event files. If a bin has >2000 counts, and if more than 50% of those come from <1% of pixels, then it is considered to be noise-dominated and hence unusable.
| Quadrant | # 1 sec bins | Bins with >0 counts | Bins with >2000 counts | High rate bins dominated by noise | Noise dominated (total time) | Noise dominated (detector-on time) | Marked lightcurve |
|---|---|---|---|---|---|---|---|
| A | 32609 | 26475 | 0 | 0 | 0.00% | 0.00% |  |
| B | 32609 | 26381 | 0 | 0 | 0.00% | 0.00% |  |
| C | 32609 | 26429 | 0 | 0 | 0.00% | 0.00% |  |
| D | 32609 | 25981 | 0 | 0 | 0.00% | 0.00% |  |
Top three noisy pixels from each quadrant. If the there are fewer than three noisy pixels in the level2.evt file, extra rows are filled as -1
| Pixel properties | Quadrant properties | ||||||
|---|---|---|---|---|---|---|---|
| Quadrant | DetID | PixID | Counts | Sigma | Mean | Median | Sigma |
| A | 0 | 29 | 1311 | 10.99 | 342 | 317 | 90.5 |
| A | 14 | 188 | 1310 | 10.98 | 342 | 317 | 90.5 |
| A | 7 | 110 | 1147 | 9.18 | 342 | 317 | 90.5 |
| B | 2 | 9 | 1108 | 11.26 | 334 | 315 | 70.4 |
| B | 12 | 226 | 913 | 8.49 | 334 | 315 | 70.4 |
| B | 5 | 128 | 888 | 8.14 | 334 | 315 | 70.4 |
| C | 1 | 80 | 976 | 7.01 | 344 | 315 | 94.3 |
| C | 1 | 81 | 960 | 6.84 | 344 | 315 | 94.3 |
| C | 9 | 242 | 895 | 6.15 | 344 | 315 | 94.3 |
| D | 11 | 82 | 816 | 6.34 | 308 | 279 | 84.7 |
| D | 7 | 3 | 800 | 6.15 | 308 | 279 | 84.7 |
| D | 6 | 231 | 794 | 6.08 | 308 | 279 | 84.7 |
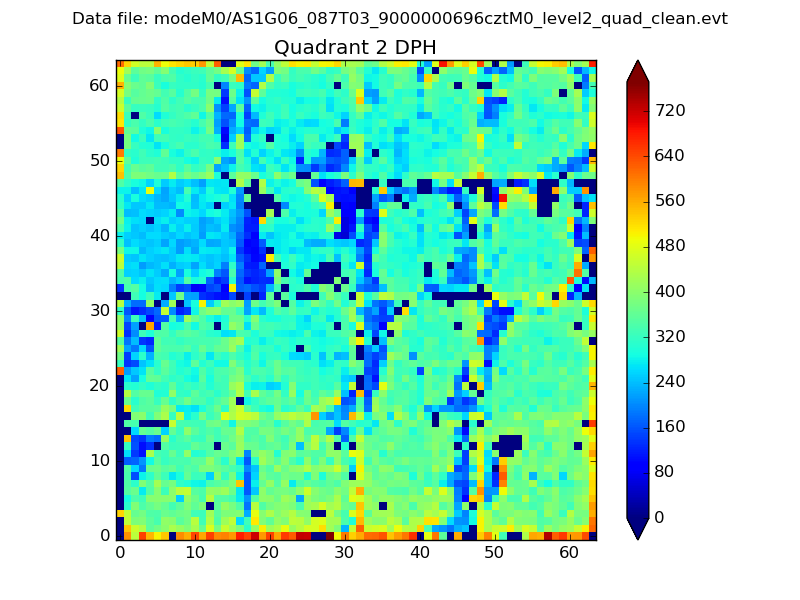
Histogram calculated using DETX and DETY for each event in the final _common_clean file
| Quadrant A |  |
 |
Quadrant B |
|---|---|---|---|
| Quadrant D | 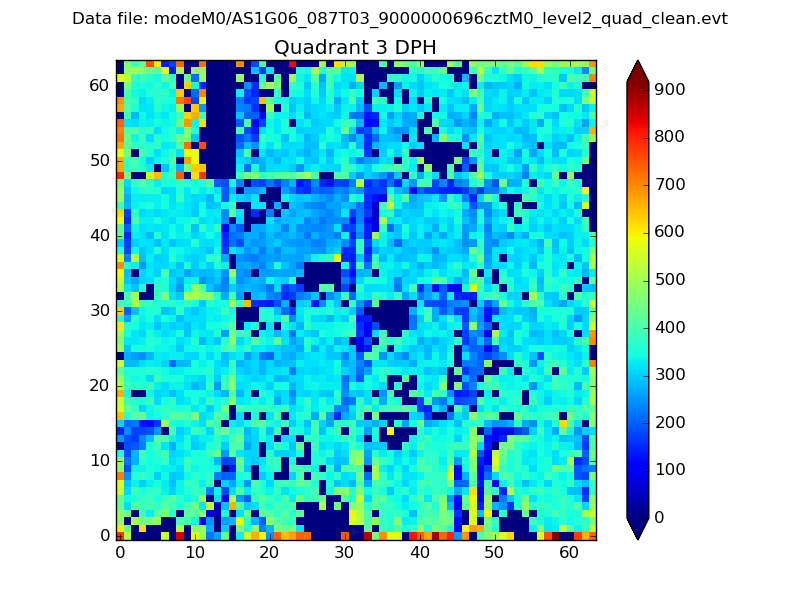 |
 |
Quadrant C |
| Plot type | Count rate plots | Images |
|---|---|---|
| Comparison with Poisson distribution Blue bars denote a histogram of data divided into 1 sec bins. Red curve is a Poisson curve with rate = median count rate of data. |
 |
 |
| Quadrant-wise count rates Data is divided into 100 sec bins |
 |
|
| Module-wise count rates for Quadrant A Data is divided into 100 sec bins |
 |
 |
| Module-wise count rates for Quadrant B Data is divided into 100 sec bins |
 |
 |
| Module-wise count rates for Quadrant C Data is divided into 100 sec bins |
 |
 |
| Module-wise count rates for Quadrant D Data is divided into 100 sec bins |
 |
 |
| Parameter | Plot |
|---|---|
| CZT HV Monitor |  |
| D_VDD |  |
| Temperature 1 |  |
| Veto HV Monitor |  |
| Veto LLD |  |
| Alpha Counter |  |
| _CPM_Rate |  |
| CZT Counter |  |
| +2.5 Volts monitor |  |
| +5 Volts monitor |  |
| _ROLL_ROT |  |
| _Roll_DEC |  |
| _Roll_RA |  |
| Veto Counter |  |