| Param | Original file | Final file |
|---|---|---|
| Filename | modeM0/AS1G06_087T03_9000000696_05461cztM0_level2.evt | modeM0/AS1G06_087T03_9000000696_05461cztM0_level2_quad_clean.evt |
| Size (bytes) | 521,245,440 | 81,953,280 |
| Size | 497.1 MB | 78.2 MB |
| Events in quadrant A | 3,294,297 | 498,839 |
| Events in quadrant B | 3,555,516 | 497,660 |
| Events in quadrant C | 3,264,299 | 502,052 |
| Events in quadrant D | 5,167,033 | 466,101 |
| Mode SS | |||
|---|---|---|---|
| Quadrant | BADHDUFLAG | Total packets | Discarded packets |
| A | 0 | 156 | 6 |
| B | 0 | 156 | 4 |
| C | 0 | 155 | 3 |
| D | 0 | 156 | 4 |
| Mode M9 | |||
|---|---|---|---|
| Quadrant | BADHDUFLAG | Total packets | Discarded packets |
| A | 0 | 4 | 0 |
| B | 0 | 4 | 0 |
| C | 0 | 4 | 0 |
| D | 0 | 5 | 0 |
| Mode M0 | |||
|---|---|---|---|
| Quadrant | BADHDUFLAG | Total packets | Discarded packets |
| A | 0 | 15767 | 533 |
| B | 0 | 16334 | 595 |
| C | 0 | 15689 | 476 |
| D | 0 | 21617 | 1027 |
| Quadrant | Total seconds | Saturated seconds | Saturation percentage |
|---|---|---|---|
| A | 7428 | 29 | 0.390415% |
| B | 7413 | 59 | 0.795899% |
| C | 7454 | 24 | 0.321975% |
| D | 7382 | 337 | 4.565158% |
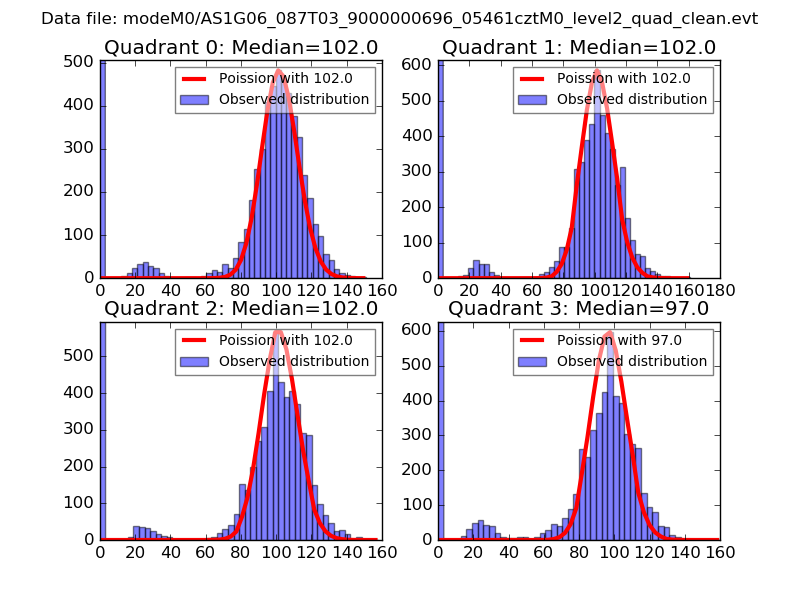
Noise dominated data is calculated using 1-second bins in cleaned event files. If a bin has >2000 counts, and if more than 50% of those come from <1% of pixels, then it is considered to be noise-dominated and hence unusable.
| Quadrant | # 1 sec bins | Bins with >0 counts | Bins with >2000 counts | High rate bins dominated by noise | Noise dominated (total time) | Noise dominated (detector-on time) | Marked lightcurve |
|---|---|---|---|---|---|---|---|
| A | 7898 | 7662 | 2 | 2 | 0.03% | 0.03% | 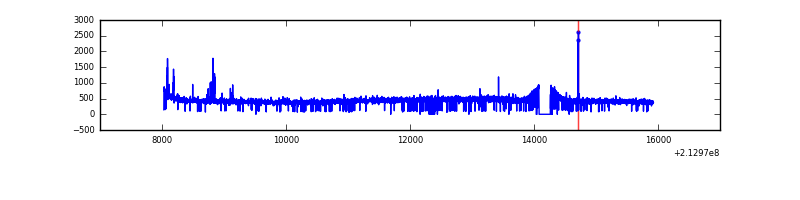 |
| B | 7898 | 7647 | 12 | 12 | 0.15% | 0.16% | 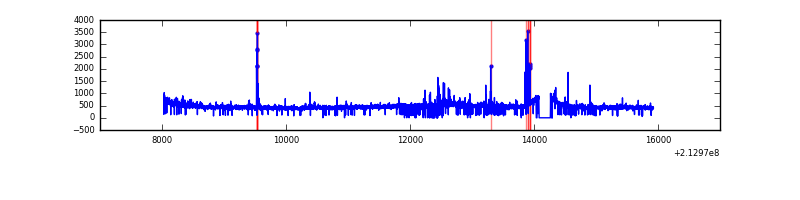 |
| C | 7898 | 7665 | 0 | 0 | 0.00% | 0.00% | 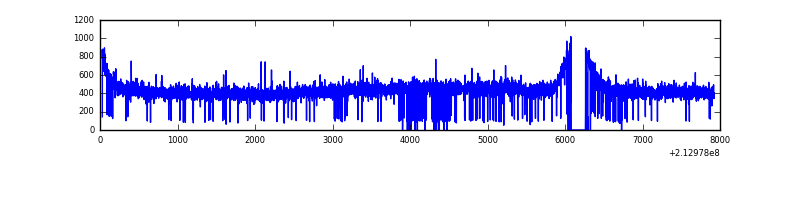 |
| D | 7898 | 7658 | 256 | 256 | 3.24% | 3.34% | 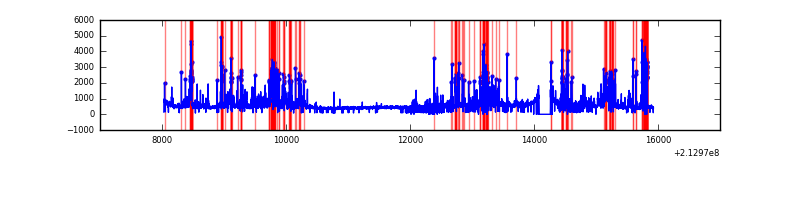 |
Top three noisy pixels from each quadrant. If the there are fewer than three noisy pixels in the level2.evt file, extra rows are filled as -1
| Pixel properties | Quadrant properties | ||||||
|---|---|---|---|---|---|---|---|
| Quadrant | DetID | PixID | Counts | Sigma | Mean | Median | Sigma |
| A | 0 | 50 | 38949 | 217.82 | 841 | 820 | 175.0 |
| A | 0 | 226 | 8374 | 43.15 | 841 | 820 | 175.0 |
| A | 12 | 194 | 8261 | 42.51 | 841 | 820 | 175.0 |
| B | 15 | 204 | 56855 | 335.6 | 854 | 833 | 166.9 |
| B | 11 | 51 | 45949 | 270.27 | 854 | 833 | 166.9 |
| B | 4 | 48 | 40546 | 237.9 | 854 | 833 | 166.9 |
| C | 8 | 128 | 19901 | 99.64 | 824 | 828 | 191.4 |
| C | 8 | 112 | 9309 | 44.3 | 824 | 828 | 191.4 |
| C | 8 | 144 | 7367 | 34.16 | 824 | 828 | 191.4 |
| D | 2 | 33 | 1457114 | 7367.1 | 802 | 776 | 197.7 |
| D | 8 | 195 | 154826 | 779.28 | 802 | 776 | 197.7 |
| D | 4 | 95 | 126923 | 638.13 | 802 | 776 | 197.7 |
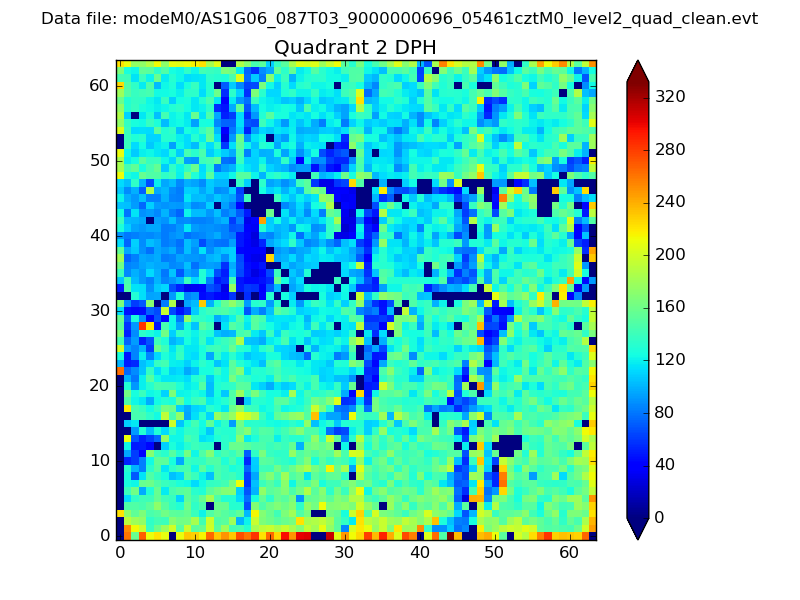
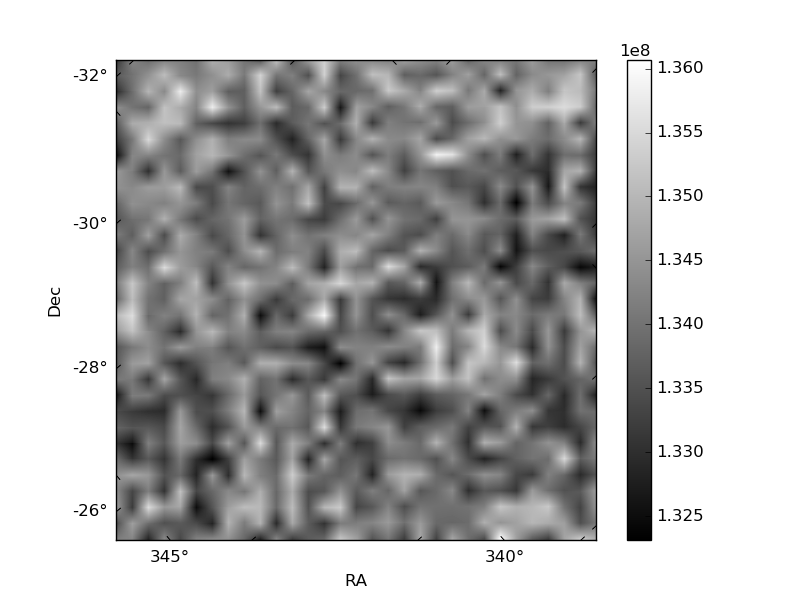
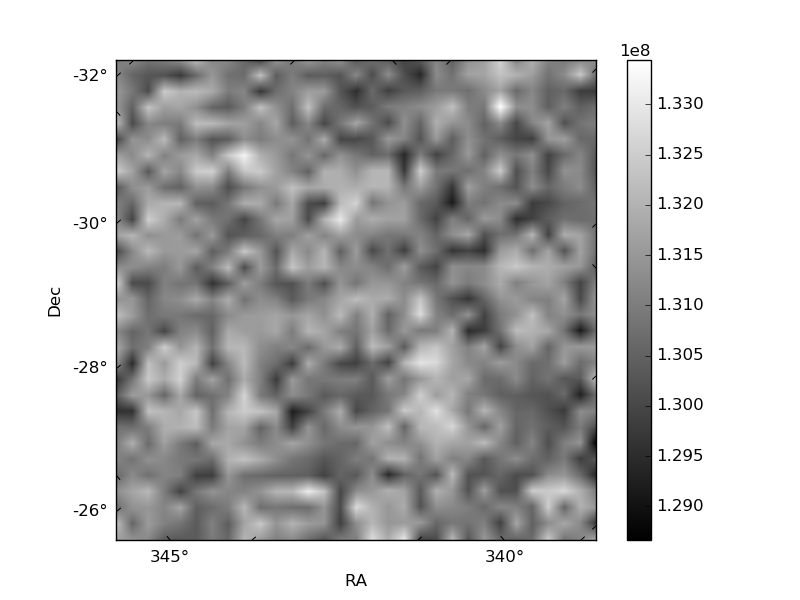
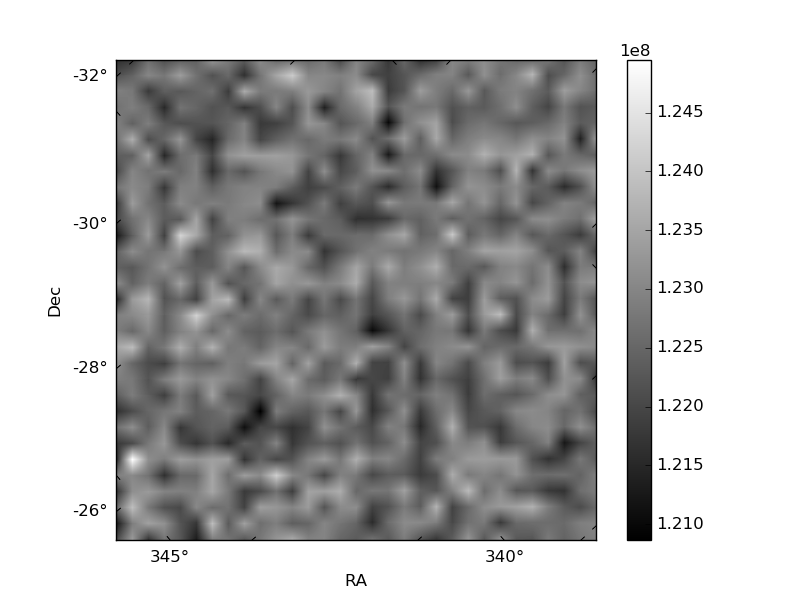
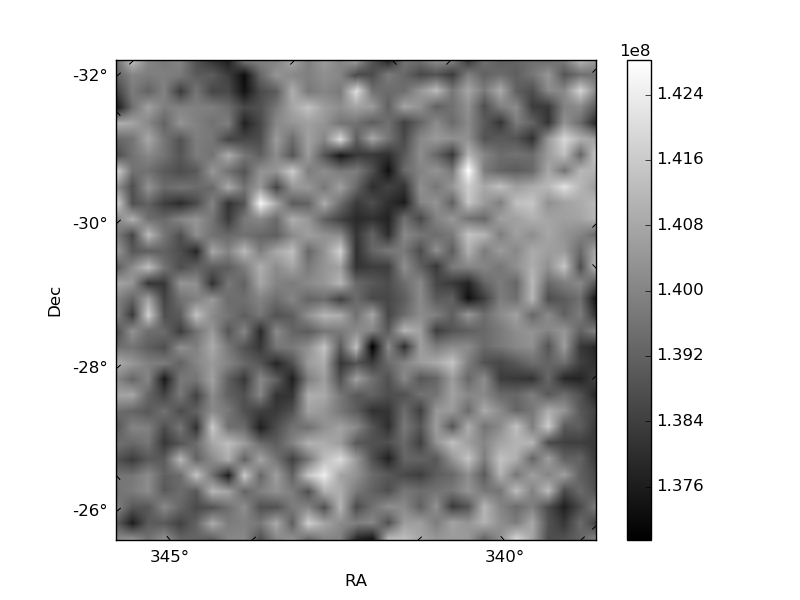
Histogram calculated using DETX and DETY for each event in the final _common_clean file
| Quadrant A | 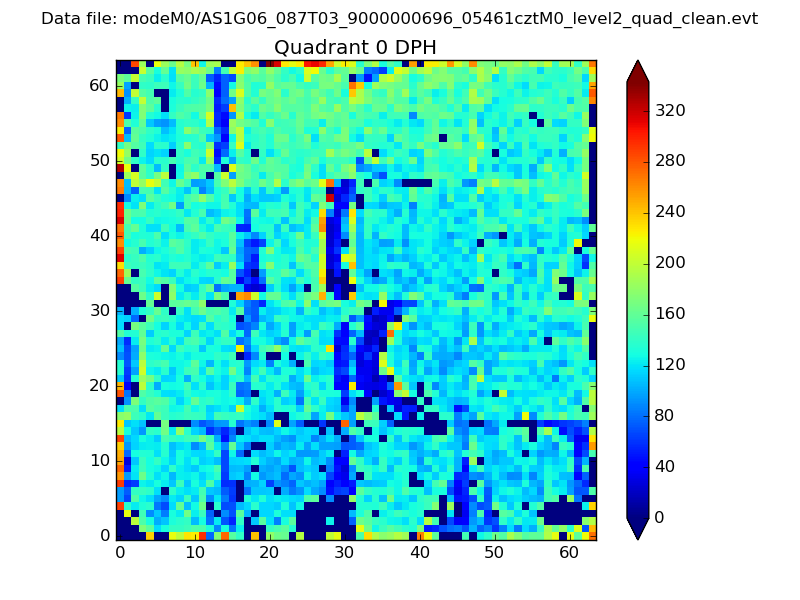 |
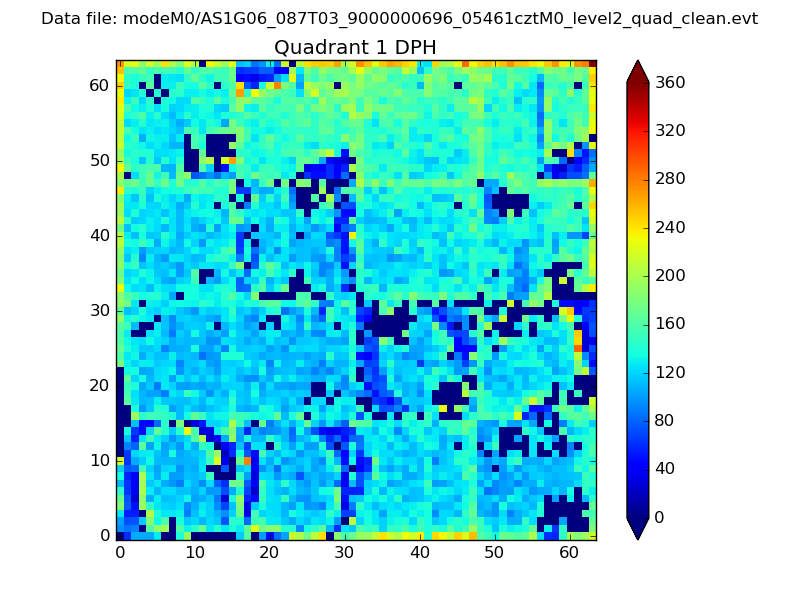 |
Quadrant B |
|---|---|---|---|
| Quadrant D | 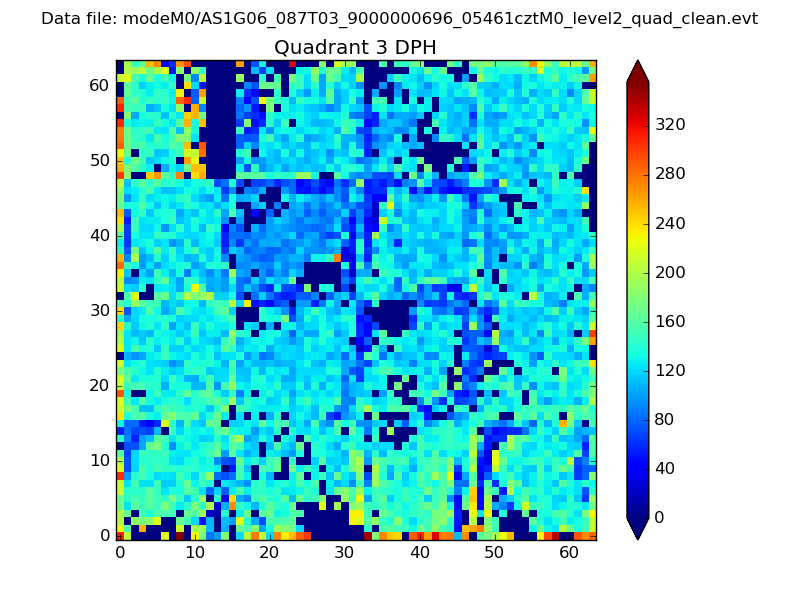 |
 |
Quadrant C |
| Plot type | Count rate plots | Images |
|---|---|---|
| Comparison with Poisson distribution Blue bars denote a histogram of data divided into 1 sec bins. Red curve is a Poisson curve with rate = median count rate of data. |
 |
 |
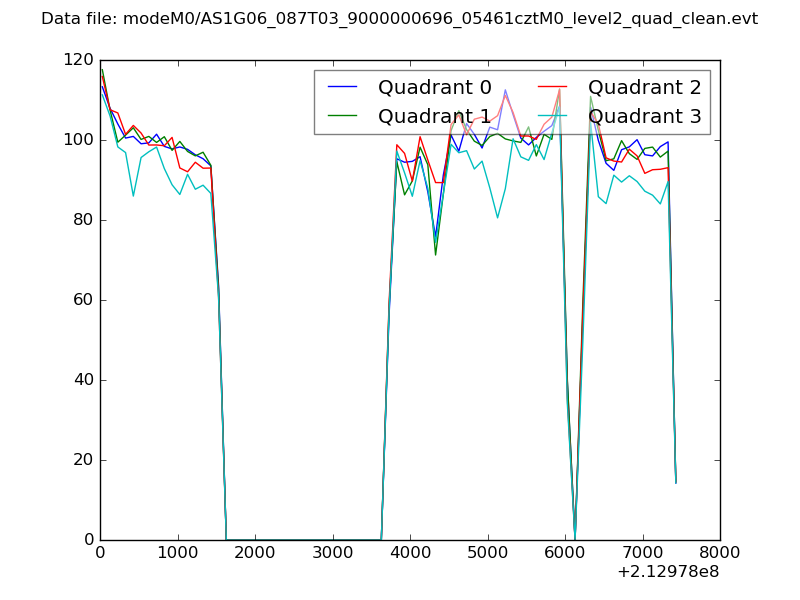
| Quadrant-wise count rates Data is divided into 100 sec bins |
 |
|
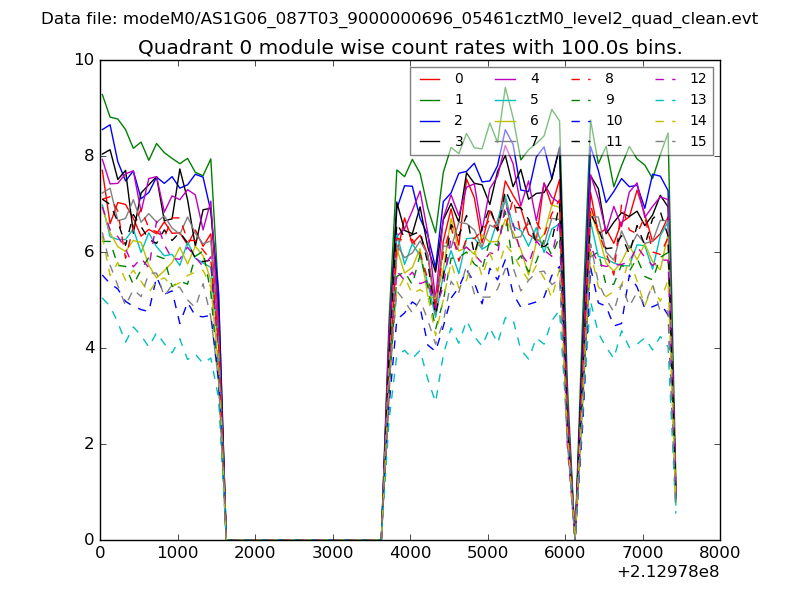
| Module-wise count rates for Quadrant A Data is divided into 100 sec bins |
 |
 |
| Module-wise count rates for Quadrant B Data is divided into 100 sec bins |
 |
 |
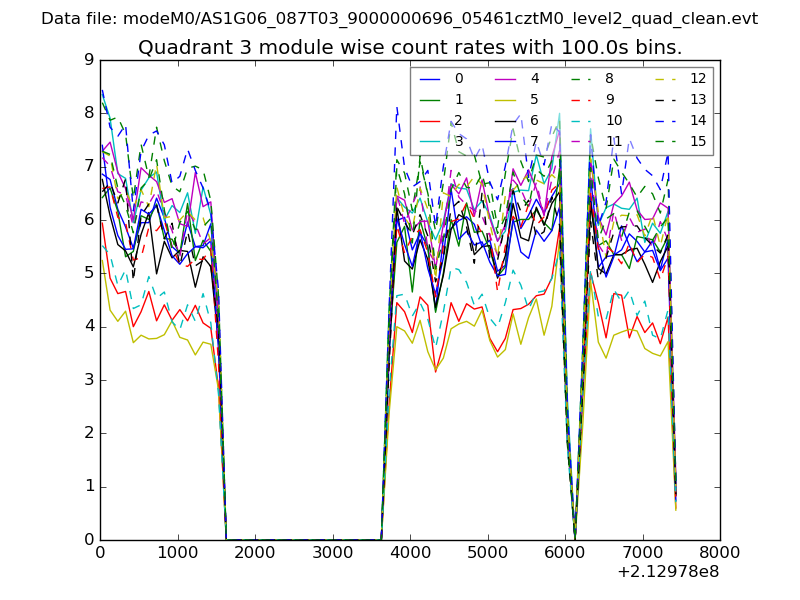
| Module-wise count rates for Quadrant C Data is divided into 100 sec bins |
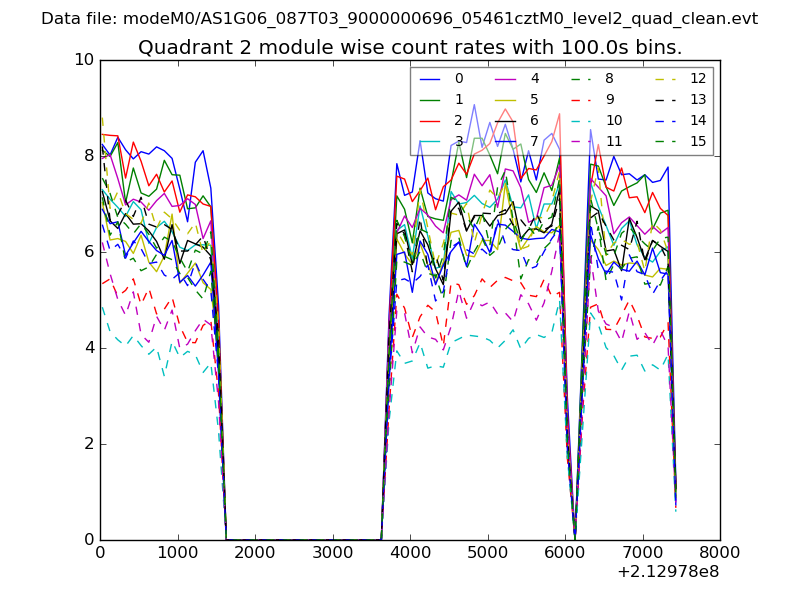 |
 |
| Module-wise count rates for Quadrant D Data is divided into 100 sec bins |
 |
 |
| Parameter | Plot |
|---|---|
| CZT HV Monitor | 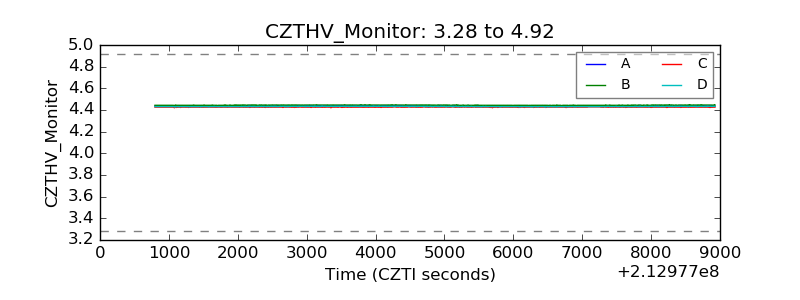 |
| D_VDD | 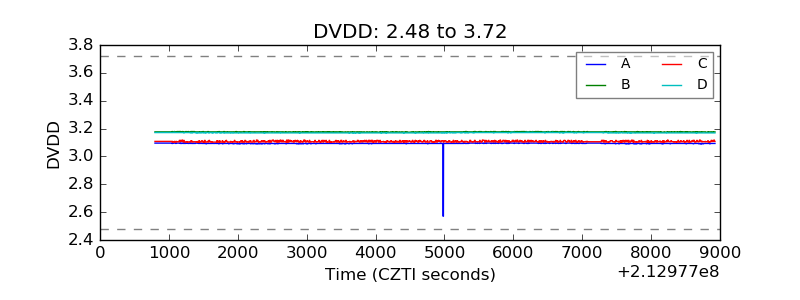 |
| Temperature 1 | 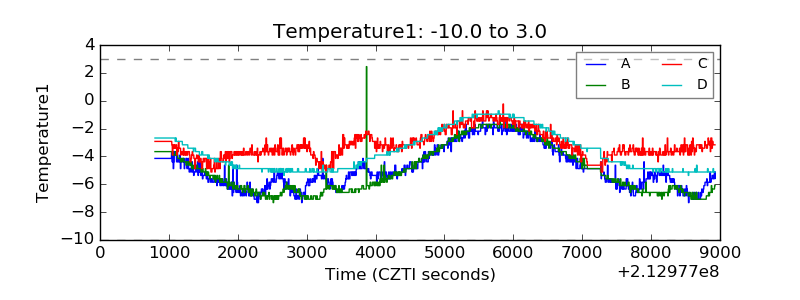 |
| Veto HV Monitor | 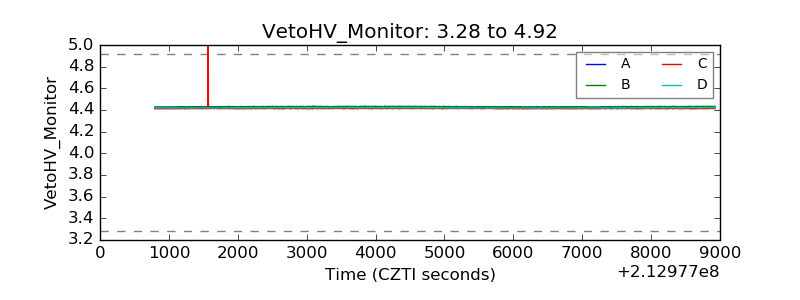 |
| Veto LLD |  |
| Alpha Counter | 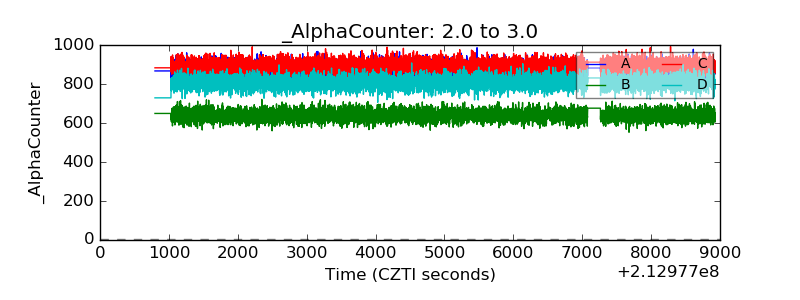 |
| _CPM_Rate | 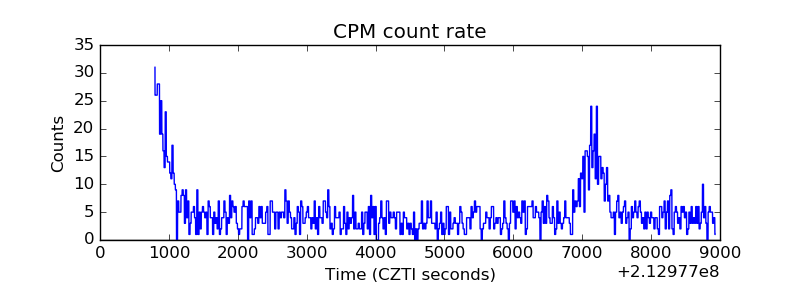 |
| CZT Counter | 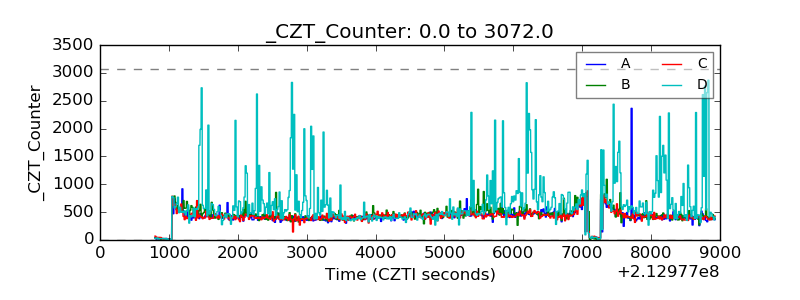 |
| +2.5 Volts monitor |  |
| +5 Volts monitor |  |
| _ROLL_ROT |  |
| _Roll_DEC | 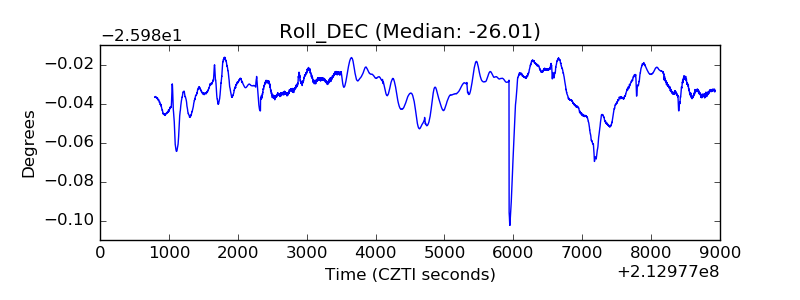 |
| _Roll_RA | 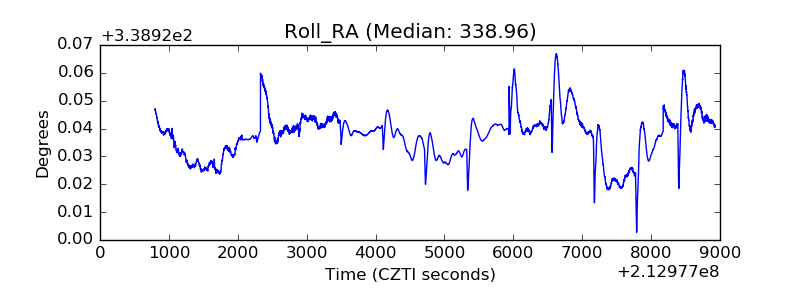 |
| Veto Counter |  |