| Param | Original file | Final file |
|---|---|---|
| Filename | modeM0/AS1G06_087T03_9000000696_05462cztM0_level2.evt | modeM0/AS1G06_087T03_9000000696_05462cztM0_level2_quad_clean.evt |
| Size (bytes) | 397,028,160 | 65,125,440 |
| Size | 378.6 MB | 62.1 MB |
| Events in quadrant A | 2,619,542 | 419,481 |
| Events in quadrant B | 2,798,866 | 405,779 |
| Events in quadrant C | 2,581,053 | 416,088 |
| Events in quadrant D | 3,651,194 | 347,900 |
| Mode SS | |||
|---|---|---|---|
| Quadrant | BADHDUFLAG | Total packets | Discarded packets |
| A | 0 | 171 | 62 |
| B | 0 | 171 | 65 |
| C | 0 | 171 | 63 |
| D | 0 | 172 | 60 |
| Mode M9 | |||
|---|---|---|---|
| Quadrant | BADHDUFLAG | Total packets | Discarded packets |
| A | 0 | 4 | 0 |
| B | 0 | 4 | 0 |
| C | 0 | 4 | 0 |
| D | 0 | 4 | 1 |
| Mode M0 | |||
|---|---|---|---|
| Quadrant | BADHDUFLAG | Total packets | Discarded packets |
| A | 0 | 17632 | 5818 |
| B | 0 | 18528 | 6417 |
| C | 0 | 17610 | 5833 |
| D | 0 | 25942 | 11568 |
| Quadrant | Total seconds | Saturated seconds | Saturation percentage |
|---|---|---|---|
| A | 5630 | 110 | 1.953819% |
| B | 5519 | 156 | 2.826599% |
| C | 5606 | 122 | 2.176240% |
| D | 5066 | 331 | 6.533754% |
Noise dominated data is calculated using 1-second bins in cleaned event files. If a bin has >2000 counts, and if more than 50% of those come from <1% of pixels, then it is considered to be noise-dominated and hence unusable.
| Quadrant | # 1 sec bins | Bins with >0 counts | Bins with >2000 counts | High rate bins dominated by noise | Noise dominated (total time) | Noise dominated (detector-on time) | Marked lightcurve |
|---|---|---|---|---|---|---|---|
| A | 8838 | 6993 | 2 | 2 | 0.02% | 0.03% | 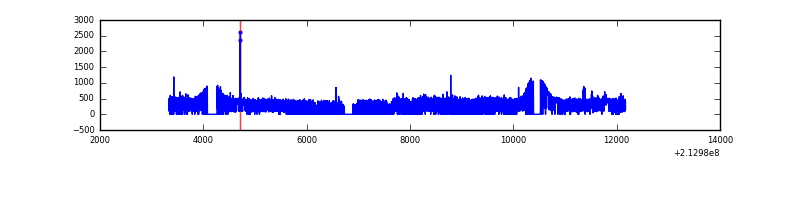 |
| B | 8838 | 6944 | 4 | 4 | 0.05% | 0.06% | 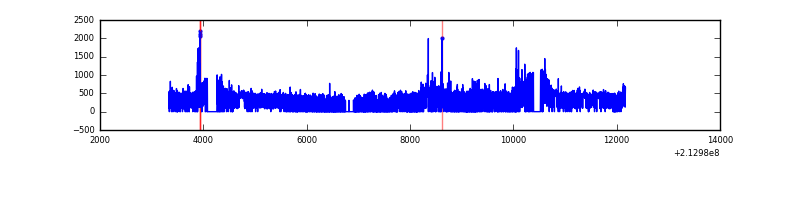 |
| C | 8838 | 6984 | 0 | 0 | 0.00% | 0.00% | 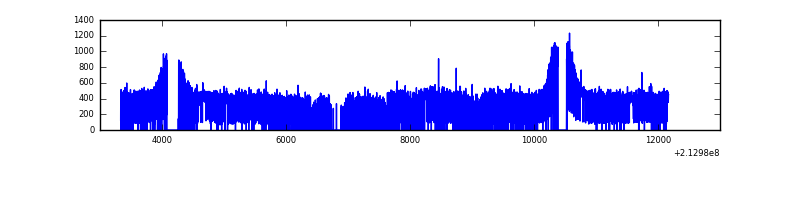 |
| D | 8838 | 6470 | 136 | 136 | 1.54% | 2.10% | 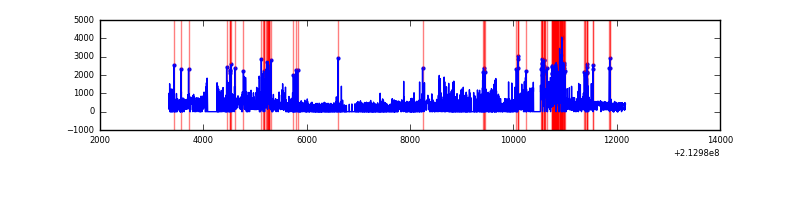 |
Top three noisy pixels from each quadrant. If the there are fewer than three noisy pixels in the level2.evt file, extra rows are filled as -1
| Pixel properties | Quadrant properties | ||||||
|---|---|---|---|---|---|---|---|
| Quadrant | DetID | PixID | Counts | Sigma | Mean | Median | Sigma |
| A | 0 | 247 | 21653 | 150.13 | 668 | 651 | 139.9 |
| A | 0 | 50 | 12649 | 85.77 | 668 | 651 | 139.9 |
| A | 0 | 226 | 8390 | 55.32 | 668 | 651 | 139.9 |
| B | 15 | 204 | 80925 | 611.71 | 663 | 646 | 131.2 |
| B | 8 | 3 | 40263 | 301.87 | 663 | 646 | 131.2 |
| B | 10 | 16 | 36559 | 273.65 | 663 | 646 | 131.2 |
| C | 8 | 128 | 10977 | 66.53 | 655 | 658 | 155.1 |
| C | 8 | 112 | 5301 | 29.94 | 655 | 658 | 155.1 |
| C | 13 | 61 | 5223 | 29.43 | 655 | 658 | 155.1 |
| D | 2 | 33 | 1121386 | 7686.22 | 580 | 558 | 145.8 |
| D | 8 | 195 | 131047 | 894.85 | 580 | 558 | 145.8 |
| D | 4 | 95 | 48637 | 329.71 | 580 | 558 | 145.8 |
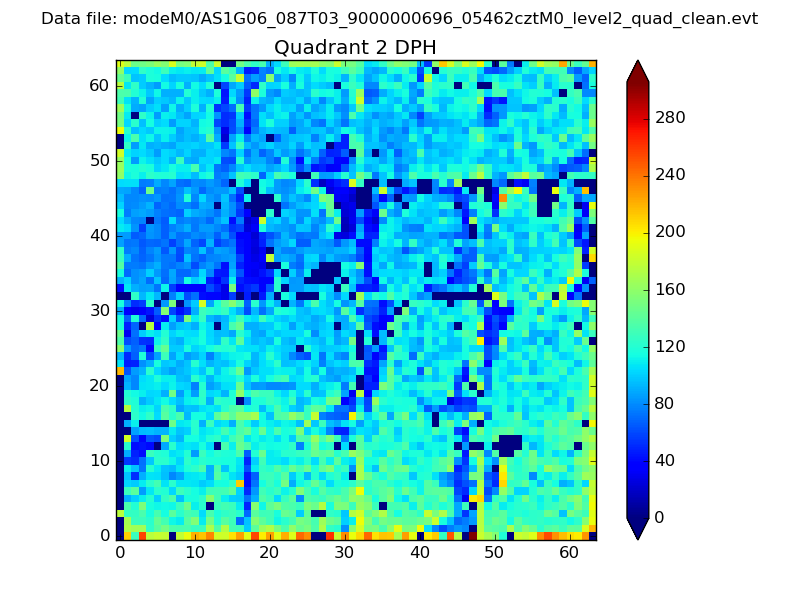
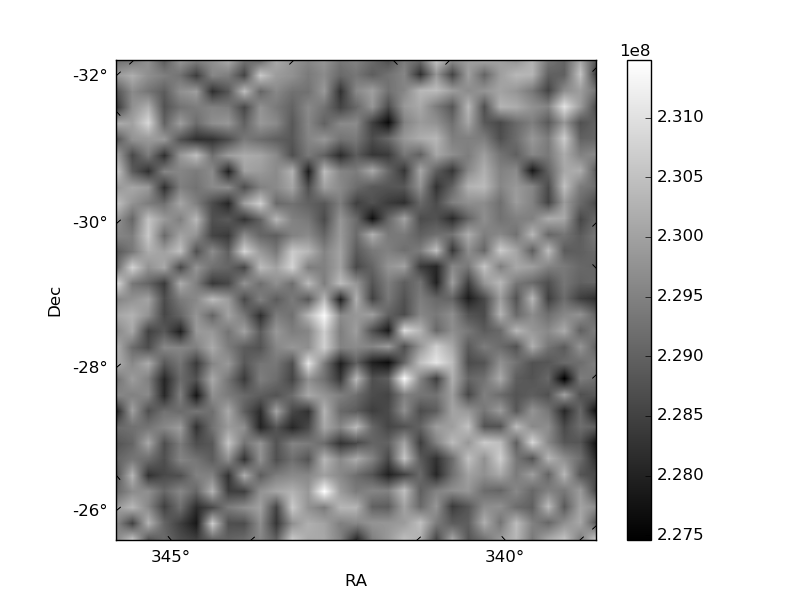
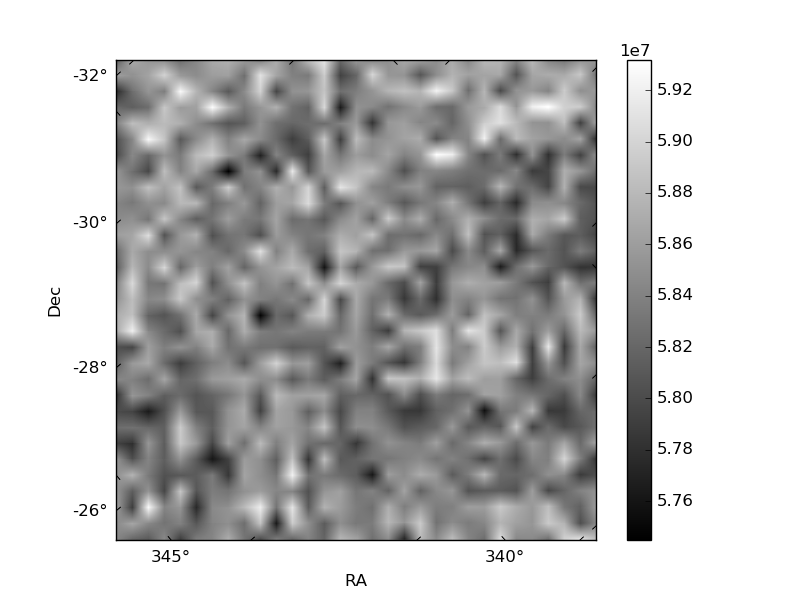
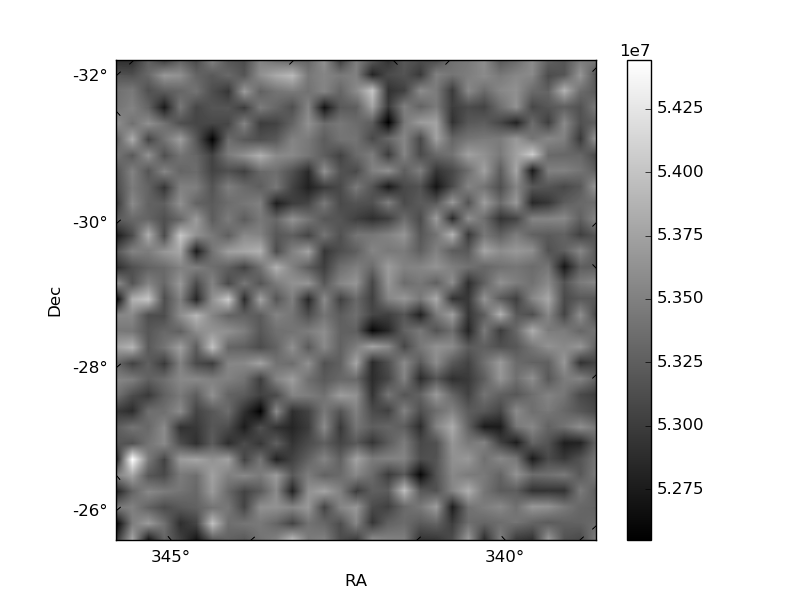
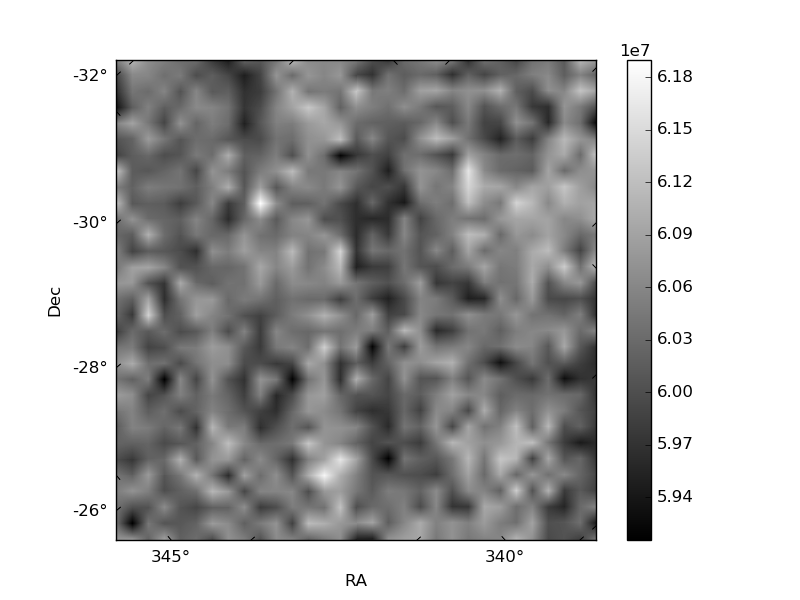
Histogram calculated using DETX and DETY for each event in the final _common_clean file
| Quadrant A | 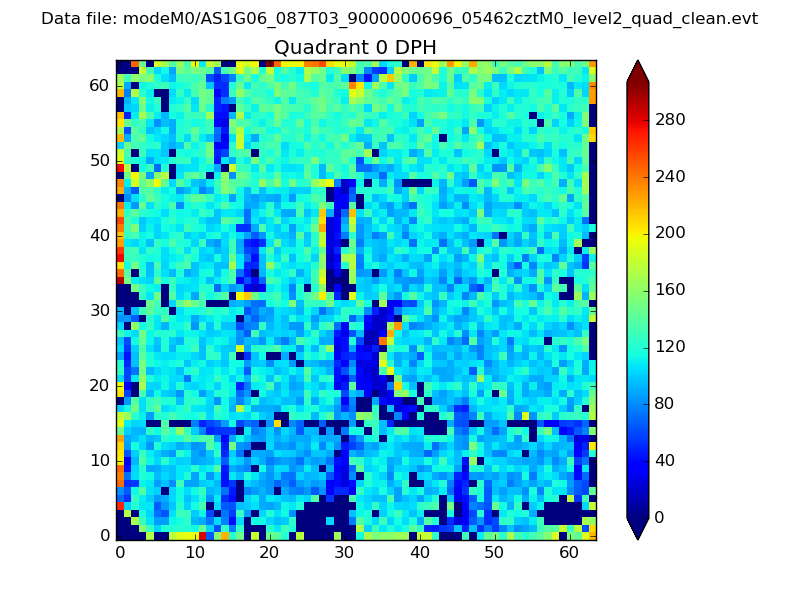 |
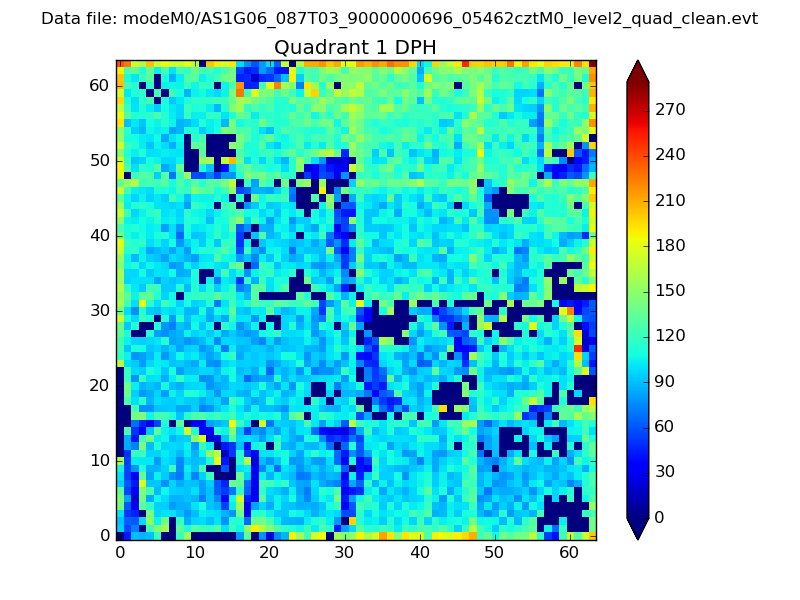 |
Quadrant B |
|---|---|---|---|
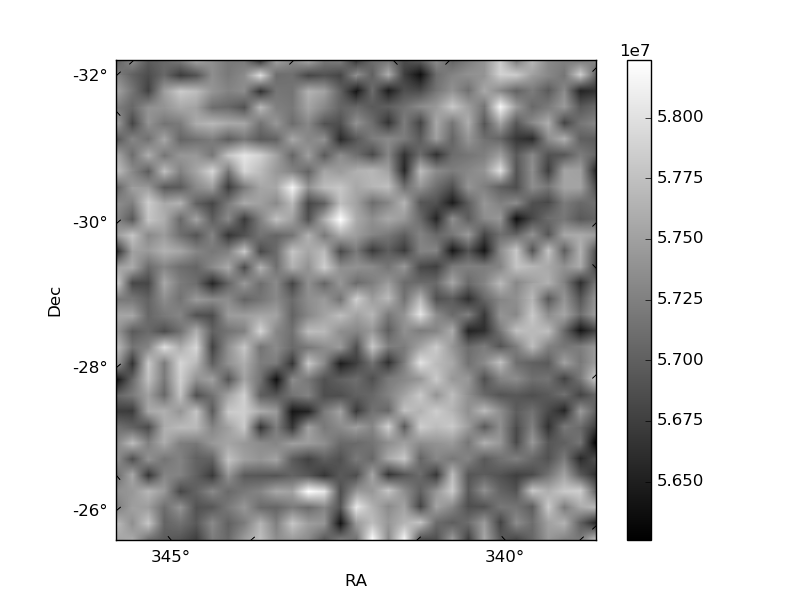
| Quadrant D | 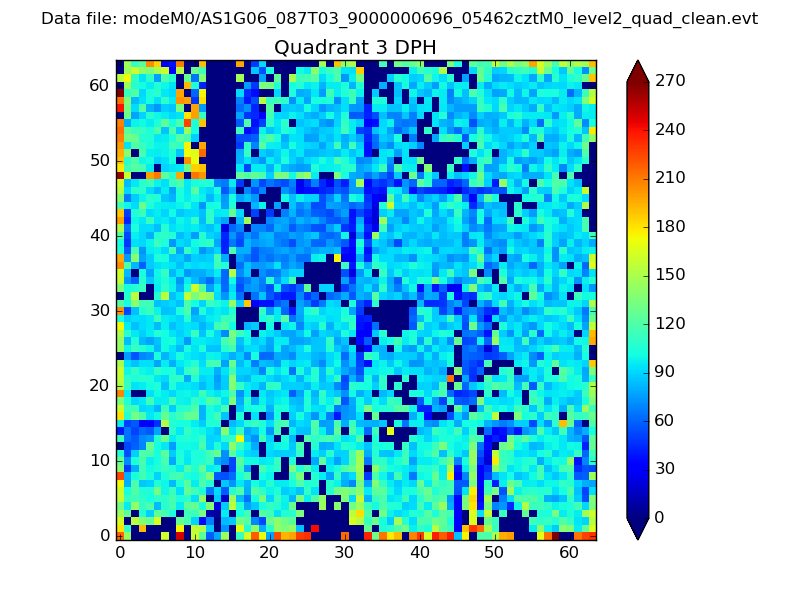 |
 |
Quadrant C |
| Plot type | Count rate plots | Images |
|---|---|---|
| Comparison with Poisson distribution Blue bars denote a histogram of data divided into 1 sec bins. Red curve is a Poisson curve with rate = median count rate of data. |
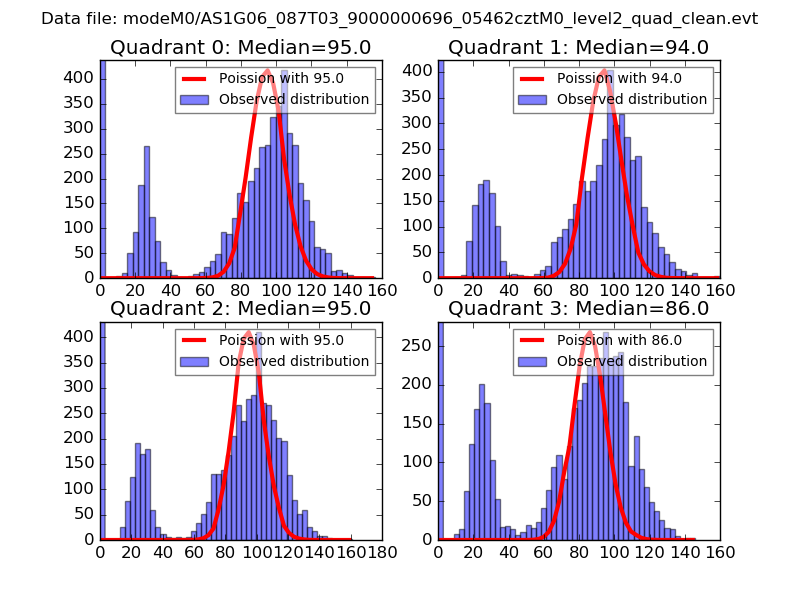 |
 |
| Quadrant-wise count rates Data is divided into 100 sec bins |
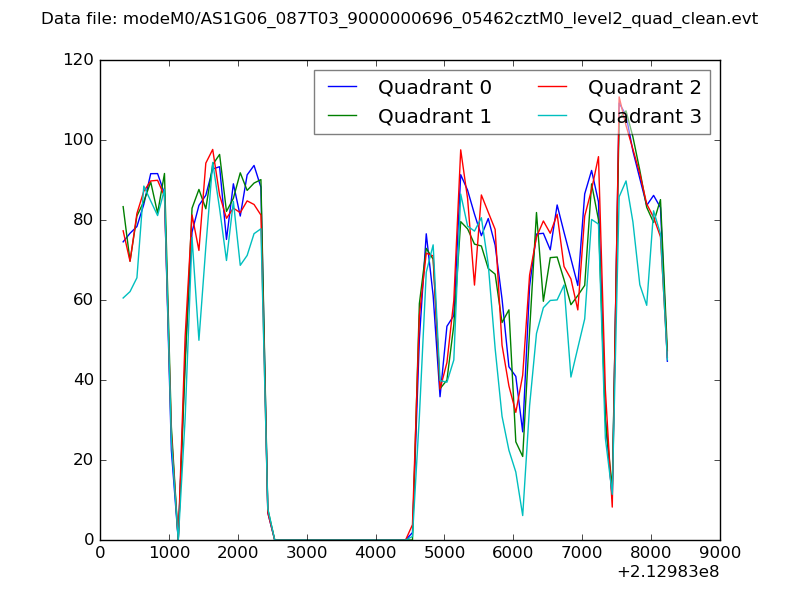 |
|
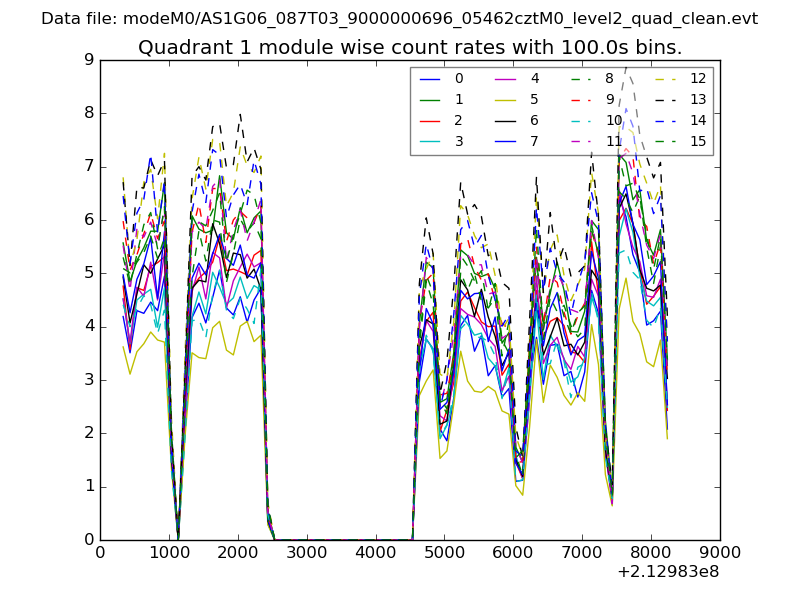
| Module-wise count rates for Quadrant A Data is divided into 100 sec bins |
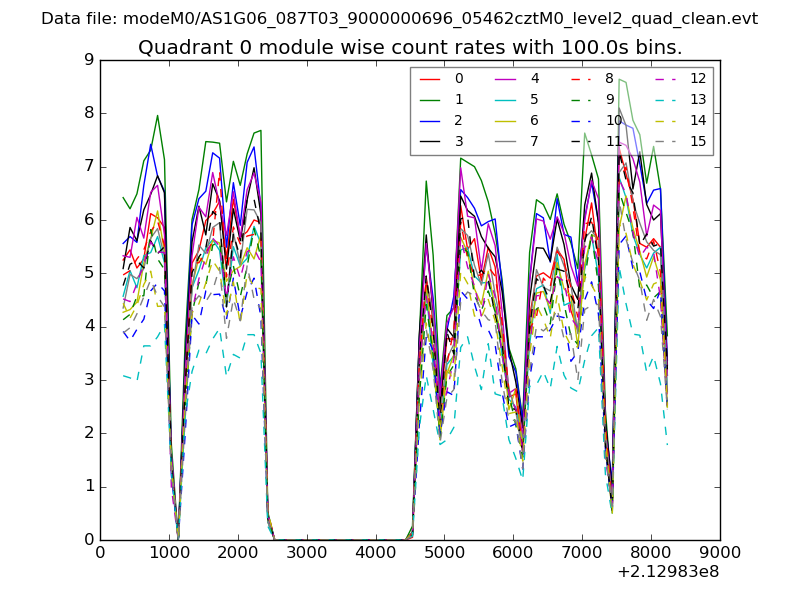 |
 |
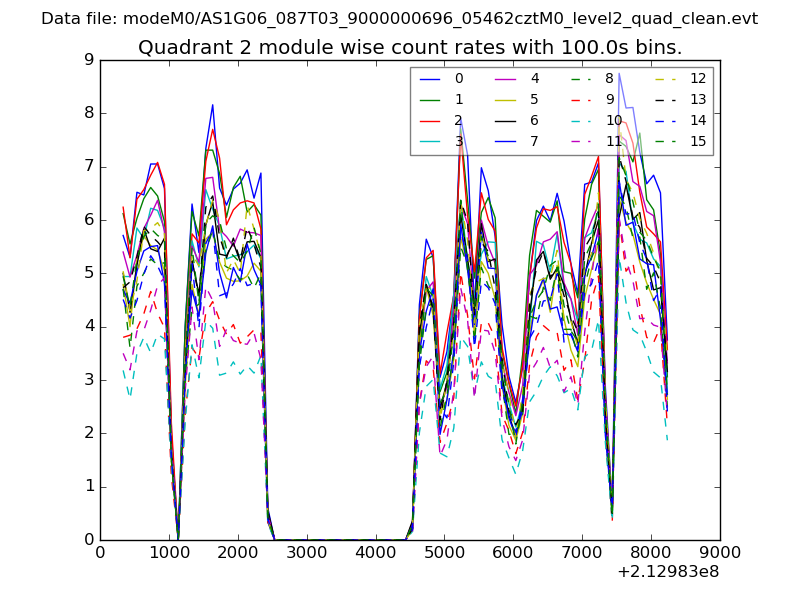
| Module-wise count rates for Quadrant B Data is divided into 100 sec bins |
 |
 |
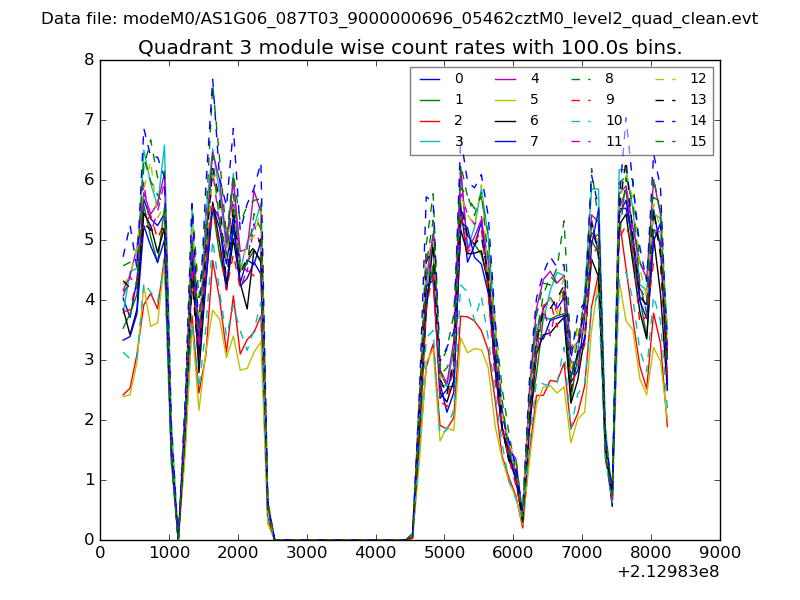
| Module-wise count rates for Quadrant C Data is divided into 100 sec bins |
 |
 |
| Module-wise count rates for Quadrant D Data is divided into 100 sec bins |
 |
 |
| Parameter | Plot |
|---|---|
| CZT HV Monitor | 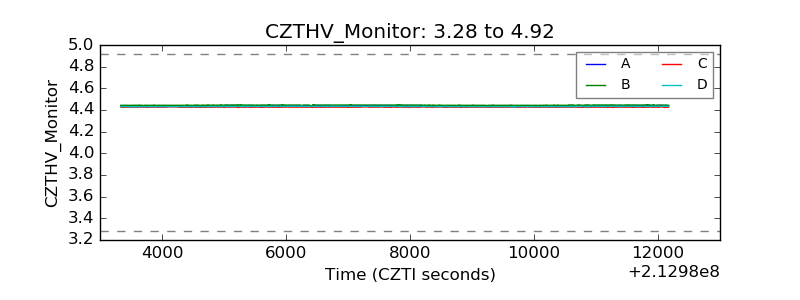 |
| D_VDD | 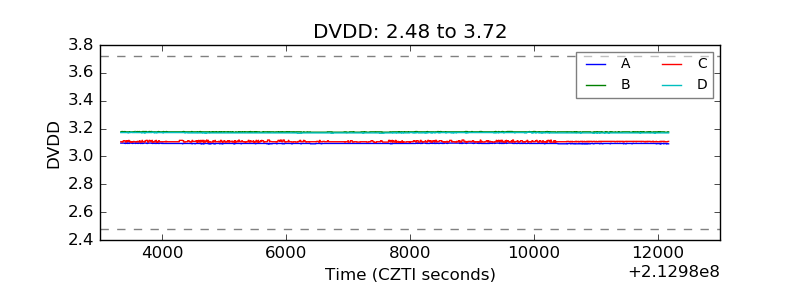 |
| Temperature 1 | 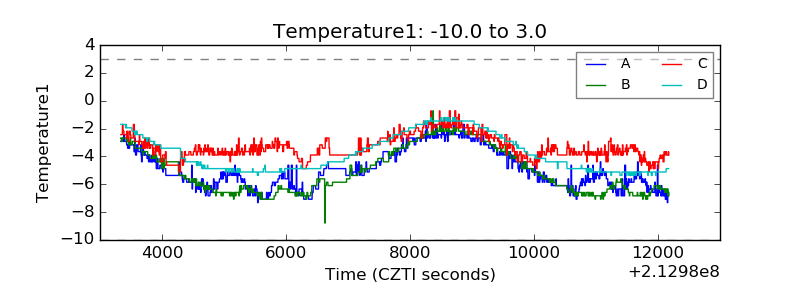 |
| Veto HV Monitor | 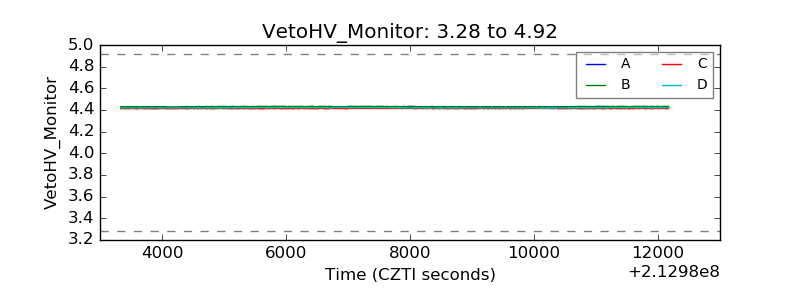 |
| Veto LLD | 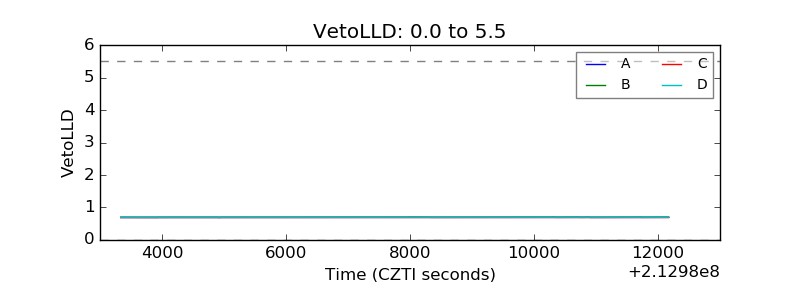 |
| Alpha Counter | 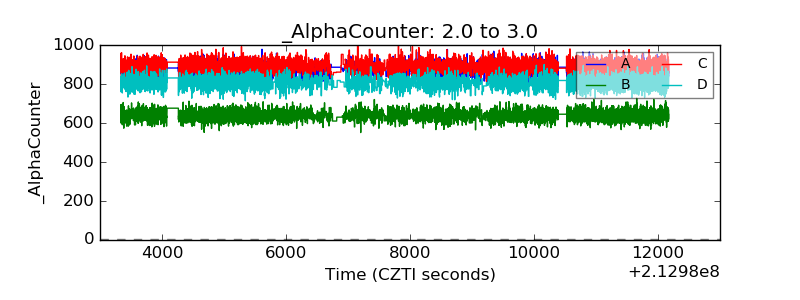 |
| _CPM_Rate | 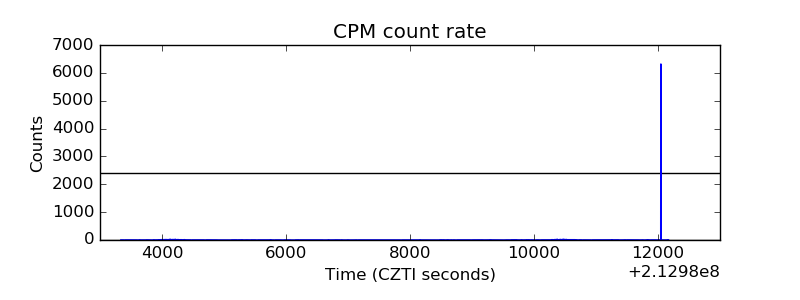 |
| CZT Counter | 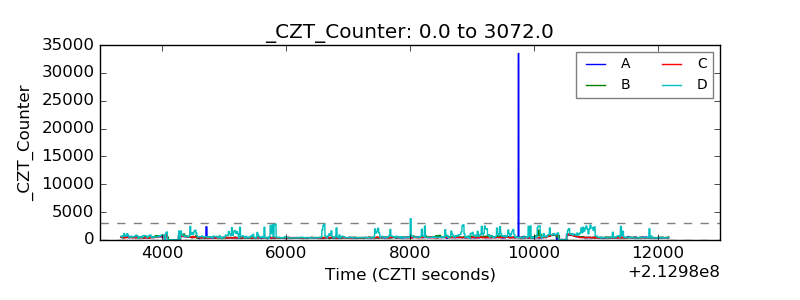 |
| +2.5 Volts monitor |  |
| +5 Volts monitor |  |
| _ROLL_ROT | 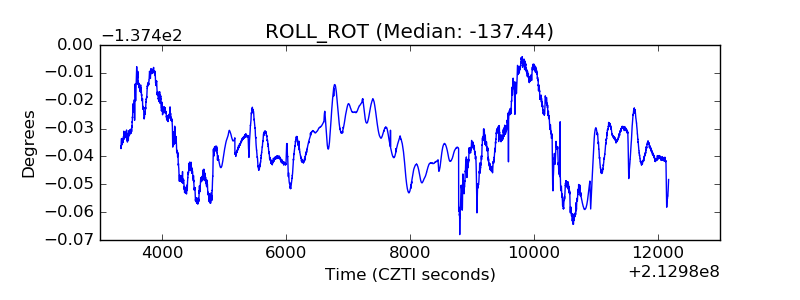 |
| _Roll_DEC |  |
| _Roll_RA | 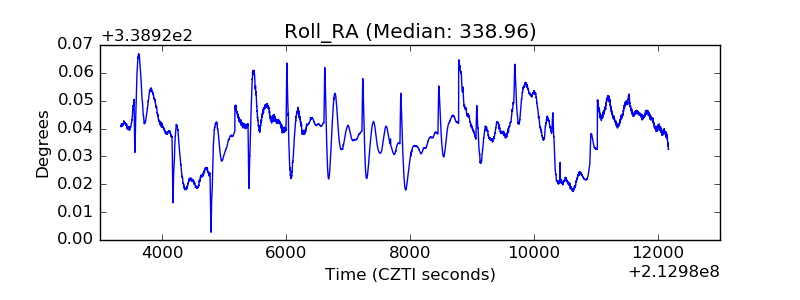 |
| Veto Counter | 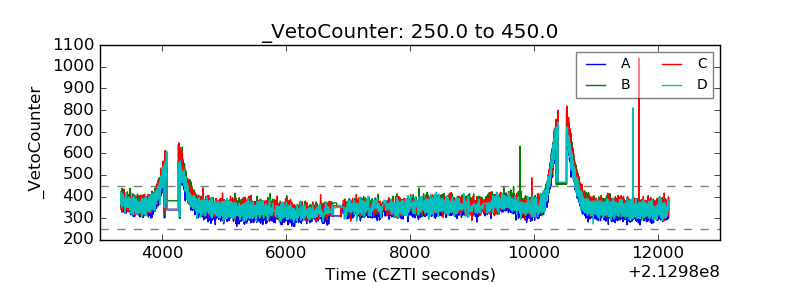 |