| Param | Original file | Final file |
|---|---|---|
| Filename | modeM0/AS1T01_138T01_9000000698cztM0_level2.fits | modeM0/AS1T01_138T01_9000000698cztM0_level2_quad_clean.evt |
| Size (bytes) | 706,544,640 | 719,072,640 |
| Size | 673.8 MB | 685.8 MB |
| Events in quadrant A | 4,226,160 | 4,258,491 |
| Events in quadrant B | 4,076,066 | 4,245,183 |
| Events in quadrant C | 4,177,308 | 4,186,565 |
| Events in quadrant D | 3,504,330 | 3,675,140 |
| Mode M9 | |||
|---|---|---|---|
| Quadrant | BADHDUFLAG | Total packets | Discarded packets |
| A | 0 | 116 | 0 |
| B | 0 | 116 | 0 |
| C | 0 | 116 | 0 |
| D | 0 | 116 | 0 |
| Mode SS | |||
|---|---|---|---|
| Quadrant | BADHDUFLAG | Total packets | Discarded packets |
| A | 0 | 1606 | 0 |
| B | 0 | 1606 | 0 |
| C | 0 | 1606 | 0 |
| D | 0 | 1606 | 0 |
| Mode M0 | |||
|---|---|---|---|
| Quadrant | BADHDUFLAG | Total packets | Discarded packets |
| A | 0 | 168321 | 0 |
| B | 0 | 179682 | 0 |
| C | 0 | 162399 | 0 |
| D | 0 | 198086 | 0 |
| Quadrant | Total seconds | Saturated seconds | Saturation percentage |
|---|---|---|---|
| A | 78938 | 1261 | 1.597456% |
| B | 78943 | 1388 | 1.758231% |
| C | 78936 | 623 | 0.789247% |
| D | 78941 | 3297 | 4.176537% |
Noise dominated data is calculated using 1-second bins in cleaned event files. If a bin has >2000 counts, and if more than 50% of those come from <1% of pixels, then it is considered to be noise-dominated and hence unusable.
| Quadrant | # 1 sec bins | Bins with >0 counts | Bins with >2000 counts | High rate bins dominated by noise | Noise dominated (total time) | Noise dominated (detector-on time) | Marked lightcurve |
|---|---|---|---|---|---|---|---|
| A | 90478 | 78938 | 0 | 0 | 0.00% | 0.00% |  |
| B | 90478 | 78942 | 0 | 0 | 0.00% | 0.00% |  |
| C | 90478 | 78942 | 0 | 0 | 0.00% | 0.00% |  |
| D | 90478 | 78924 | 0 | 0 | 0.00% | 0.00% |  |
Top three noisy pixels from each quadrant. If the there are fewer than three noisy pixels in the level2.evt file, extra rows are filled as -1
| Pixel properties | Quadrant properties | ||||||
|---|---|---|---|---|---|---|---|
| Quadrant | DetID | PixID | Counts | Sigma | Mean | Median | Sigma |
| A | 0 | 29 | 4229 | 11.39 | 1095 | 1020 | 281.6 |
| A | 14 | 188 | 4162 | 11.16 | 1095 | 1020 | 281.6 |
| A | 7 | 110 | 3730 | 9.62 | 1095 | 1020 | 281.6 |
| B | 2 | 9 | 3606 | 11.9 | 1076 | 1021 | 217.2 |
| B | 12 | 226 | 2937 | 8.82 | 1076 | 1021 | 217.2 |
| B | 14 | 254 | 2904 | 8.67 | 1076 | 1021 | 217.2 |
| C | 1 | 80 | 3192 | 7.37 | 1102 | 1018 | 295.1 |
| C | 1 | 81 | 3050 | 6.89 | 1102 | 1018 | 295.1 |
| C | 12 | 241 | 2879 | 6.31 | 1102 | 1018 | 295.1 |
| D | 11 | 82 | 2775 | 7.12 | 998 | 905 | 262.7 |
| D | 3 | 14 | 2618 | 6.52 | 998 | 905 | 262.7 |
| D | 1 | 19 | 2590 | 6.41 | 998 | 905 | 262.7 |
Histogram calculated using DETX and DETY for each event in the final _common_clean file
| Quadrant A | 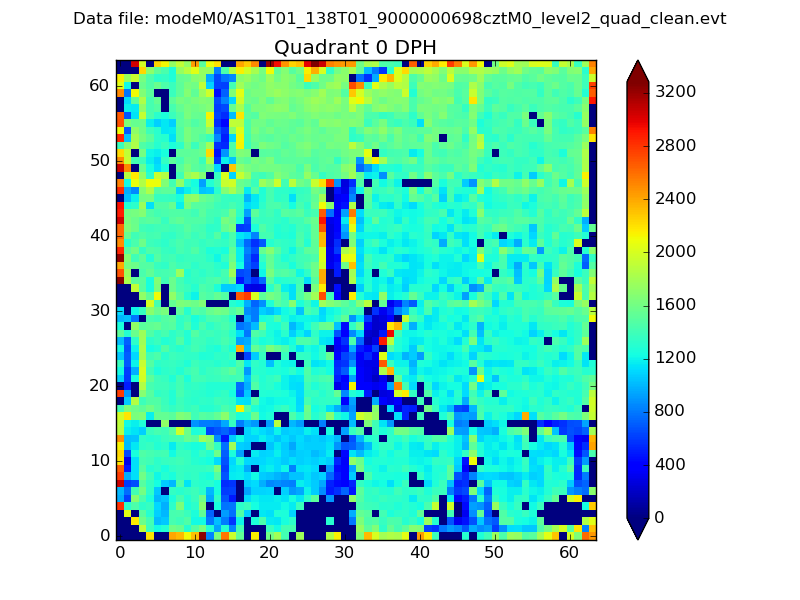 |
 |
Quadrant B |
|---|---|---|---|
| Quadrant D |  |
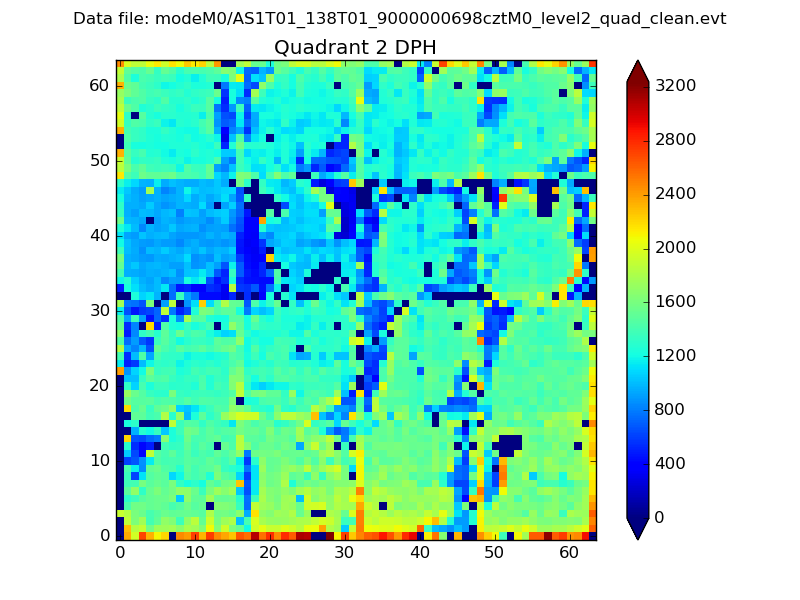 |
Quadrant C |
| Plot type | Count rate plots | Images |
|---|---|---|
| Comparison with Poisson distribution Blue bars denote a histogram of data divided into 1 sec bins. Red curve is a Poisson curve with rate = median count rate of data. |
 |
 |
| Quadrant-wise count rates Data is divided into 100 sec bins |
 |
|
| Module-wise count rates for Quadrant A Data is divided into 100 sec bins |
 |
 |
| Module-wise count rates for Quadrant B Data is divided into 100 sec bins |
 |
 |
| Module-wise count rates for Quadrant C Data is divided into 100 sec bins |
 |
 |
| Module-wise count rates for Quadrant D Data is divided into 100 sec bins |
 |
 |
| Parameter | Plot |
|---|---|
| CZT HV Monitor |  |
| D_VDD |  |
| Temperature 1 |  |
| Veto HV Monitor |  |
| Veto LLD |  |
| Alpha Counter |  |
| _CPM_Rate |  |
| CZT Counter |  |
| +2.5 Volts monitor |  |
| +5 Volts monitor |  |
| _ROLL_ROT |  |
| _Roll_DEC |  |
| _Roll_RA |  |
| Veto Counter |  |