| Param | Original file | Final file |
|---|---|---|
| Filename | modeM0/AS1T01_138T01_9000000698_05468cztM0_level2.evt | modeM0/AS1T01_138T01_9000000698_05468cztM0_level2_quad_clean.evt |
| Size (bytes) | 471,055,680 | 72,178,560 |
| Size | 449.2 MB | 68.8 MB |
| Events in quadrant A | 2,906,404 | 449,472 |
| Events in quadrant B | 3,449,911 | 446,089 |
| Events in quadrant C | 2,660,490 | 448,491 |
| Events in quadrant D | 4,834,148 | 414,582 |
| Mode M9 | |||
|---|---|---|---|
| Quadrant | BADHDUFLAG | Total packets | Discarded packets |
| A | 0 | 11 | 0 |
| B | 0 | 11 | 0 |
| C | 0 | 11 | 0 |
| D | 0 | 11 | 0 |
| Mode SS | |||
|---|---|---|---|
| Quadrant | BADHDUFLAG | Total packets | Discarded packets |
| A | 0 | 124 | 0 |
| B | 0 | 124 | 0 |
| C | 0 | 124 | 0 |
| D | 0 | 124 | 0 |
| Mode M0 | |||
|---|---|---|---|
| Quadrant | BADHDUFLAG | Total packets | Discarded packets |
| A | 0 | 13009 | 2 |
| B | 0 | 14228 | 1 |
| C | 0 | 12459 | 1 |
| D | 0 | 18388 | 1 |
| Quadrant | Total seconds | Saturated seconds | Saturation percentage |
|---|---|---|---|
| A | 6113 | 90 | 1.472272% |
| B | 6113 | 38 | 0.621626% |
| C | 6113 | 14 | 0.229020% |
| D | 6113 | 374 | 6.118109% |
Noise dominated data is calculated using 1-second bins in cleaned event files. If a bin has >2000 counts, and if more than 50% of those come from <1% of pixels, then it is considered to be noise-dominated and hence unusable.
| Quadrant | # 1 sec bins | Bins with >0 counts | Bins with >2000 counts | High rate bins dominated by noise | Noise dominated (total time) | Noise dominated (detector-on time) | Marked lightcurve |
|---|---|---|---|---|---|---|---|
| A | 7203 | 6114 | 31 | 31 | 0.43% | 0.51% | 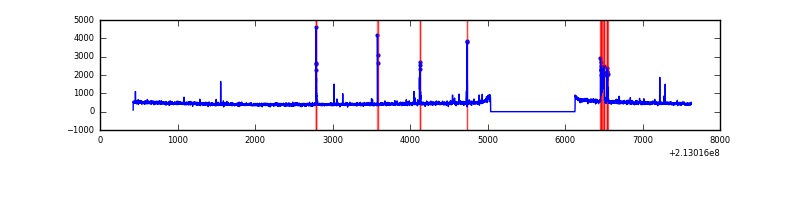 |
| B | 7203 | 6114 | 8 | 8 | 0.11% | 0.13% | 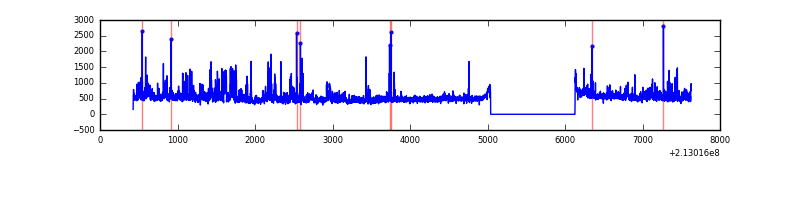 |
| C | 7203 | 6114 | 0 | 0 | 0.00% | 0.00% | 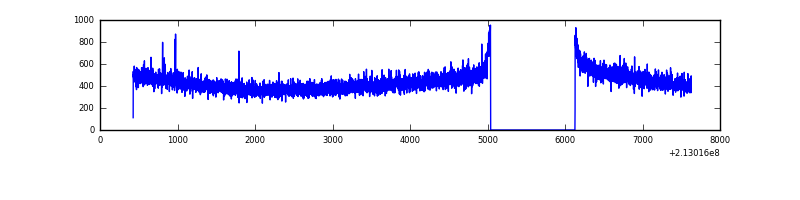 |
| D | 7203 | 6114 | 381 | 381 | 5.29% | 6.23% | 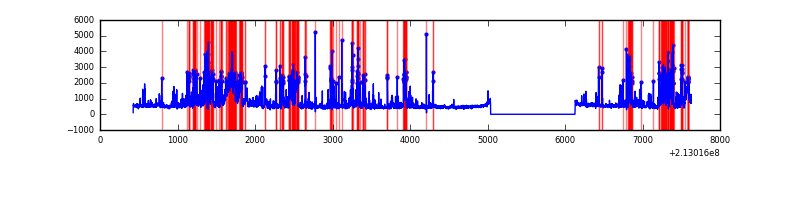 |
Top three noisy pixels from each quadrant. If the there are fewer than three noisy pixels in the level2.evt file, extra rows are filled as -1
| Pixel properties | Quadrant properties | ||||||
|---|---|---|---|---|---|---|---|
| Quadrant | DetID | PixID | Counts | Sigma | Mean | Median | Sigma |
| A | 0 | 50 | 134174 | 916.49 | 707 | 693 | 145.6 |
| A | 15 | 174 | 23187 | 154.45 | 707 | 693 | 145.6 |
| A | 14 | 111 | 22999 | 153.15 | 707 | 693 | 145.6 |
| B | 15 | 204 | 516991 | 3789.1 | 708 | 692 | 136.3 |
| B | 4 | 48 | 33939 | 244.0 | 708 | 692 | 136.3 |
| B | 0 | 219 | 33114 | 237.94 | 708 | 692 | 136.3 |
| C | 1 | 16 | 7999 | 46.54 | 678 | 683 | 157.2 |
| C | 9 | 54 | 6299 | 35.72 | 678 | 683 | 157.2 |
| C | 13 | 61 | 5567 | 31.07 | 678 | 683 | 157.2 |
| D | 2 | 33 | 1561067 | 9355.09 | 672 | 652 | 166.8 |
| D | 10 | 246 | 246278 | 1472.59 | 672 | 652 | 166.8 |
| D | 8 | 195 | 110885 | 660.88 | 672 | 652 | 166.8 |
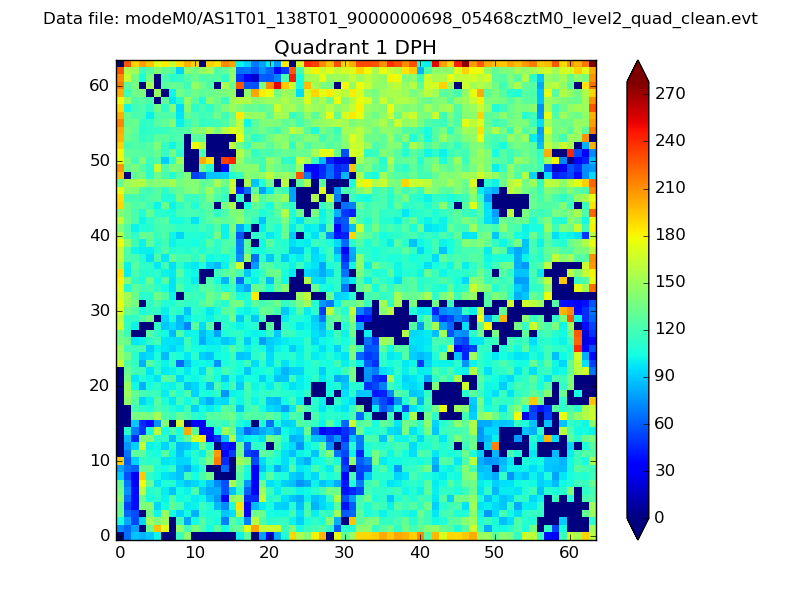
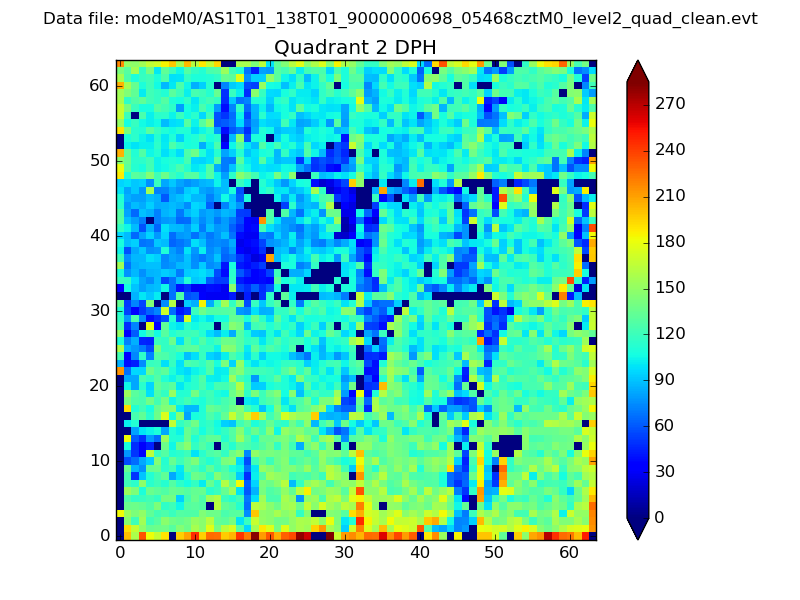
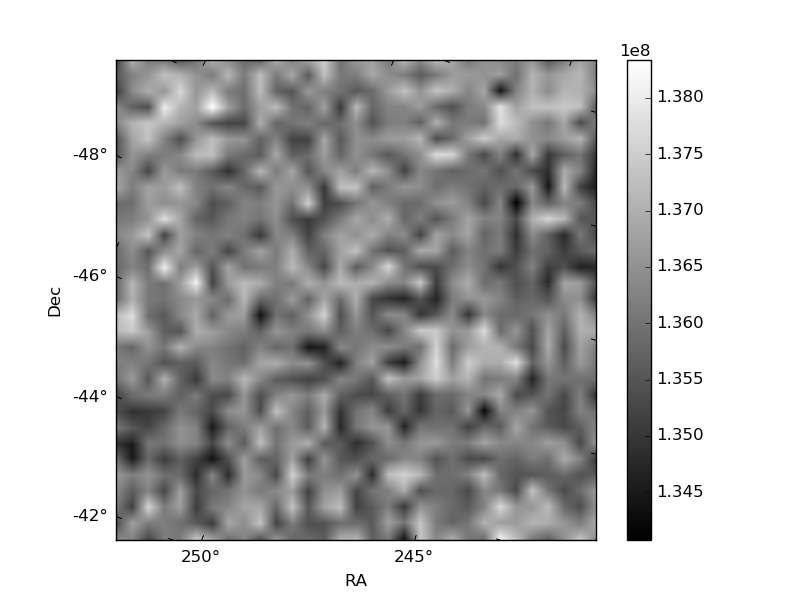
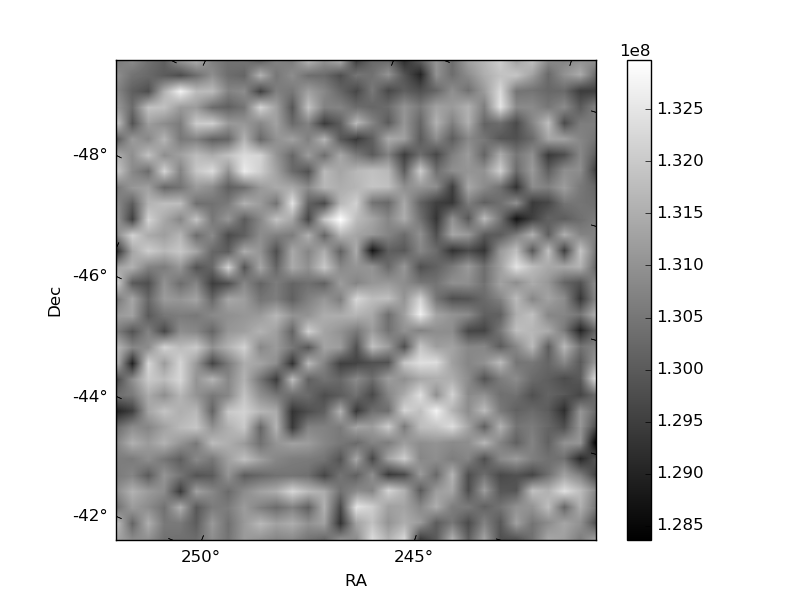
Histogram calculated using DETX and DETY for each event in the final _common_clean file
| Quadrant A |  |
 |
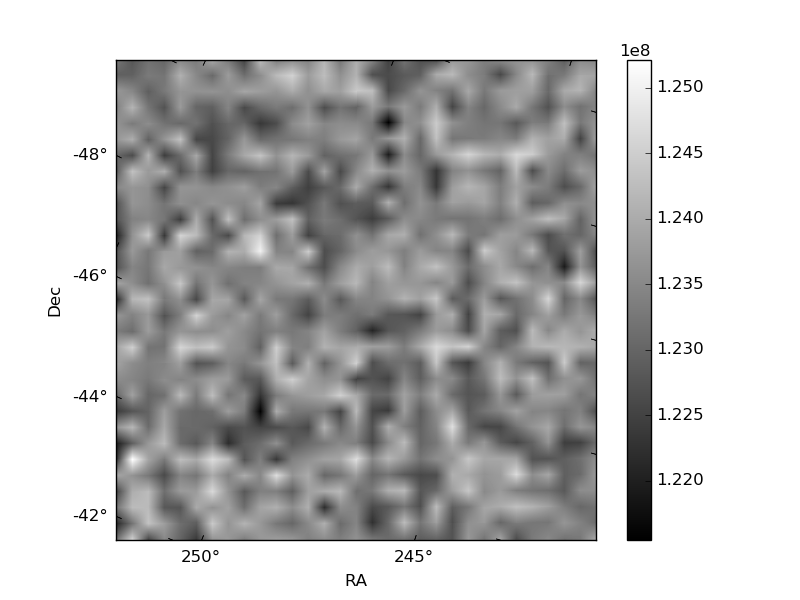
Quadrant B |
|---|---|---|---|
| Quadrant D |  |
 |
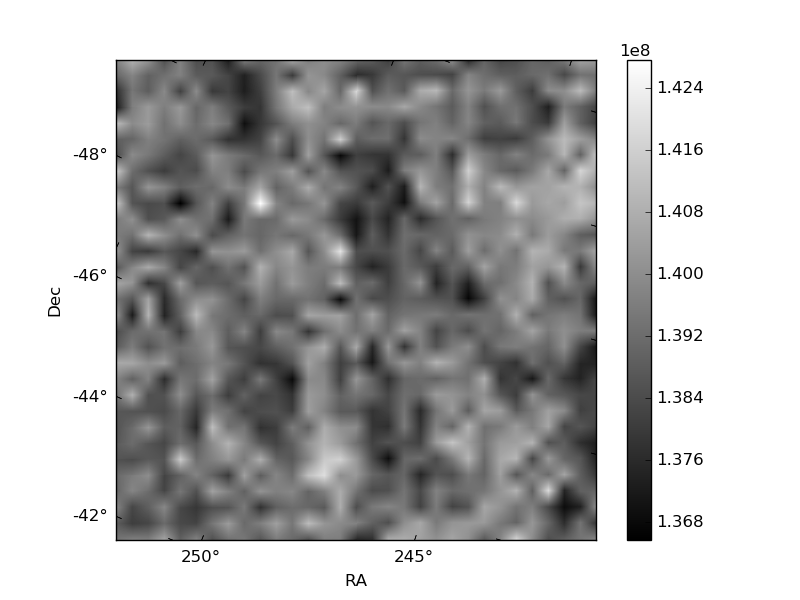
Quadrant C |
| Plot type | Count rate plots | Images |
|---|---|---|
| Comparison with Poisson distribution Blue bars denote a histogram of data divided into 1 sec bins. Red curve is a Poisson curve with rate = median count rate of data. |
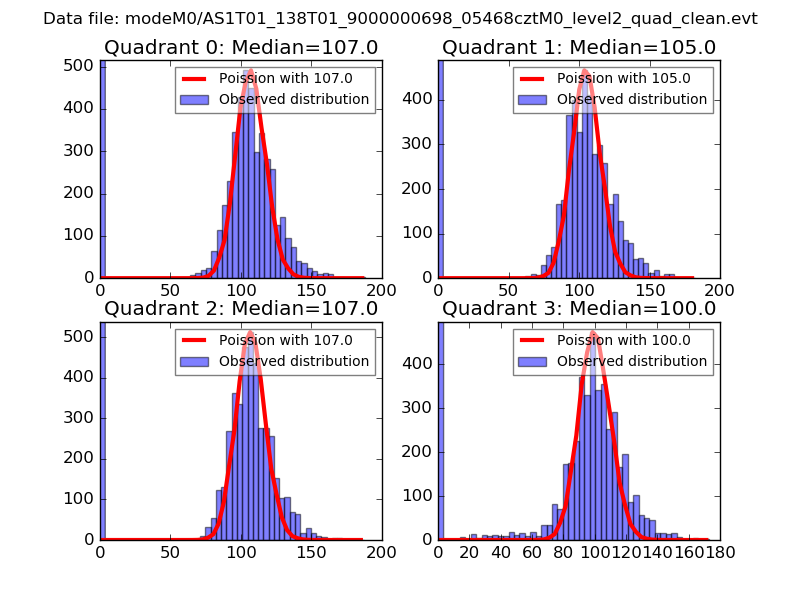 |
 |
| Quadrant-wise count rates Data is divided into 100 sec bins |
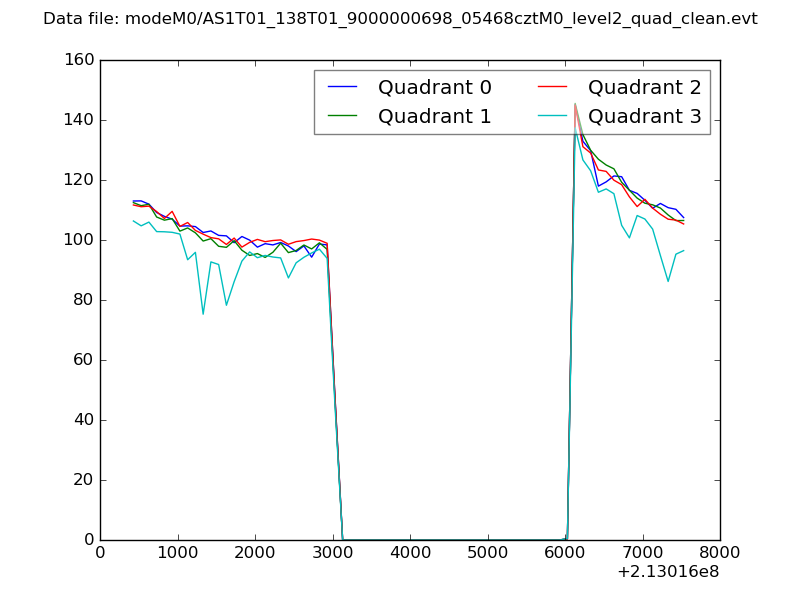 |
|
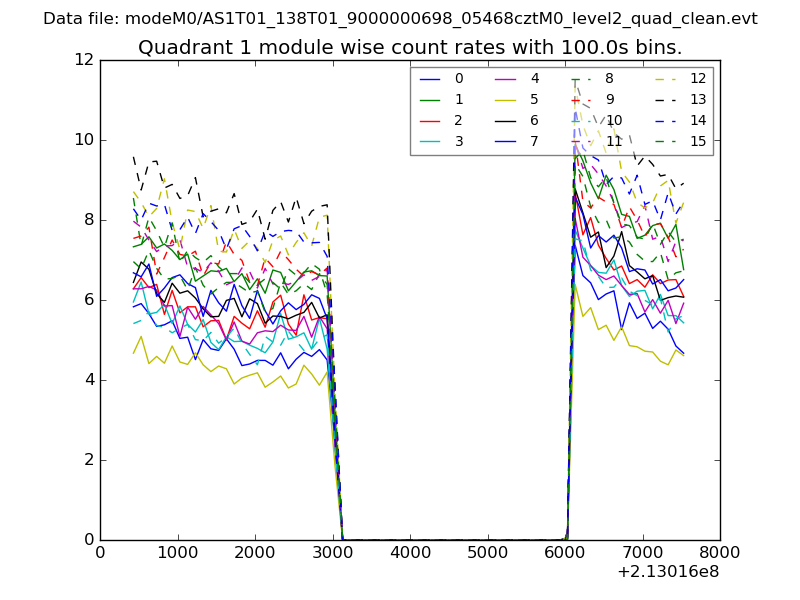
| Module-wise count rates for Quadrant A Data is divided into 100 sec bins |
 |
 |
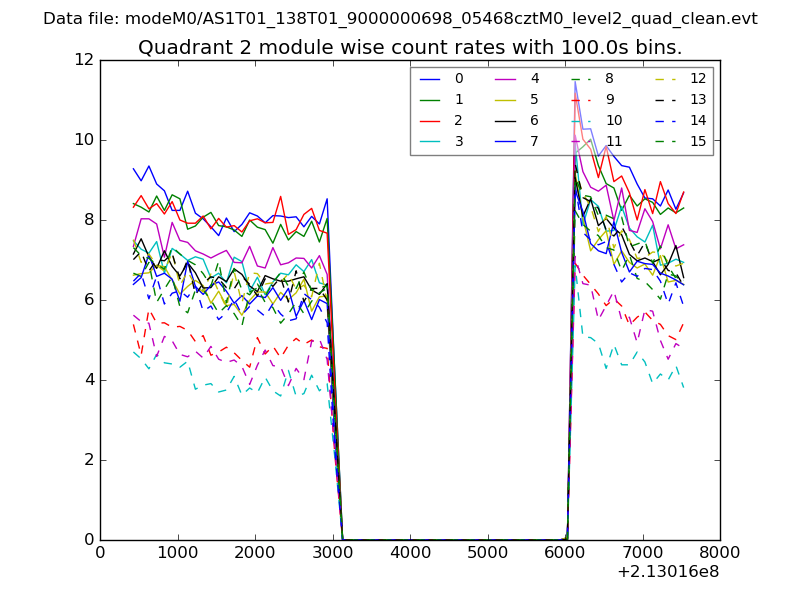
| Module-wise count rates for Quadrant B Data is divided into 100 sec bins |
 |
 |
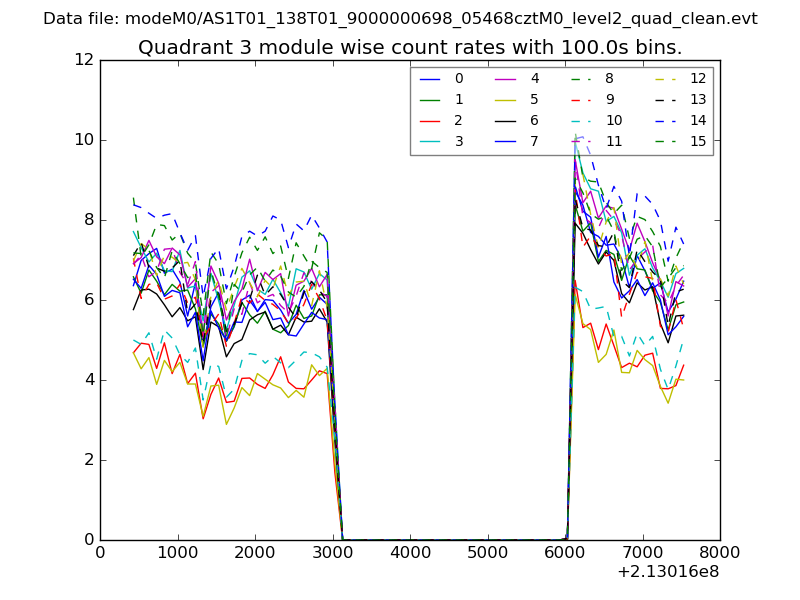
| Module-wise count rates for Quadrant C Data is divided into 100 sec bins |
 |
 |
| Module-wise count rates for Quadrant D Data is divided into 100 sec bins |
 |
 |
| Parameter | Plot |
|---|---|
| CZT HV Monitor | 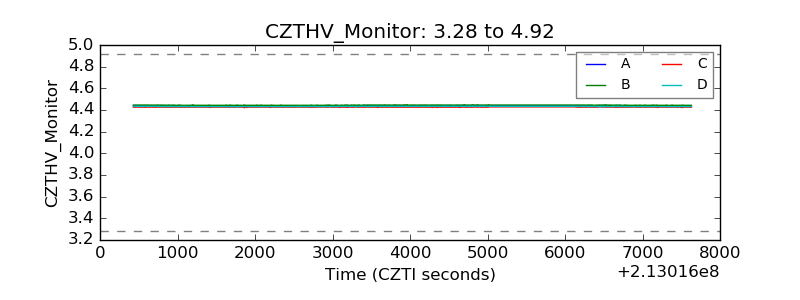 |
| D_VDD | 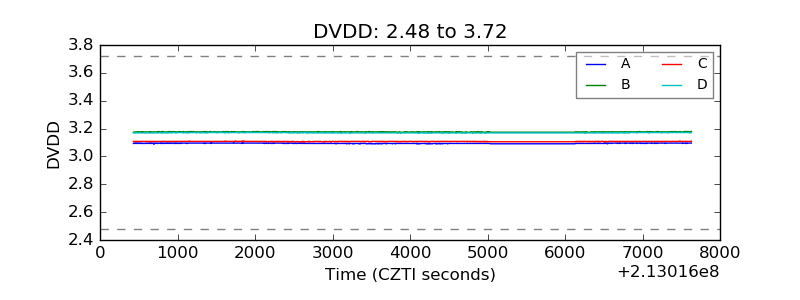 |
| Temperature 1 | 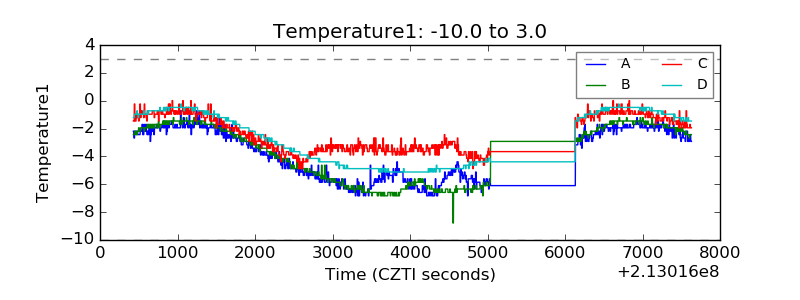 |
| Veto HV Monitor | 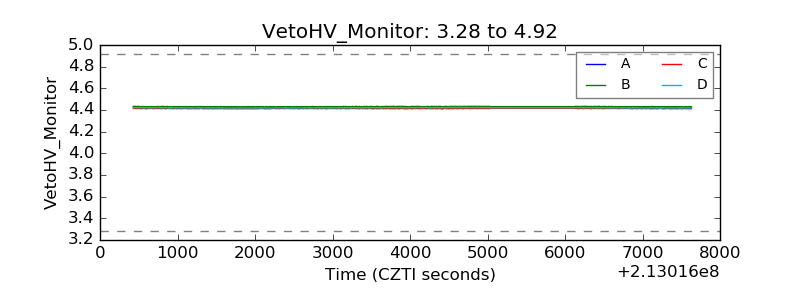 |
| Veto LLD |  |
| Alpha Counter | 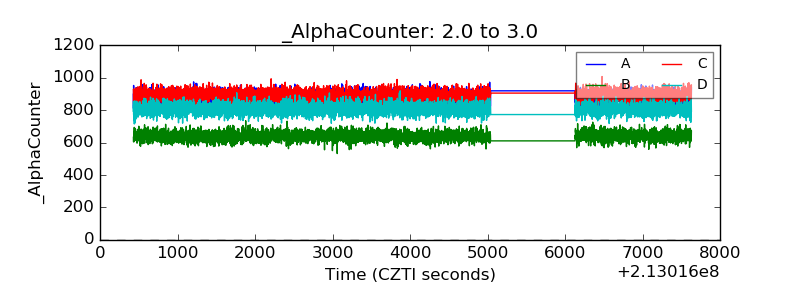 |
| _CPM_Rate | 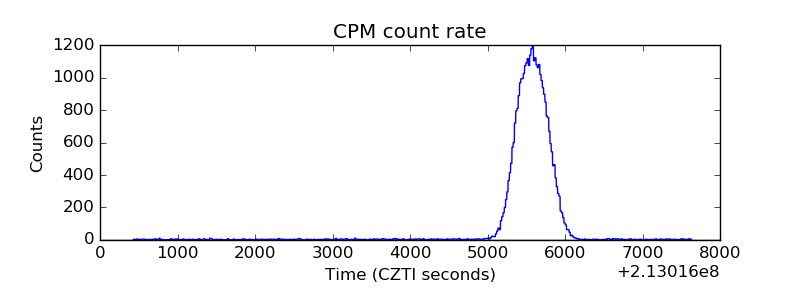 |
| CZT Counter | 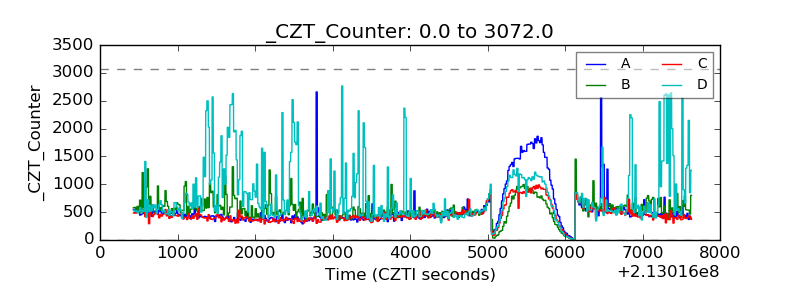 |
| +2.5 Volts monitor | 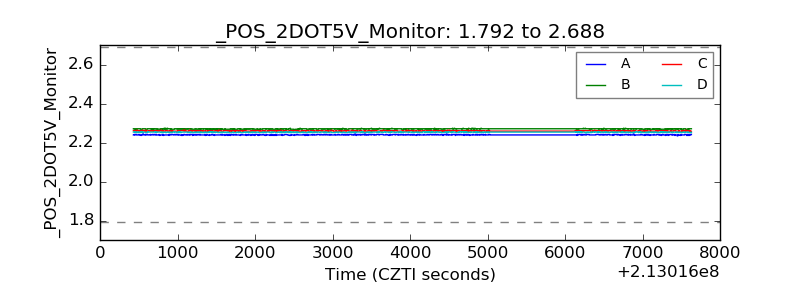 |
| +5 Volts monitor |  |
| _ROLL_ROT | 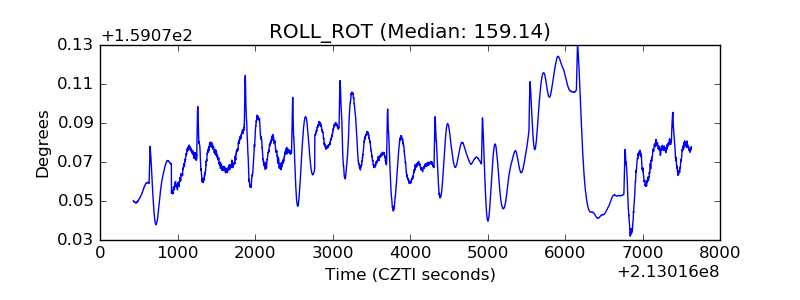 |
| _Roll_DEC | 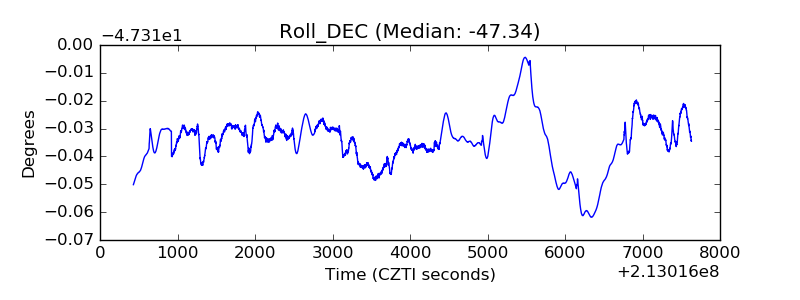 |
| _Roll_RA | 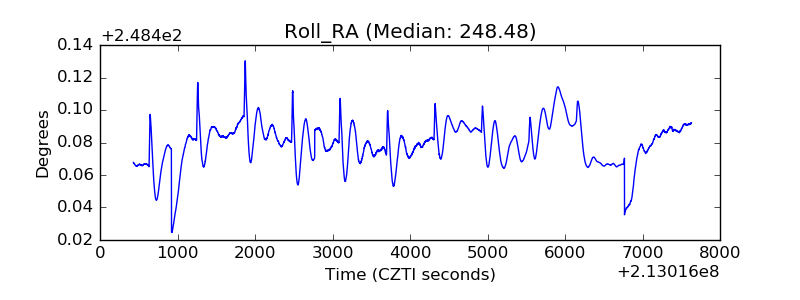 |
| Veto Counter | 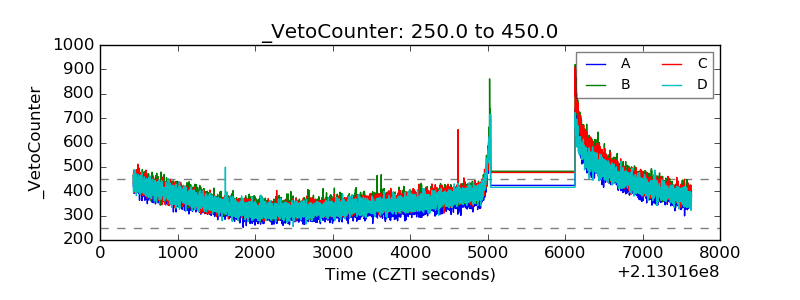 |