| Param | Original file | Final file |
|---|---|---|
| Filename | modeM0/AS1T01_138T01_9000000698_05469cztM0_level2.evt | modeM0/AS1T01_138T01_9000000698_05469cztM0_level2_quad_clean.evt |
| Size (bytes) | 472,590,720 | 79,655,040 |
| Size | 450.7 MB | 76.0 MB |
| Events in quadrant A | 3,170,326 | 500,762 |
| Events in quadrant B | 3,505,980 | 503,026 |
| Events in quadrant C | 2,875,519 | 497,218 |
| Events in quadrant D | 4,327,271 | 465,653 |
| Mode M9 | |||
|---|---|---|---|
| Quadrant | BADHDUFLAG | Total packets | Discarded packets |
| A | 0 | 12 | 0 |
| B | 0 | 12 | 0 |
| C | 0 | 12 | 0 |
| D | 0 | 12 | 0 |
| Mode SS | |||
|---|---|---|---|
| Quadrant | BADHDUFLAG | Total packets | Discarded packets |
| A | 0 | 130 | 0 |
| B | 0 | 130 | 0 |
| C | 0 | 130 | 0 |
| D | 0 | 130 | 0 |
| Mode M0 | |||
|---|---|---|---|
| Quadrant | BADHDUFLAG | Total packets | Discarded packets |
| A | 0 | 13831 | 3 |
| B | 0 | 14615 | 2 |
| C | 0 | 13134 | 2 |
| D | 0 | 17130 | 2 |
| Quadrant | Total seconds | Saturated seconds | Saturation percentage |
|---|---|---|---|
| A | 6381 | 92 | 1.441780% |
| B | 6381 | 26 | 0.407460% |
| C | 6381 | 18 | 0.282087% |
| D | 6381 | 211 | 3.306692% |
Noise dominated data is calculated using 1-second bins in cleaned event files. If a bin has >2000 counts, and if more than 50% of those come from <1% of pixels, then it is considered to be noise-dominated and hence unusable.
| Quadrant | # 1 sec bins | Bins with >0 counts | Bins with >2000 counts | High rate bins dominated by noise | Noise dominated (total time) | Noise dominated (detector-on time) | Marked lightcurve |
|---|---|---|---|---|---|---|---|
| A | 7571 | 6382 | 27 | 27 | 0.36% | 0.42% | 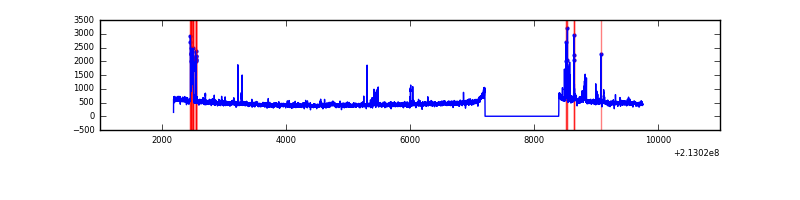 |
| B | 7571 | 6382 | 2 | 2 | 0.03% | 0.03% | 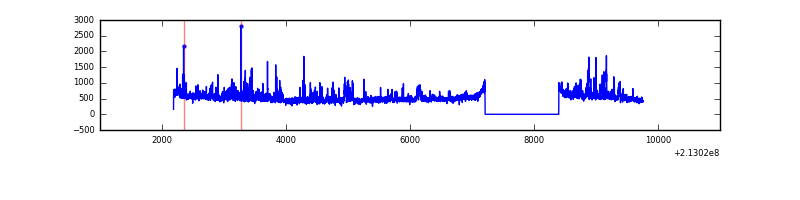 |
| C | 7571 | 6382 | 0 | 0 | 0.00% | 0.00% | 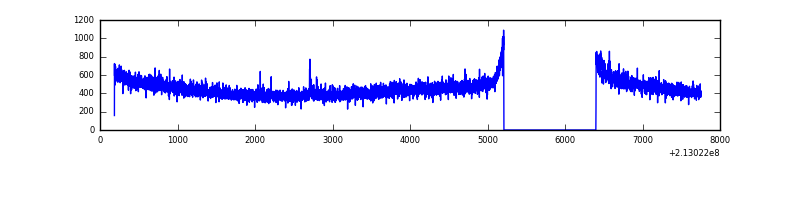 |
| D | 7571 | 6382 | 179 | 179 | 2.36% | 2.80% | 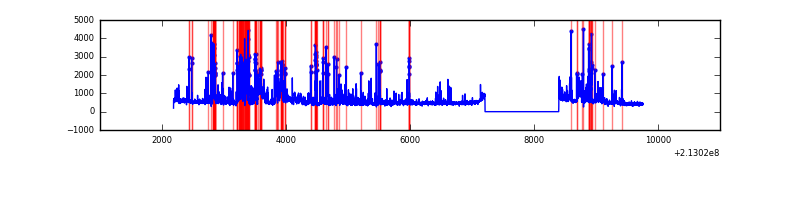 |
Top three noisy pixels from each quadrant. If the there are fewer than three noisy pixels in the level2.evt file, extra rows are filled as -1
| Pixel properties | Quadrant properties | ||||||
|---|---|---|---|---|---|---|---|
| Quadrant | DetID | PixID | Counts | Sigma | Mean | Median | Sigma |
| A | 0 | 50 | 149356 | 954.13 | 762 | 747 | 155.8 |
| A | 14 | 111 | 44435 | 280.49 | 762 | 747 | 155.8 |
| A | 0 | 247 | 26338 | 164.3 | 762 | 747 | 155.8 |
| B | 15 | 204 | 422476 | 2880.85 | 765 | 748 | 146.4 |
| B | 11 | 51 | 25042 | 165.95 | 765 | 748 | 146.4 |
| B | 0 | 199 | 15547 | 101.09 | 765 | 748 | 146.4 |
| C | 1 | 16 | 24354 | 140.41 | 728 | 734 | 168.2 |
| C | 9 | 247 | 7419 | 39.74 | 728 | 734 | 168.2 |
| C | 13 | 61 | 5996 | 31.28 | 728 | 734 | 168.2 |
| D | 2 | 33 | 1166329 | 6579.67 | 723 | 701 | 177.2 |
| D | 8 | 195 | 91663 | 513.46 | 723 | 701 | 177.2 |
| D | 2 | 136 | 81530 | 456.26 | 723 | 701 | 177.2 |
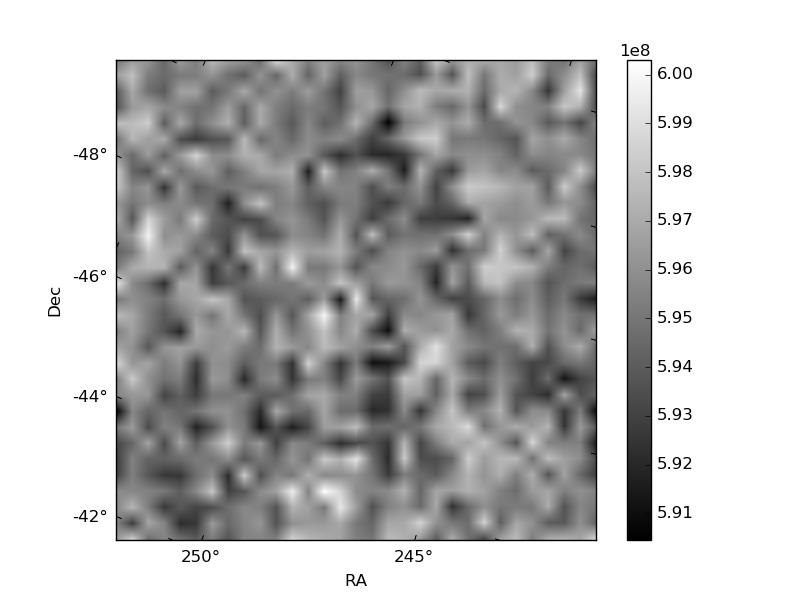
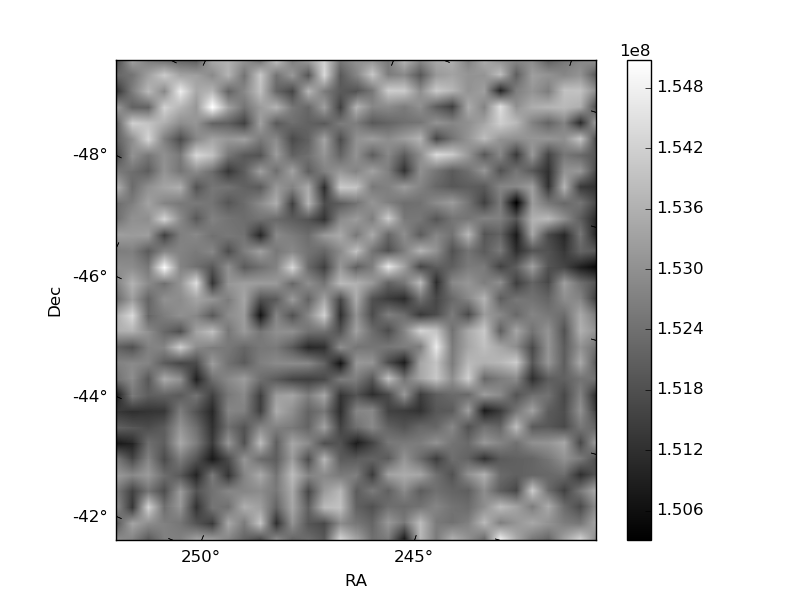
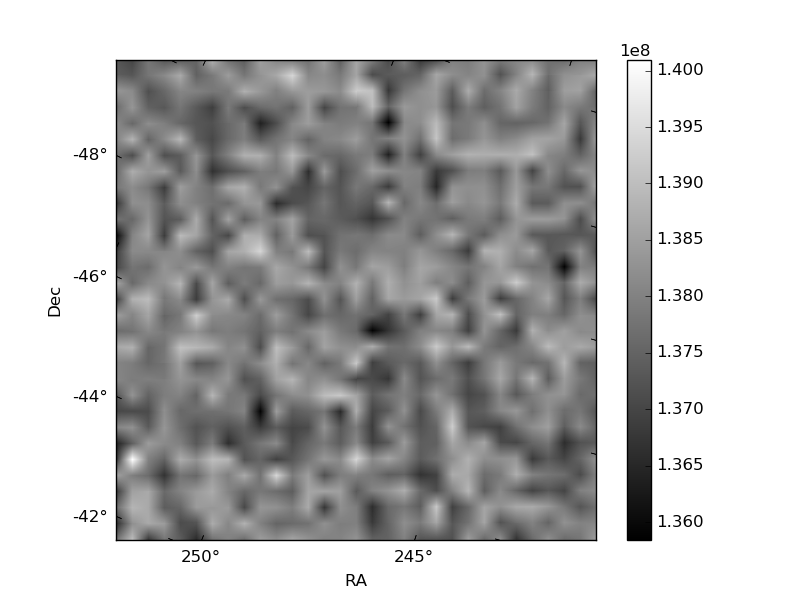
Histogram calculated using DETX and DETY for each event in the final _common_clean file
| Quadrant A | 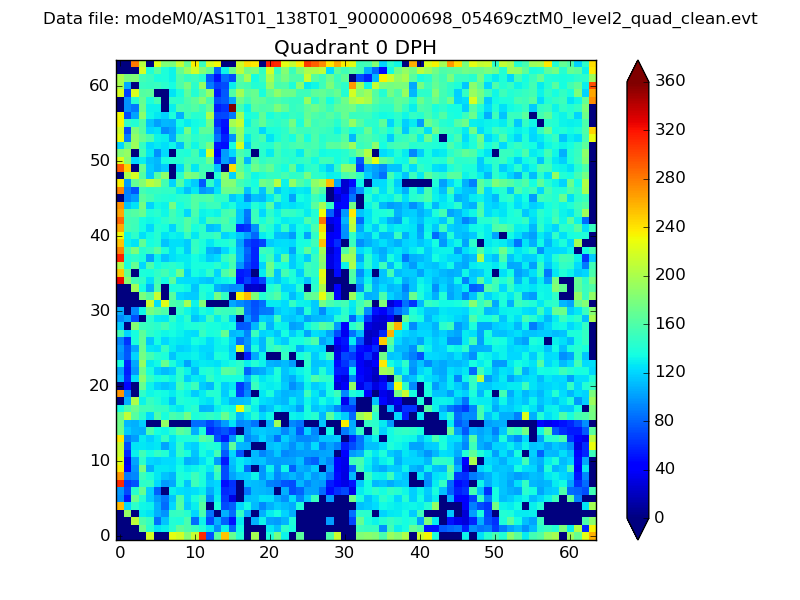 |
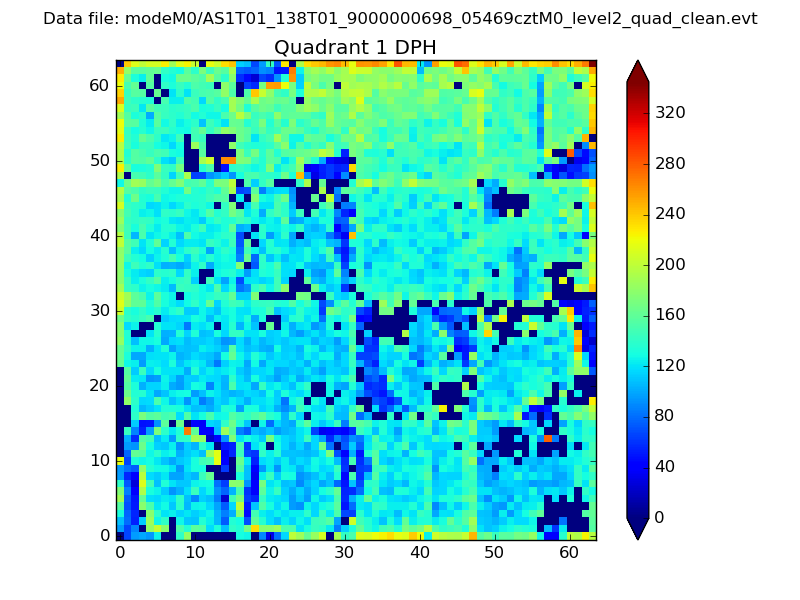 |
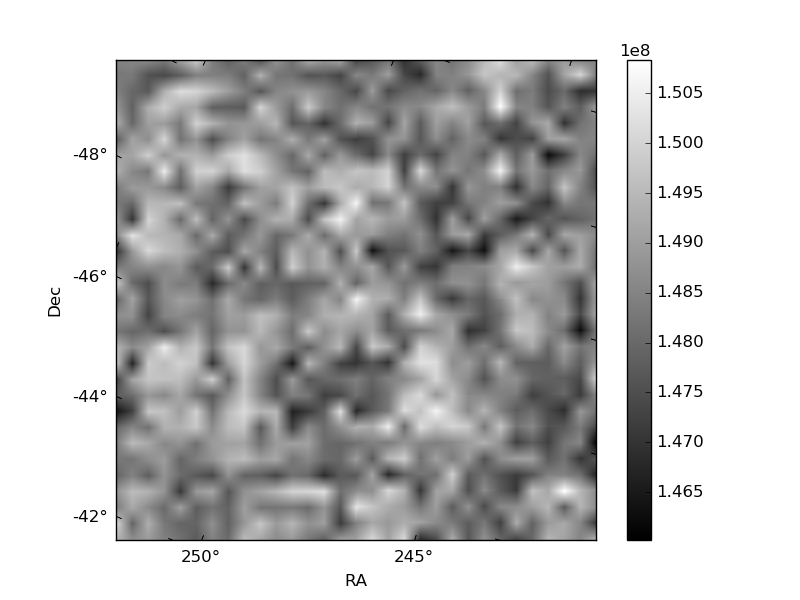
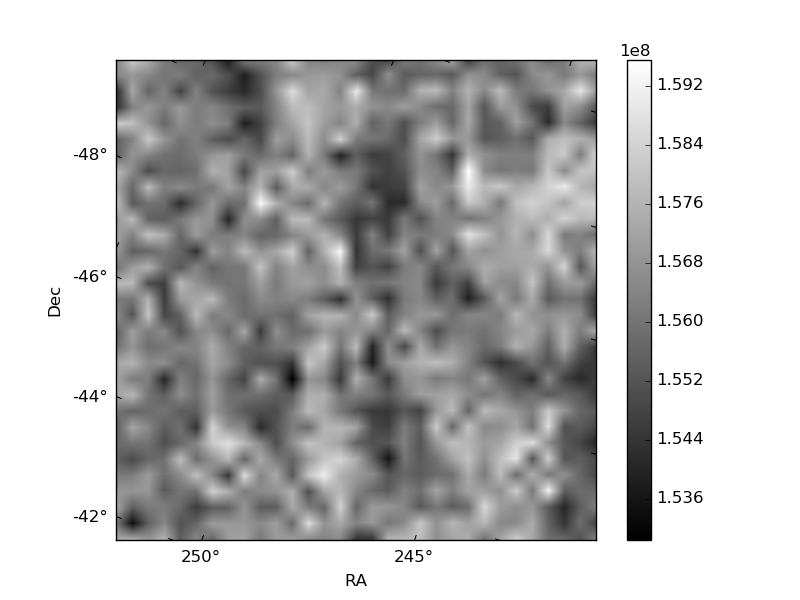
Quadrant B |
|---|---|---|---|
| Quadrant D | 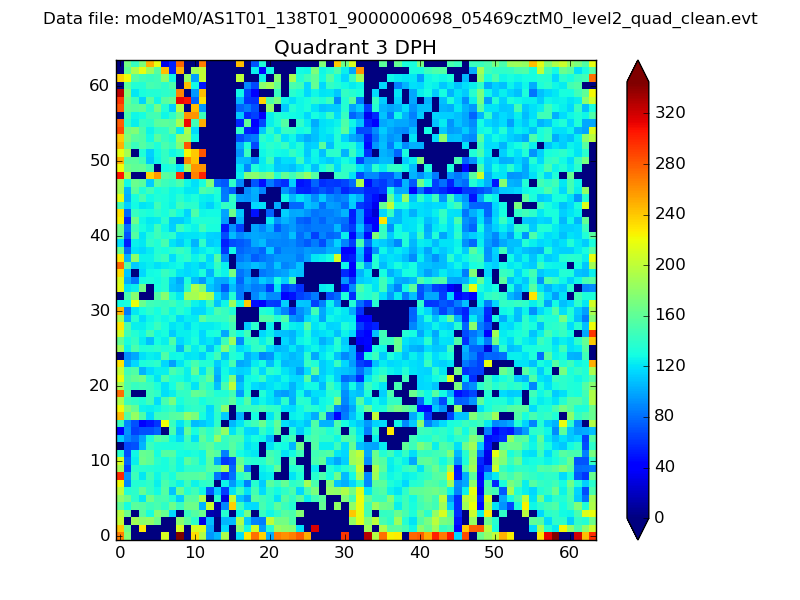 |
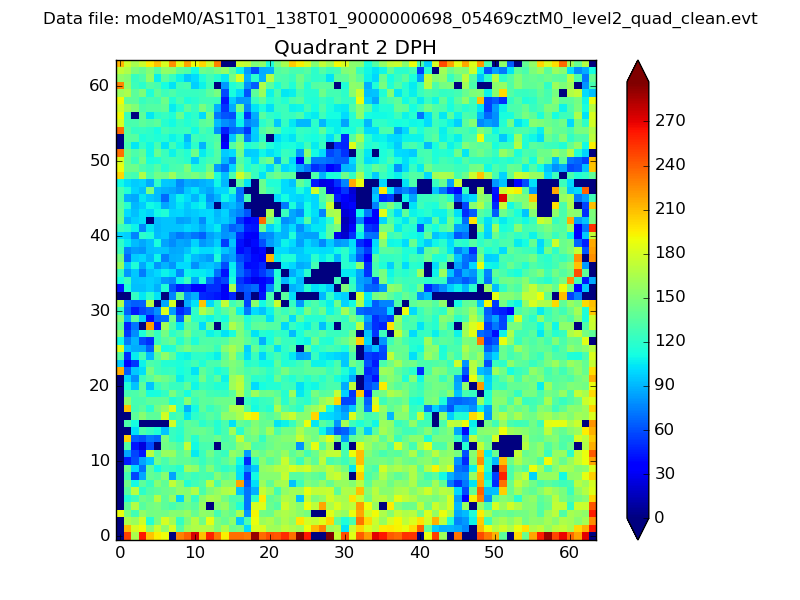 |
Quadrant C |
| Plot type | Count rate plots | Images |
|---|---|---|
| Comparison with Poisson distribution Blue bars denote a histogram of data divided into 1 sec bins. Red curve is a Poisson curve with rate = median count rate of data. |
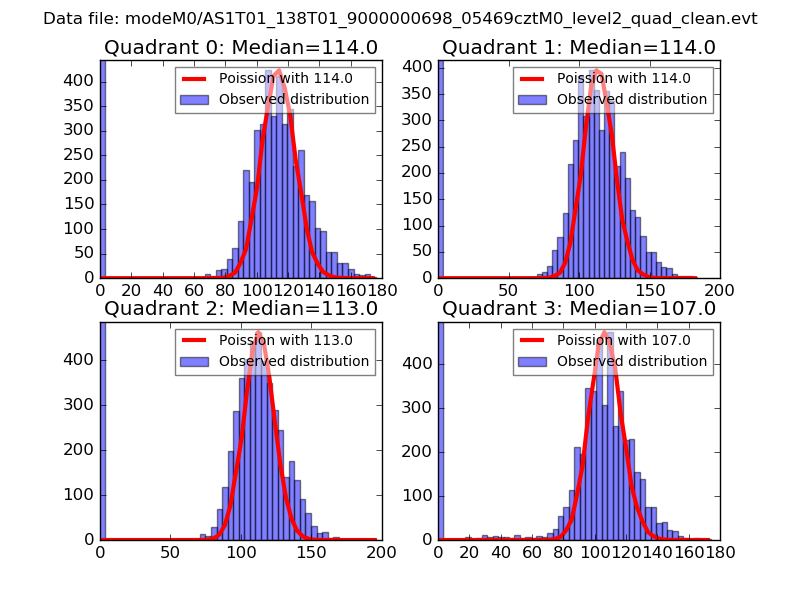 |
 |
| Quadrant-wise count rates Data is divided into 100 sec bins |
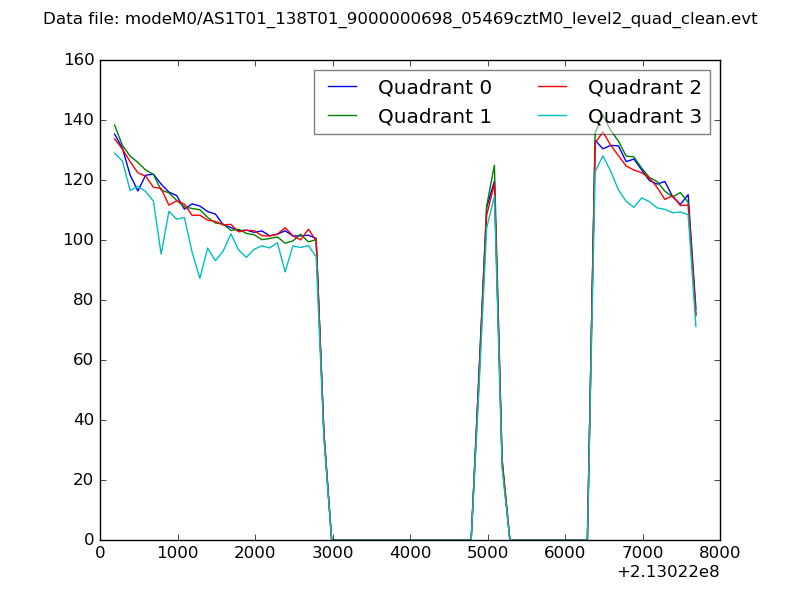 |
|
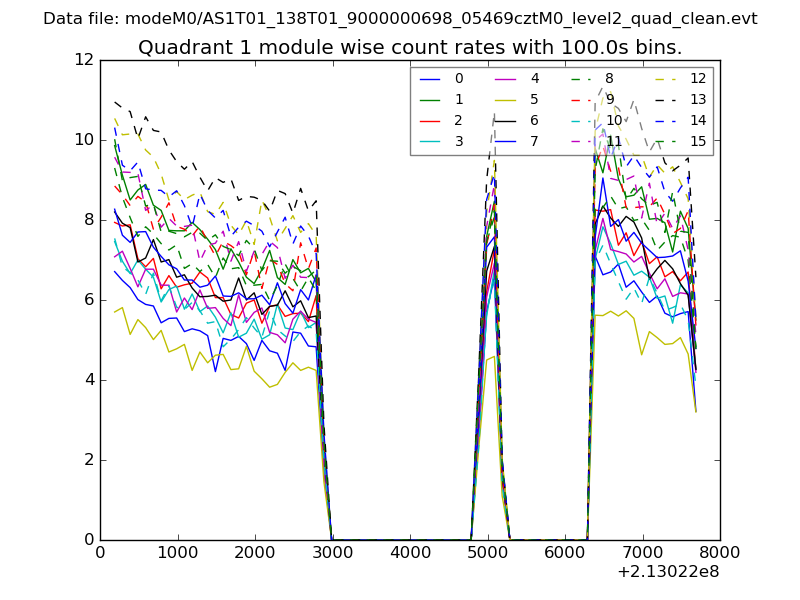
| Module-wise count rates for Quadrant A Data is divided into 100 sec bins |
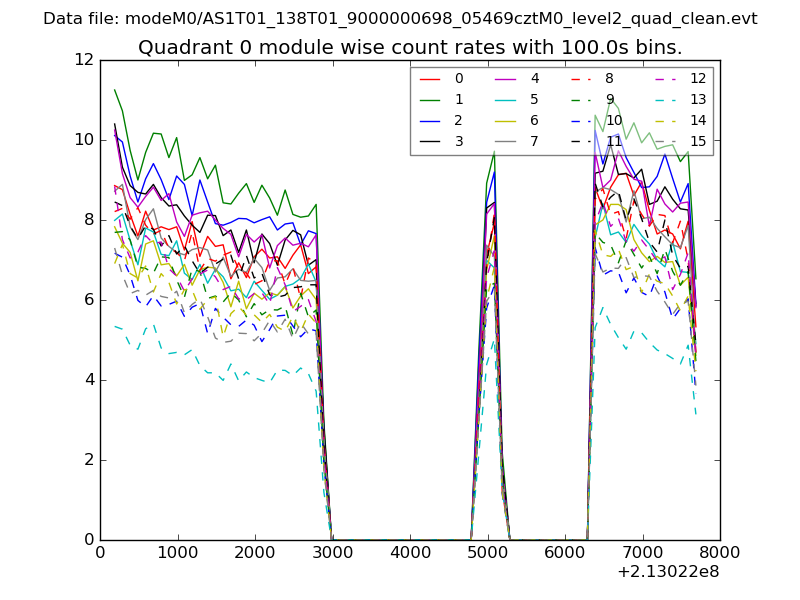 |
 |
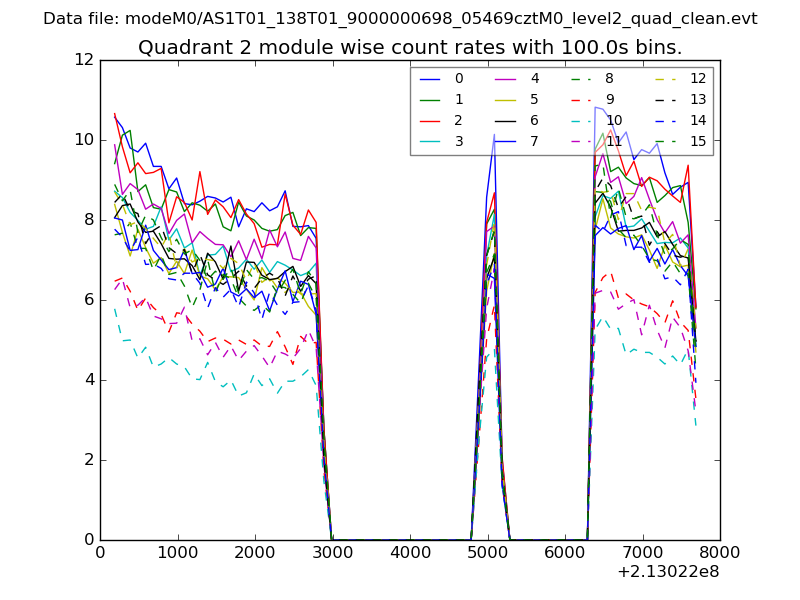
| Module-wise count rates for Quadrant B Data is divided into 100 sec bins |
 |
 |
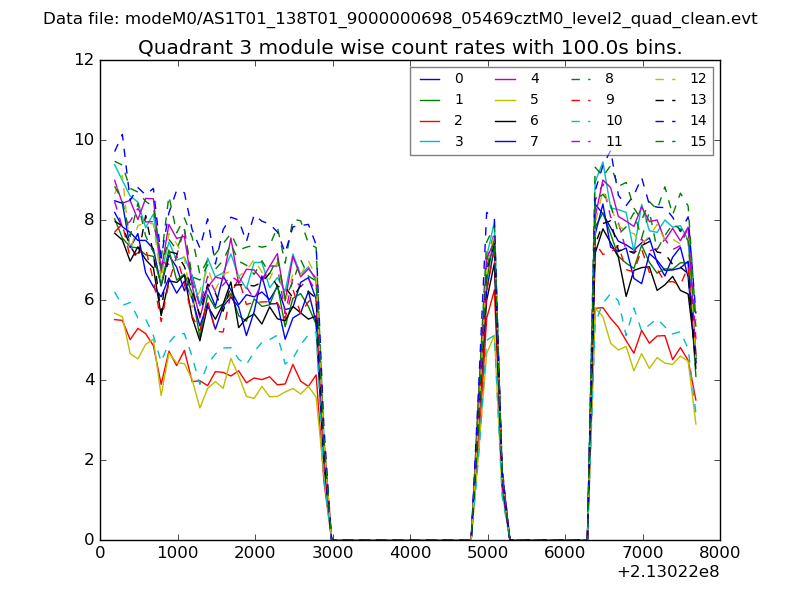
| Module-wise count rates for Quadrant C Data is divided into 100 sec bins |
 |
 |
| Module-wise count rates for Quadrant D Data is divided into 100 sec bins |
 |
 |
| Parameter | Plot |
|---|---|
| CZT HV Monitor | 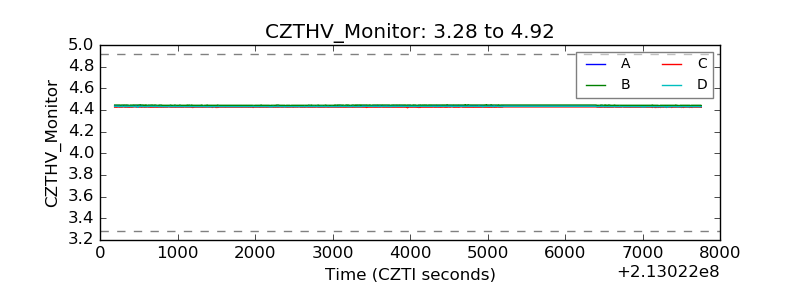 |
| D_VDD | 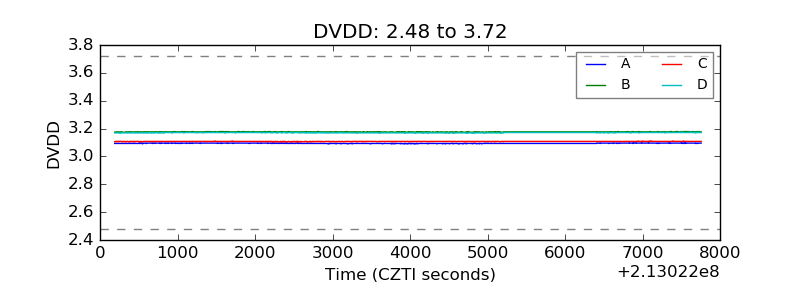 |
| Temperature 1 | 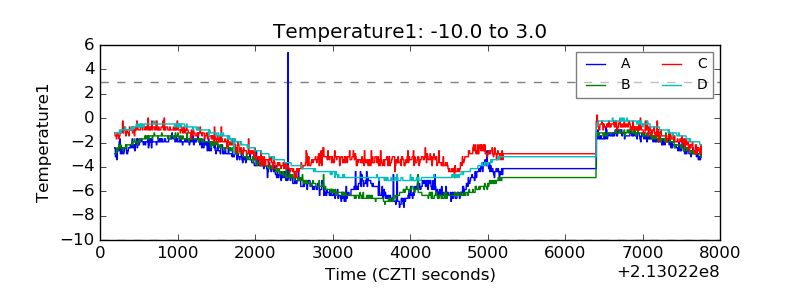 |
| Veto HV Monitor | 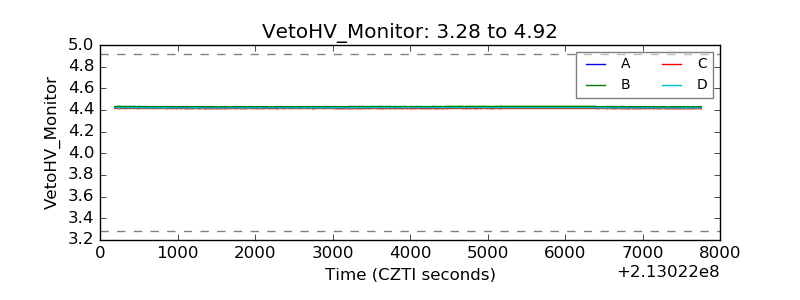 |
| Veto LLD |  |
| Alpha Counter | 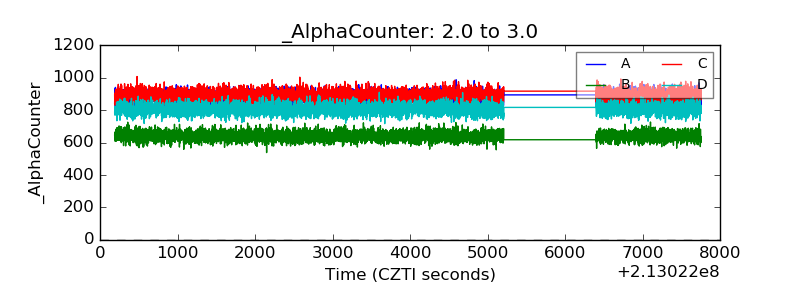 |
| _CPM_Rate | 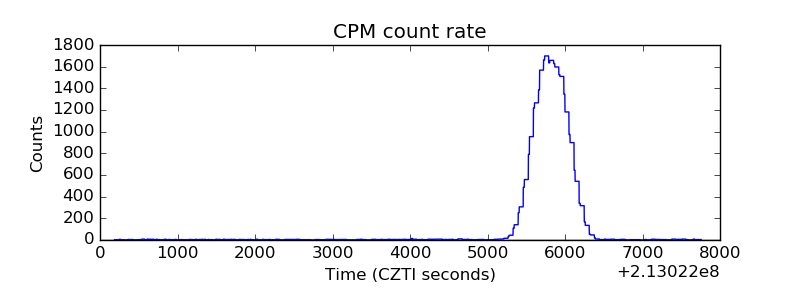 |
| CZT Counter | 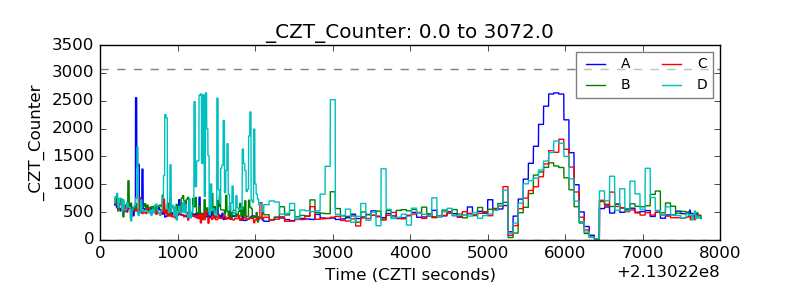 |
| +2.5 Volts monitor |  |
| +5 Volts monitor |  |
| _ROLL_ROT |  |
| _Roll_DEC | 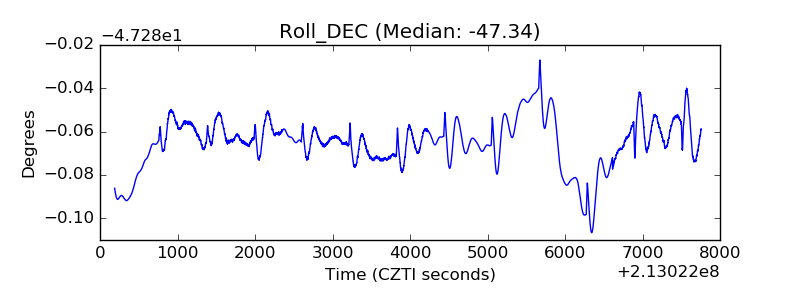 |
| _Roll_RA | 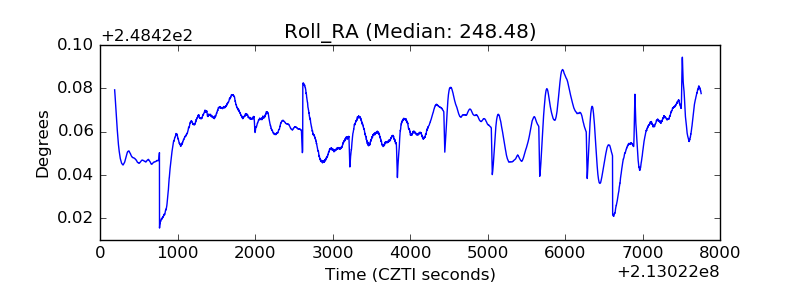 |
| Veto Counter | 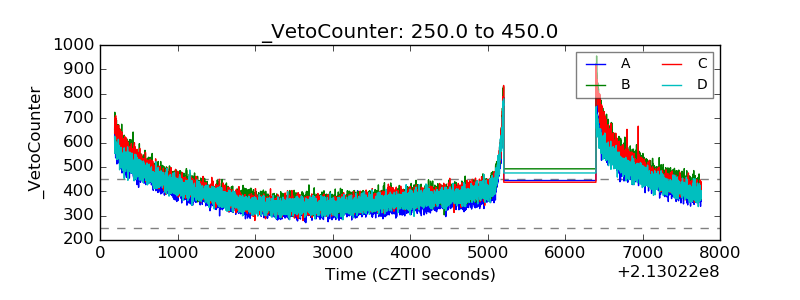 |