| Param | Original file | Final file |
|---|---|---|
| Filename | modeM0/AS1T01_138T01_9000000698_05470cztM0_level2.evt | modeM0/AS1T01_138T01_9000000698_05470cztM0_level2_quad_clean.evt |
| Size (bytes) | 455,843,520 | 80,300,160 |
| Size | 434.7 MB | 76.6 MB |
| Events in quadrant A | 3,167,840 | 506,296 |
| Events in quadrant B | 3,543,938 | 509,895 |
| Events in quadrant C | 2,907,588 | 501,710 |
| Events in quadrant D | 3,757,904 | 474,093 |
| Mode M9 | |||
|---|---|---|---|
| Quadrant | BADHDUFLAG | Total packets | Discarded packets |
| A | 0 | 19 | 0 |
| B | 0 | 19 | 0 |
| C | 0 | 19 | 0 |
| D | 0 | 20 | 0 |
| Mode SS | |||
|---|---|---|---|
| Quadrant | BADHDUFLAG | Total packets | Discarded packets |
| A | 0 | 126 | 0 |
| B | 0 | 126 | 0 |
| C | 0 | 126 | 0 |
| D | 0 | 126 | 0 |
| Mode M0 | |||
|---|---|---|---|
| Quadrant | BADHDUFLAG | Total packets | Discarded packets |
| A | 0 | 13709 | 3 |
| B | 0 | 14687 | 2 |
| C | 0 | 13072 | 2 |
| D | 0 | 15589 | 2 |
| Quadrant | Total seconds | Saturated seconds | Saturation percentage |
|---|---|---|---|
| A | 6307 | 81 | 1.284287% |
| B | 6307 | 44 | 0.697638% |
| C | 6307 | 14 | 0.221976% |
| D | 6307 | 160 | 2.536864% |
Noise dominated data is calculated using 1-second bins in cleaned event files. If a bin has >2000 counts, and if more than 50% of those come from <1% of pixels, then it is considered to be noise-dominated and hence unusable.
| Quadrant | # 1 sec bins | Bins with >0 counts | Bins with >2000 counts | High rate bins dominated by noise | Noise dominated (total time) | Noise dominated (detector-on time) | Marked lightcurve |
|---|---|---|---|---|---|---|---|
| A | 7582 | 6308 | 10 | 10 | 0.13% | 0.16% | 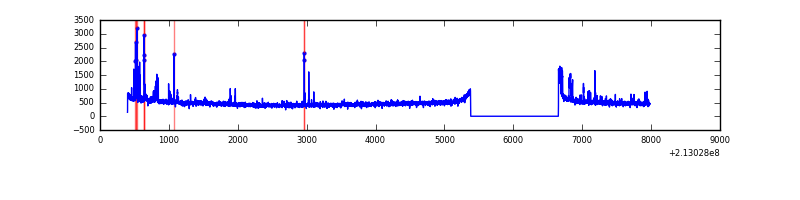 |
| B | 7582 | 6308 | 2 | 2 | 0.03% | 0.03% | 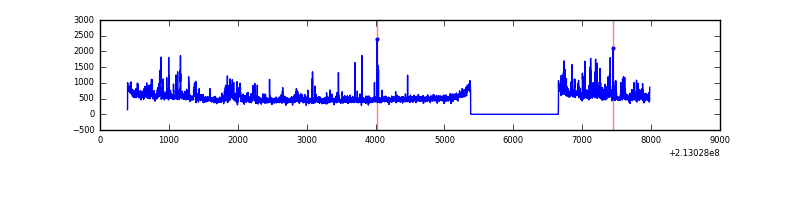 |
| C | 7582 | 6308 | 1 | 1 | 0.01% | 0.02% | 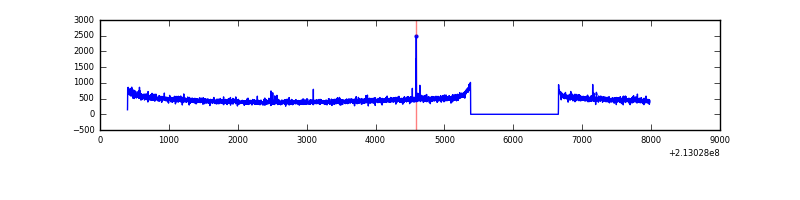 |
| D | 7582 | 6308 | 123 | 123 | 1.62% | 1.95% | 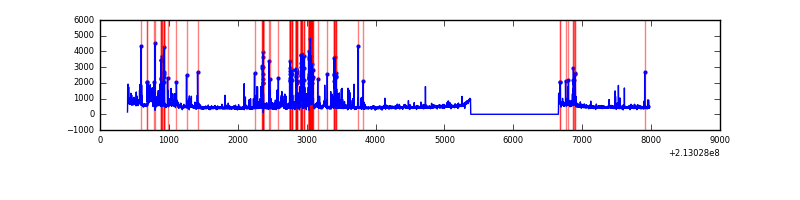 |
Top three noisy pixels from each quadrant. If the there are fewer than three noisy pixels in the level2.evt file, extra rows are filled as -1
| Pixel properties | Quadrant properties | ||||||
|---|---|---|---|---|---|---|---|
| Quadrant | DetID | PixID | Counts | Sigma | Mean | Median | Sigma |
| A | 0 | 247 | 97469 | 624.0 | 760 | 747 | 155.0 |
| A | 0 | 50 | 60307 | 384.25 | 760 | 747 | 155.0 |
| A | 14 | 111 | 42463 | 269.13 | 760 | 747 | 155.0 |
| B | 15 | 204 | 369533 | 2516.69 | 769 | 752 | 146.5 |
| B | 10 | 16 | 45662 | 306.48 | 769 | 752 | 146.5 |
| B | 14 | 167 | 38295 | 256.21 | 769 | 752 | 146.5 |
| C | 1 | 16 | 27605 | 161.88 | 727 | 730 | 166.0 |
| C | 9 | 247 | 23657 | 138.1 | 727 | 730 | 166.0 |
| C | 14 | 67 | 9970 | 55.66 | 727 | 730 | 166.0 |
| D | 2 | 33 | 654432 | 3666.77 | 722 | 701 | 178.3 |
| D | 2 | 152 | 135801 | 757.77 | 722 | 701 | 178.3 |
| D | 11 | 192 | 74956 | 416.5 | 722 | 701 | 178.3 |
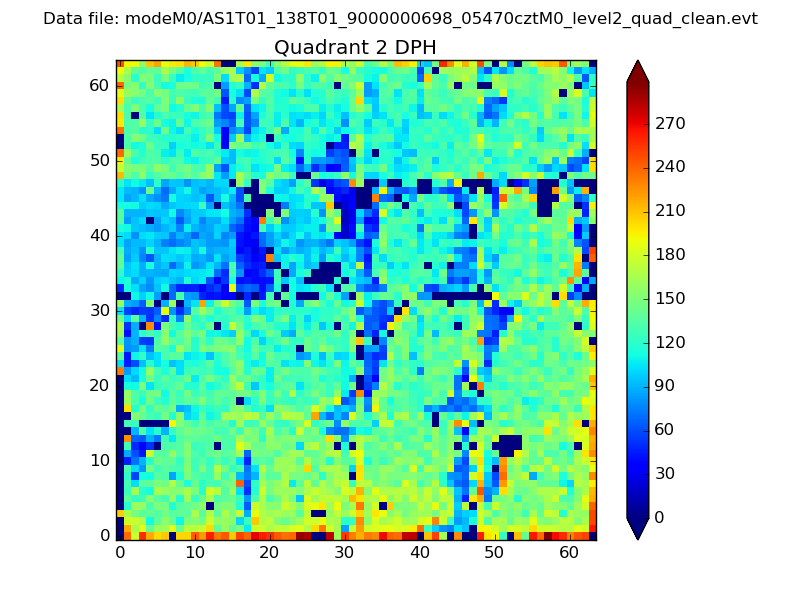
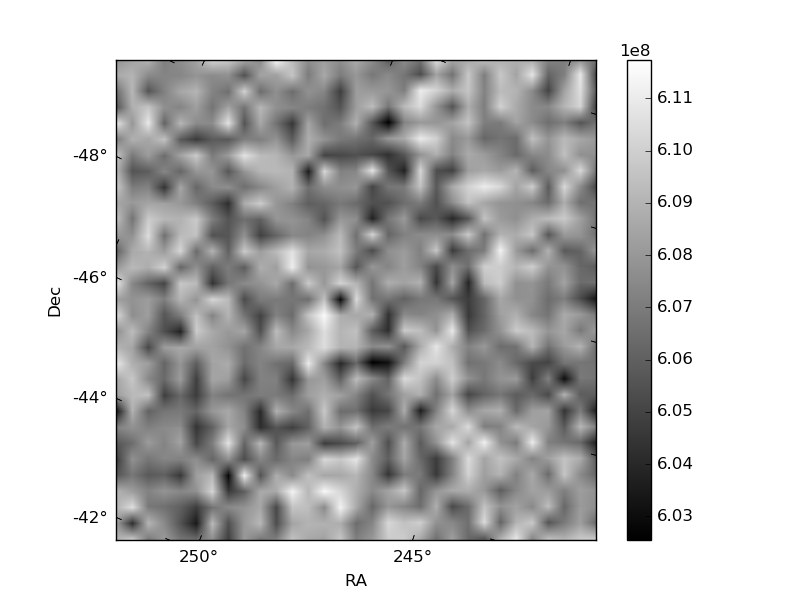
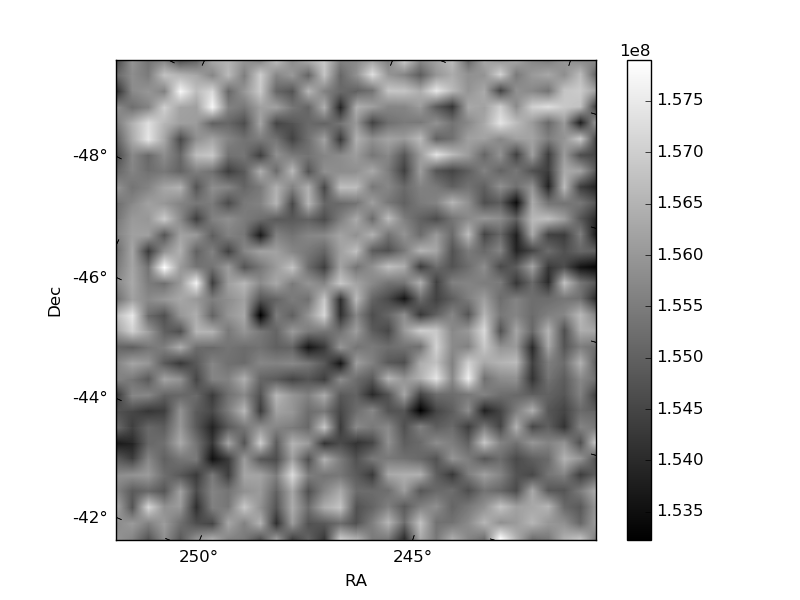
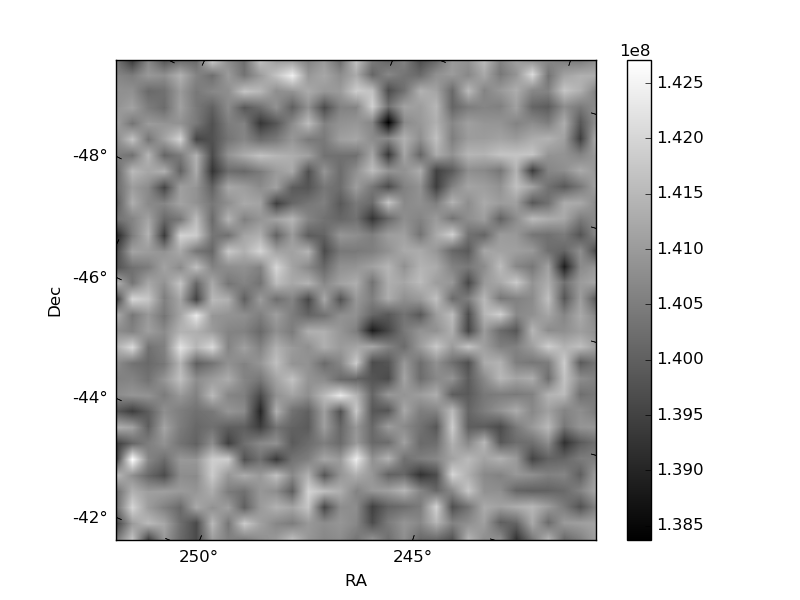
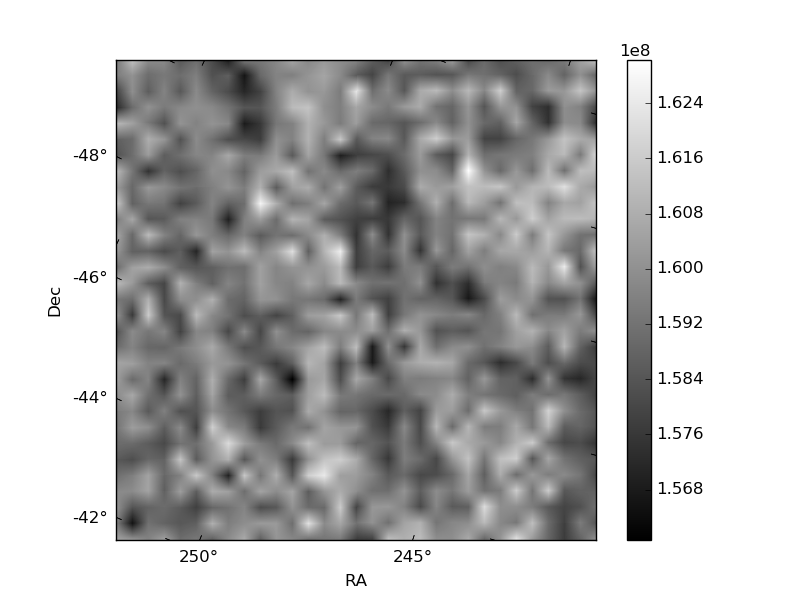
Histogram calculated using DETX and DETY for each event in the final _common_clean file
| Quadrant A | 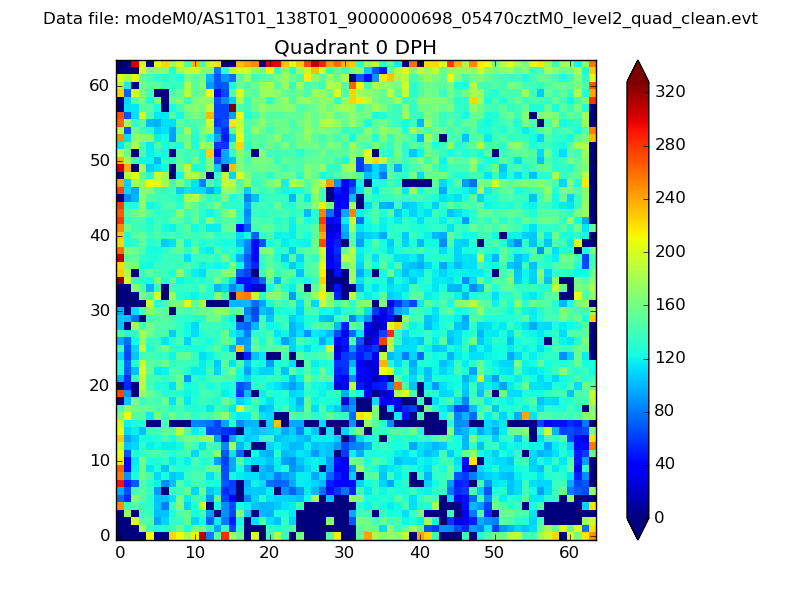 |
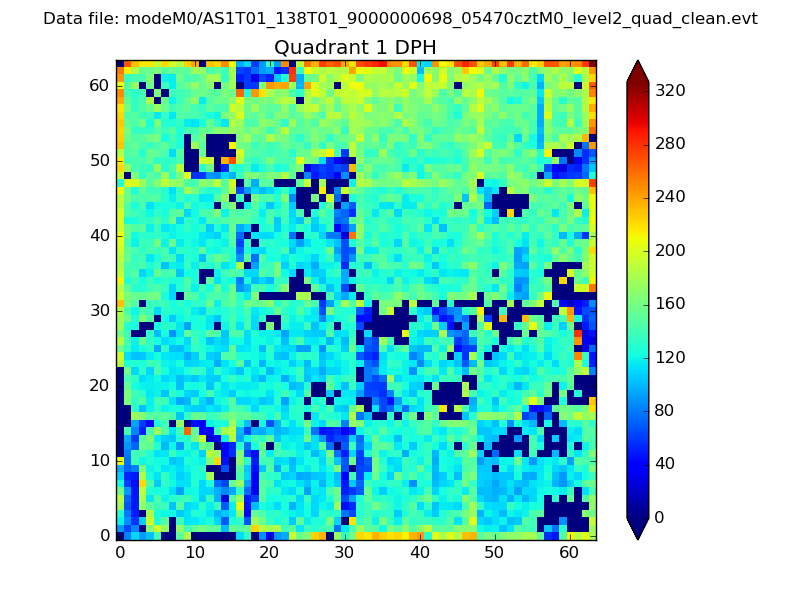 |
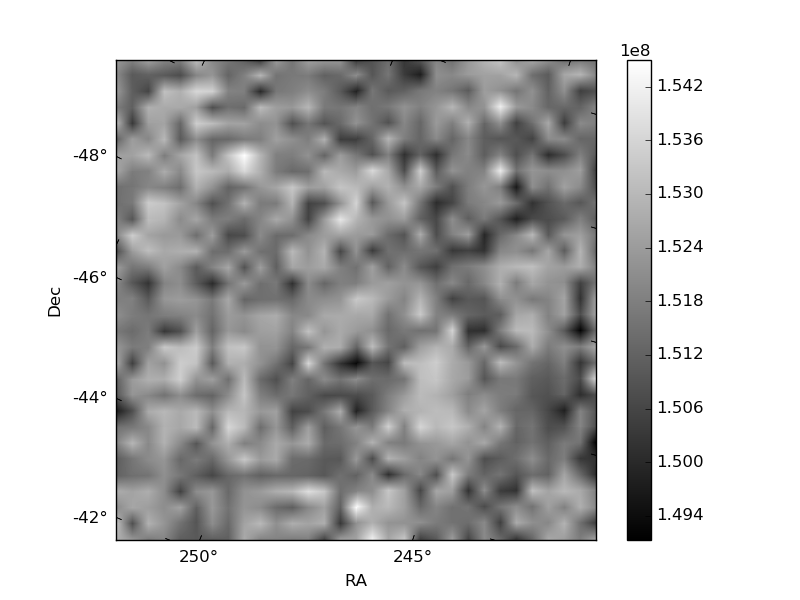
Quadrant B |
|---|---|---|---|
| Quadrant D | 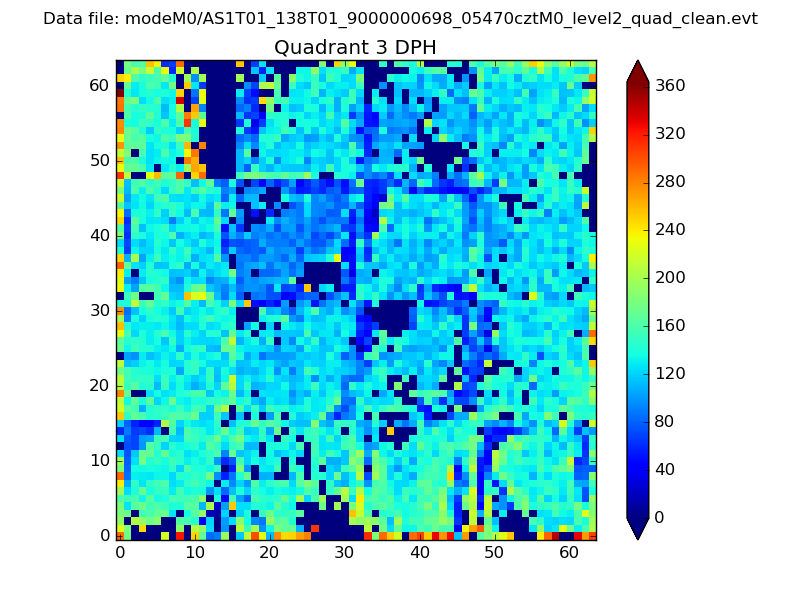 |
 |
Quadrant C |
| Plot type | Count rate plots | Images |
|---|---|---|
| Comparison with Poisson distribution Blue bars denote a histogram of data divided into 1 sec bins. Red curve is a Poisson curve with rate = median count rate of data. |
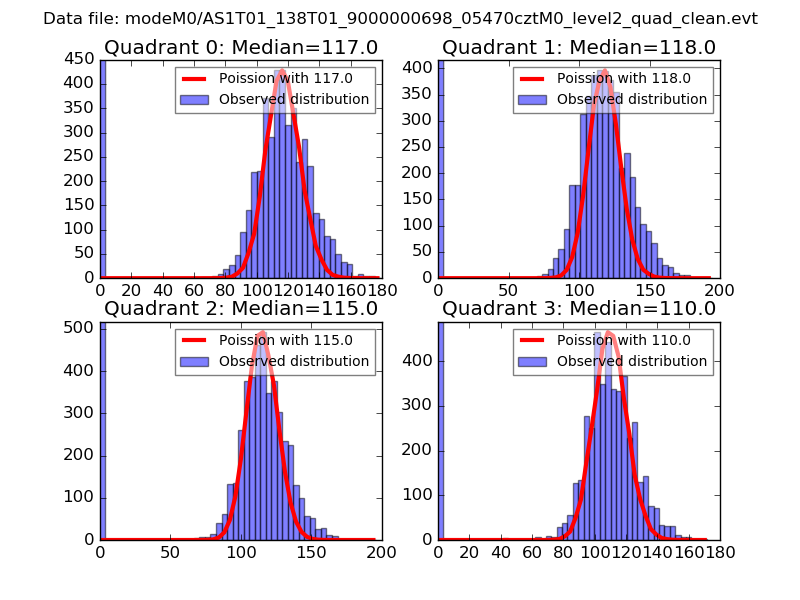 |
 |
| Quadrant-wise count rates Data is divided into 100 sec bins |
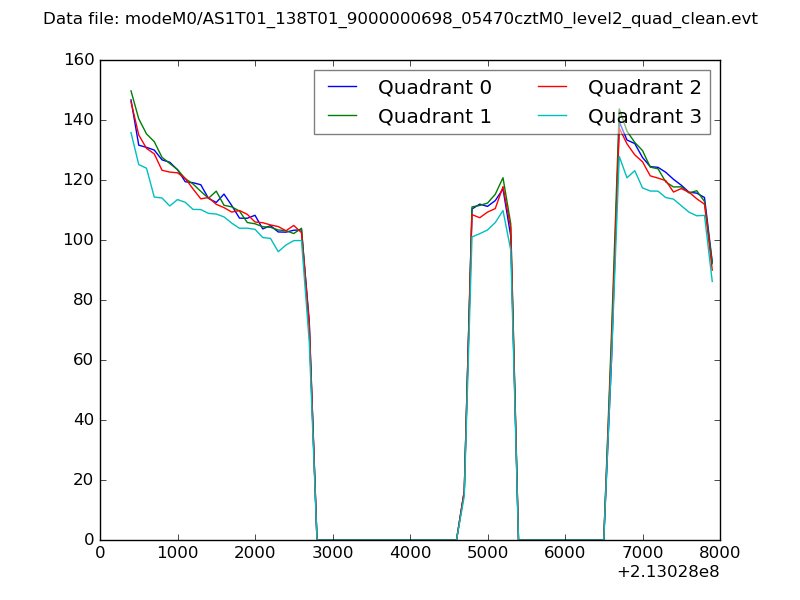 |
|
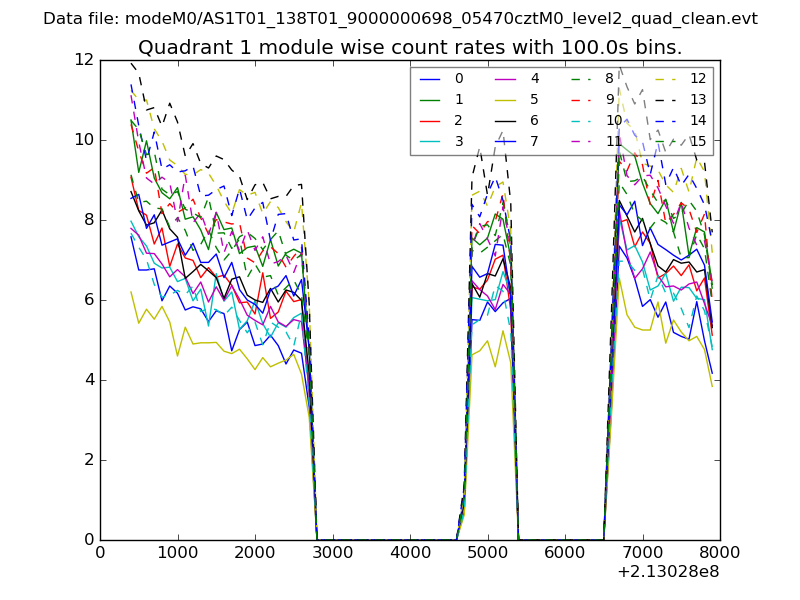
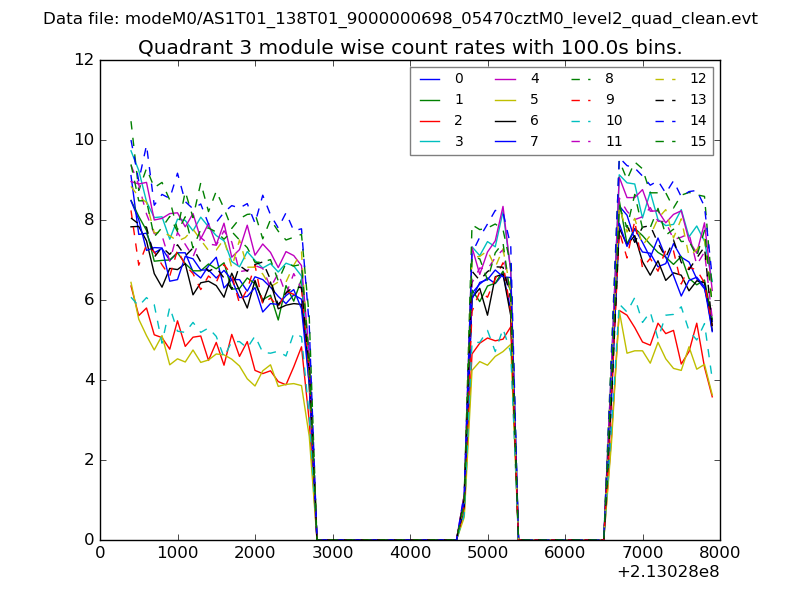
| Module-wise count rates for Quadrant A Data is divided into 100 sec bins |
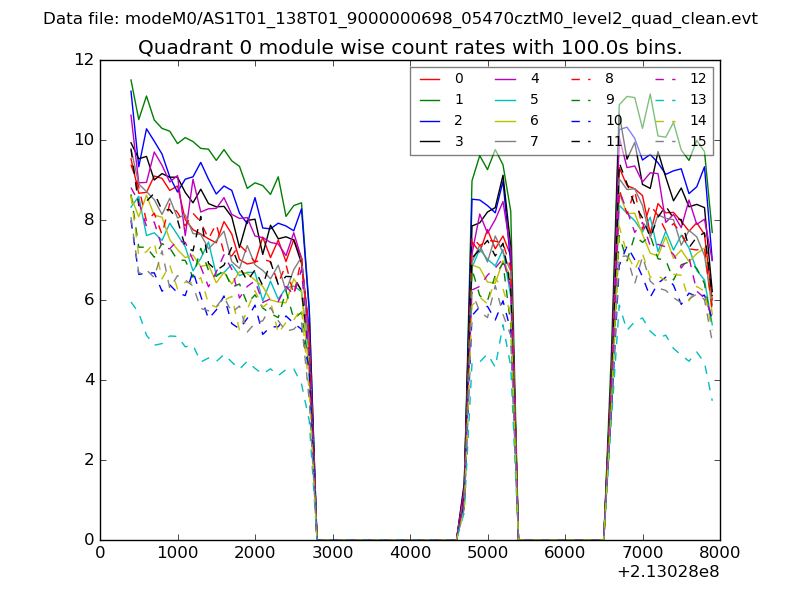 |
 |
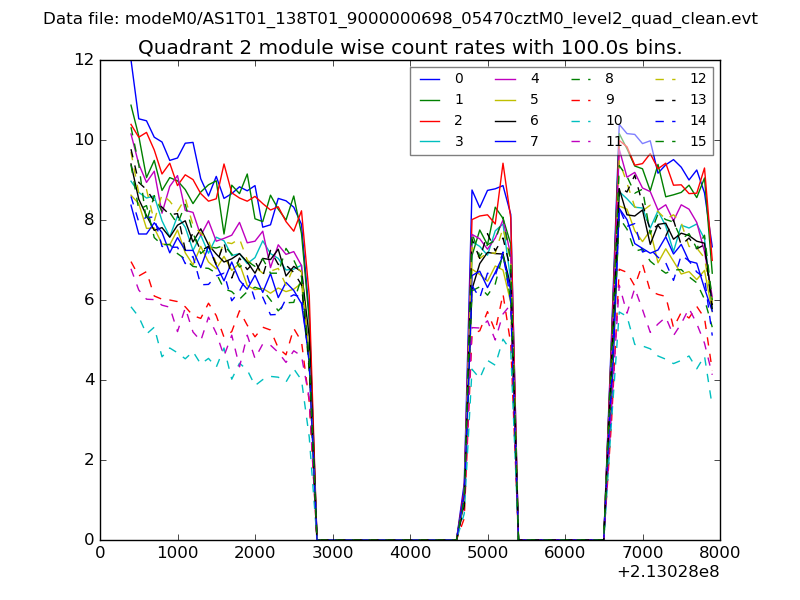
| Module-wise count rates for Quadrant B Data is divided into 100 sec bins |
 |
 |
| Module-wise count rates for Quadrant C Data is divided into 100 sec bins |
 |
 |
| Module-wise count rates for Quadrant D Data is divided into 100 sec bins |
 |
 |
| Parameter | Plot |
|---|---|
| CZT HV Monitor | 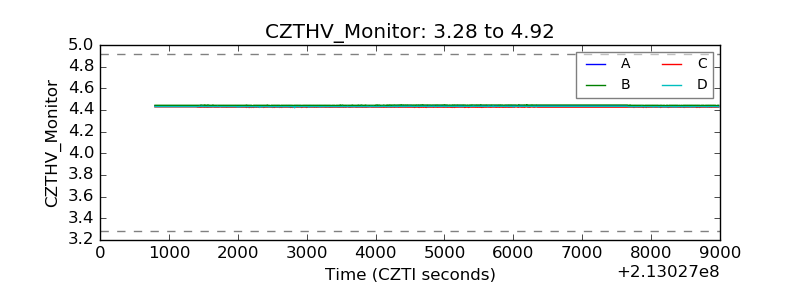 |
| D_VDD | 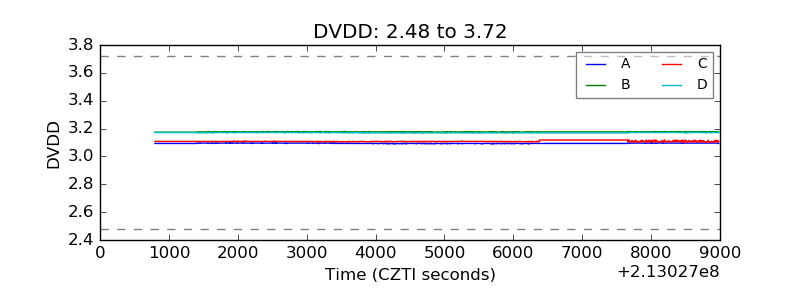 |
| Temperature 1 | 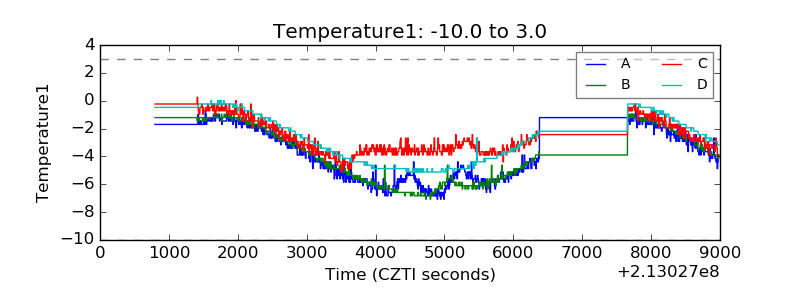 |
| Veto HV Monitor | 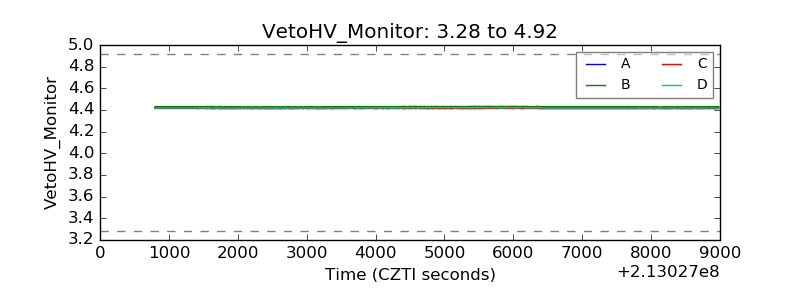 |
| Veto LLD | 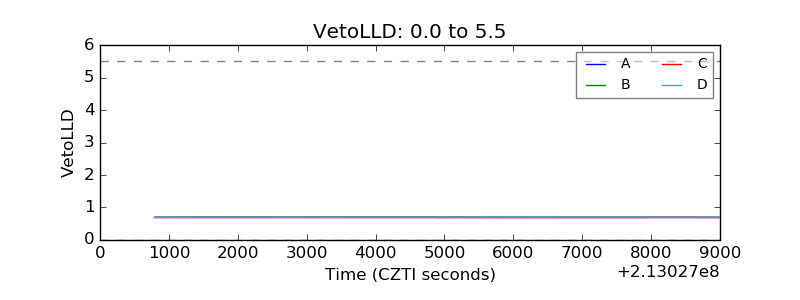 |
| Alpha Counter | 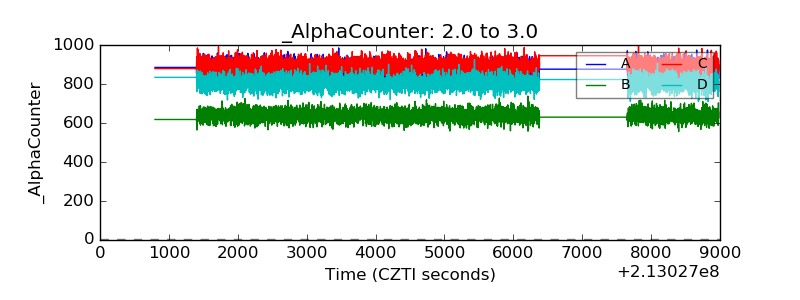 |
| _CPM_Rate | 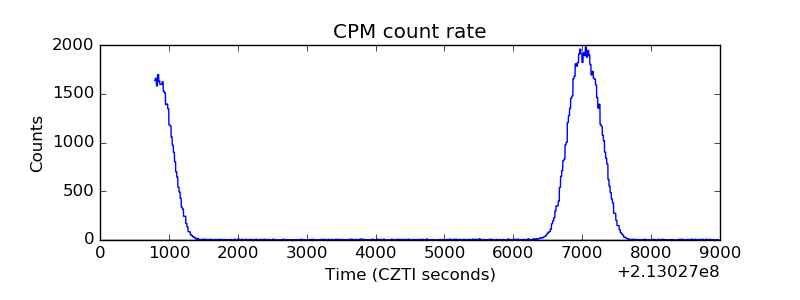 |
| CZT Counter | 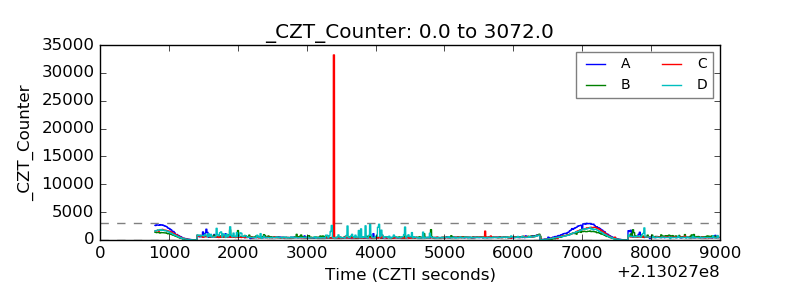 |
| +2.5 Volts monitor |  |
| +5 Volts monitor |  |
| _ROLL_ROT | 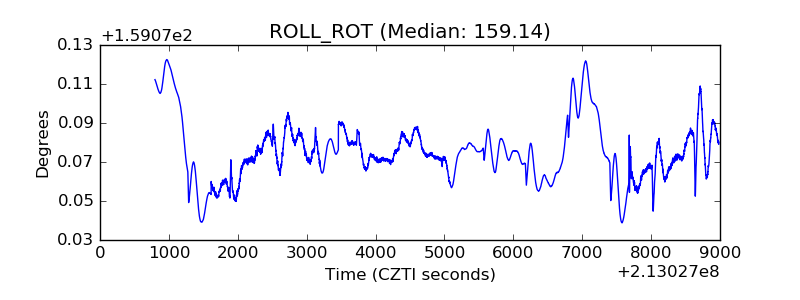 |
| _Roll_DEC |  |
| _Roll_RA | 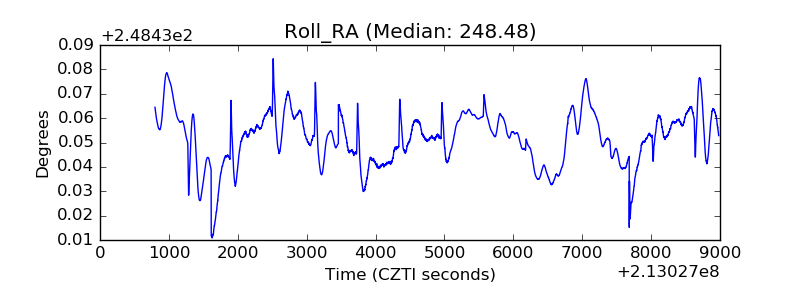 |
| Veto Counter | 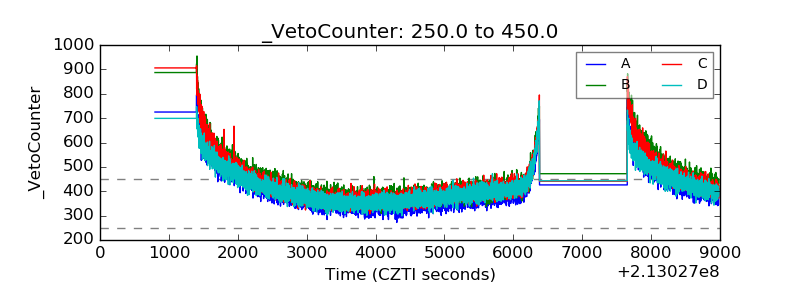 |