| Param | Original file | Final file |
|---|---|---|
| Filename | modeM0/AS1T01_138T01_9000000698_05471cztM0_level2.evt | modeM0/AS1T01_138T01_9000000698_05471cztM0_level2_quad_clean.evt |
| Size (bytes) | 447,223,680 | 71,688,960 |
| Size | 426.5 MB | 68.4 MB |
| Events in quadrant A | 2,957,267 | 450,766 |
| Events in quadrant B | 3,912,300 | 435,350 |
| Events in quadrant C | 2,786,746 | 448,464 |
| Events in quadrant D | 3,487,223 | 423,902 |
| Mode M9 | |||
|---|---|---|---|
| Quadrant | BADHDUFLAG | Total packets | Discarded packets |
| A | 0 | 14 | 0 |
| B | 0 | 14 | 0 |
| C | 0 | 14 | 0 |
| D | 0 | 14 | 0 |
| Mode SS | |||
|---|---|---|---|
| Quadrant | BADHDUFLAG | Total packets | Discarded packets |
| A | 0 | 118 | 0 |
| B | 0 | 118 | 0 |
| C | 0 | 118 | 0 |
| D | 0 | 118 | 0 |
| Mode M0 | |||
|---|---|---|---|
| Quadrant | BADHDUFLAG | Total packets | Discarded packets |
| A | 0 | 12682 | 2 |
| B | 0 | 15510 | 1 |
| C | 0 | 12242 | 1 |
| D | 0 | 14403 | 1 |
| Quadrant | Total seconds | Saturated seconds | Saturation percentage |
|---|---|---|---|
| A | 5904 | 37 | 0.626694% |
| B | 5904 | 281 | 4.759485% |
| C | 5904 | 17 | 0.287940% |
| D | 5904 | 151 | 2.557588% |
Noise dominated data is calculated using 1-second bins in cleaned event files. If a bin has >2000 counts, and if more than 50% of those come from <1% of pixels, then it is considered to be noise-dominated and hence unusable.
| Quadrant | # 1 sec bins | Bins with >0 counts | Bins with >2000 counts | High rate bins dominated by noise | Noise dominated (total time) | Noise dominated (detector-on time) | Marked lightcurve |
|---|---|---|---|---|---|---|---|
| A | 7244 | 5905 | 16 | 16 | 0.22% | 0.27% | 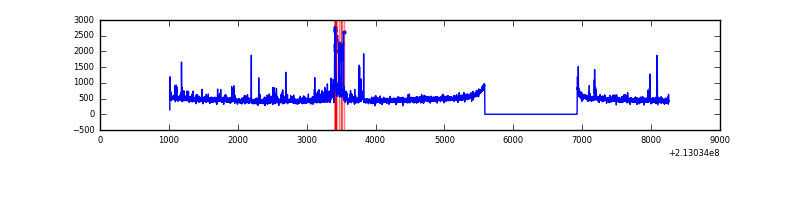 |
| B | 7244 | 5905 | 197 | 197 | 2.72% | 3.34% | 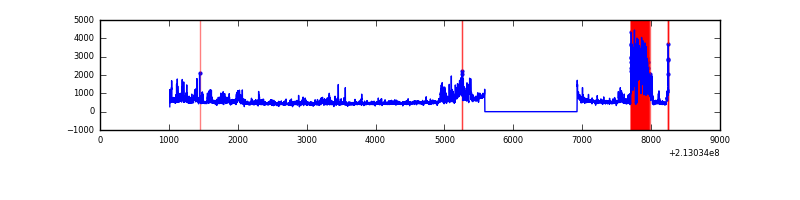 |
| C | 7244 | 5905 | 0 | 0 | 0.00% | 0.00% | 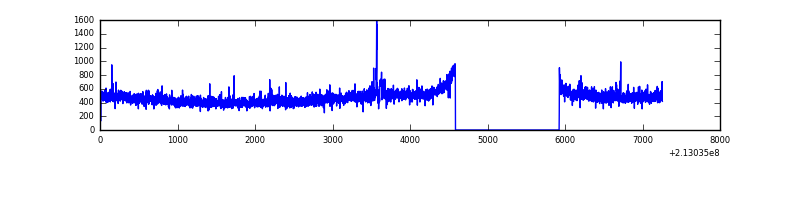 |
| D | 7244 | 5904 | 129 | 129 | 1.78% | 2.18% | 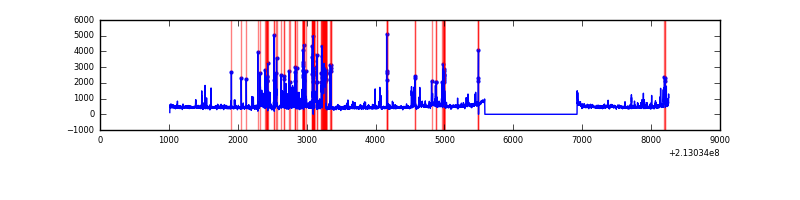 |
Top three noisy pixels from each quadrant. If the there are fewer than three noisy pixels in the level2.evt file, extra rows are filled as -1
| Pixel properties | Quadrant properties | ||||||
|---|---|---|---|---|---|---|---|
| Quadrant | DetID | PixID | Counts | Sigma | Mean | Median | Sigma |
| A | 0 | 247 | 194478 | 1359.34 | 695 | 683 | 142.6 |
| A | 0 | 50 | 37487 | 258.16 | 695 | 683 | 142.6 |
| A | 0 | 226 | 25352 | 173.04 | 695 | 683 | 142.6 |
| B | 10 | 16 | 790631 | 6005.29 | 690 | 676 | 131.5 |
| B | 15 | 204 | 293292 | 2224.49 | 690 | 676 | 131.5 |
| B | 11 | 51 | 44568 | 333.67 | 690 | 676 | 131.5 |
| C | 9 | 247 | 132662 | 852.01 | 668 | 672 | 154.9 |
| C | 1 | 16 | 12069 | 73.57 | 668 | 672 | 154.9 |
| C | 8 | 128 | 11611 | 70.61 | 668 | 672 | 154.9 |
| D | 2 | 33 | 522627 | 3216.14 | 659 | 637 | 162.3 |
| D | 2 | 152 | 210888 | 1295.42 | 659 | 637 | 162.3 |
| D | 2 | 14 | 81378 | 497.47 | 659 | 637 | 162.3 |
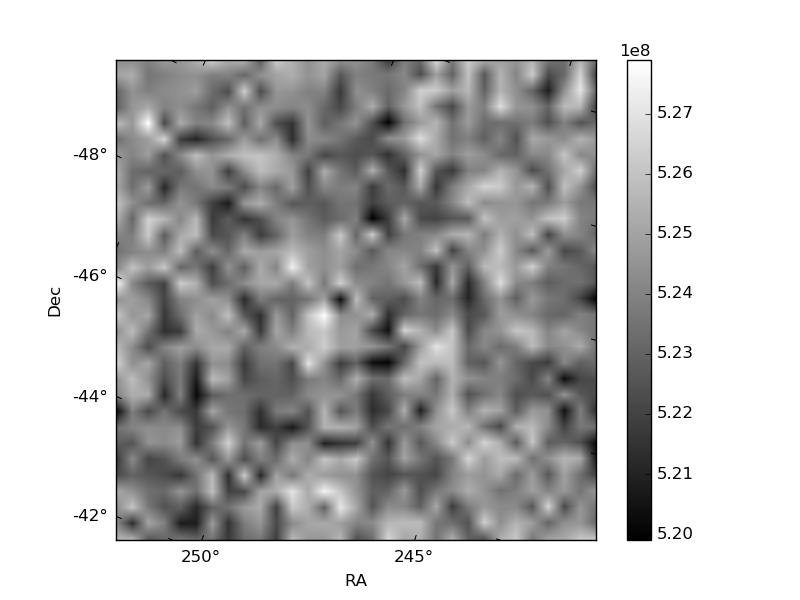
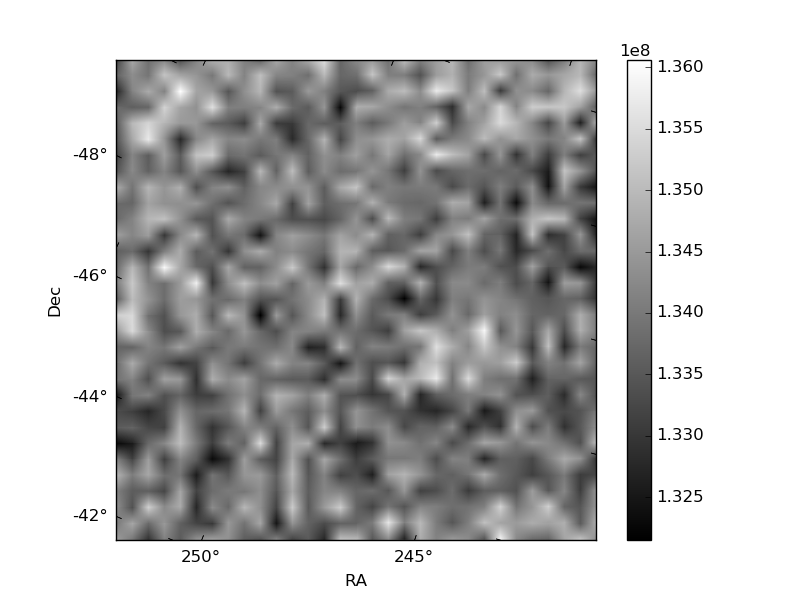
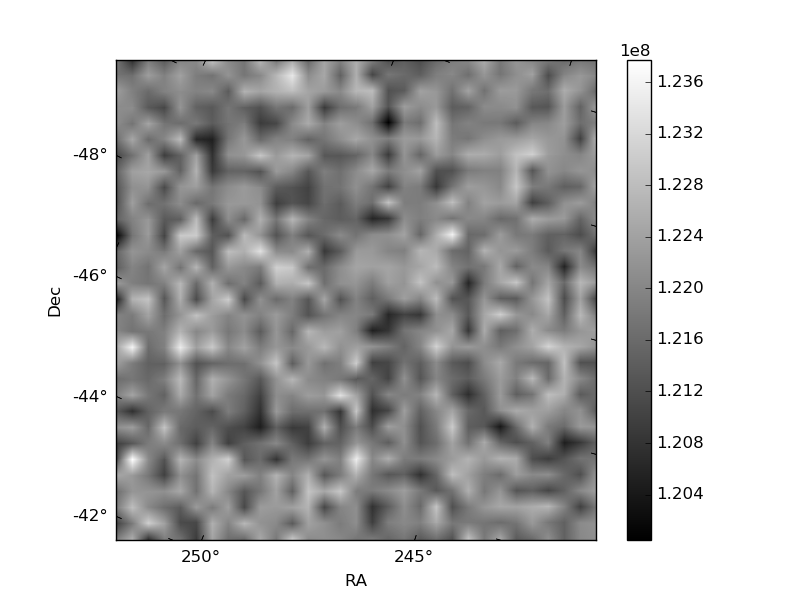
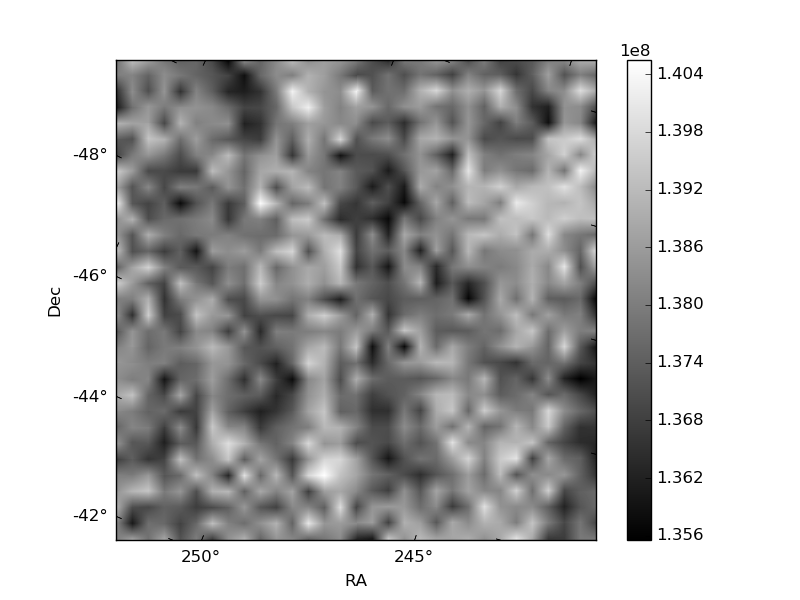
Histogram calculated using DETX and DETY for each event in the final _common_clean file
| Quadrant A | 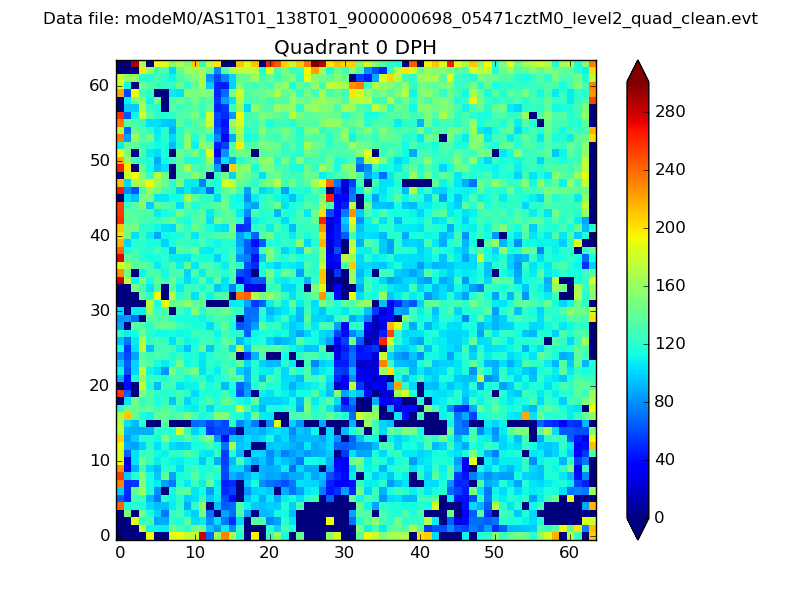 |
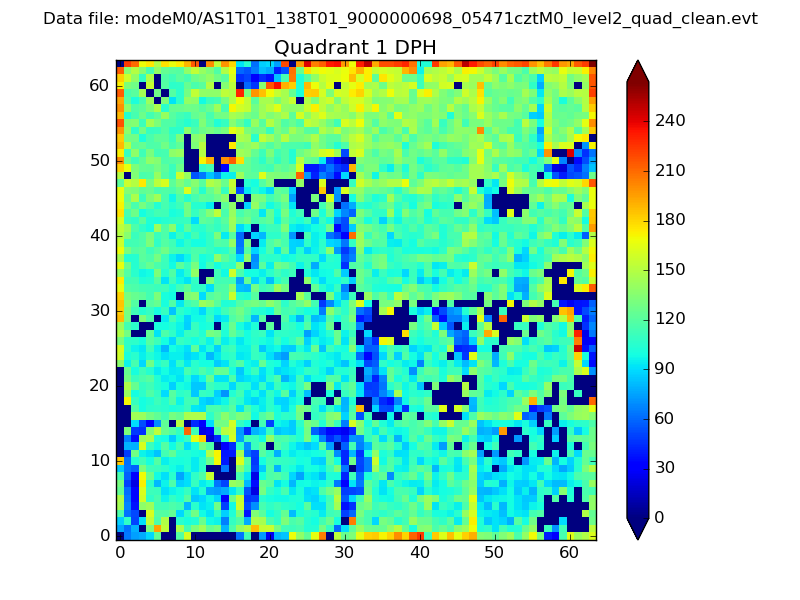 |
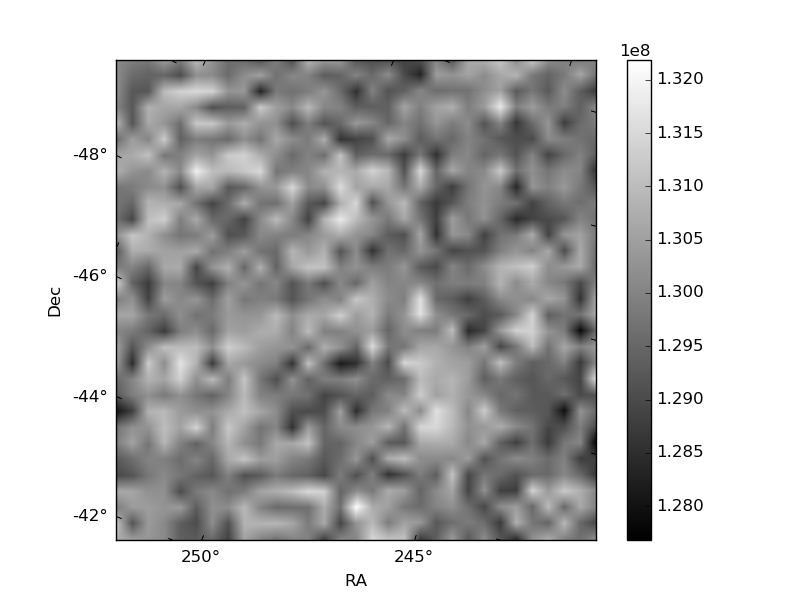
Quadrant B |
|---|---|---|---|
| Quadrant D | 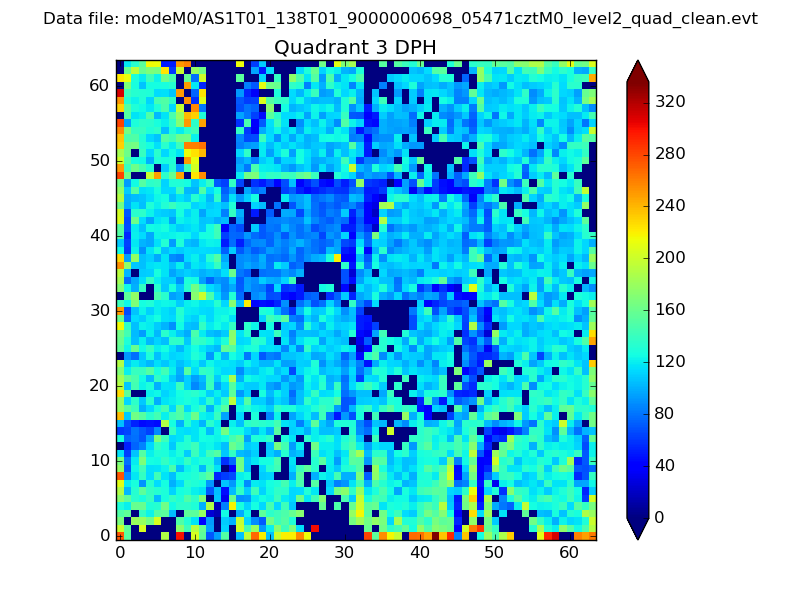 |
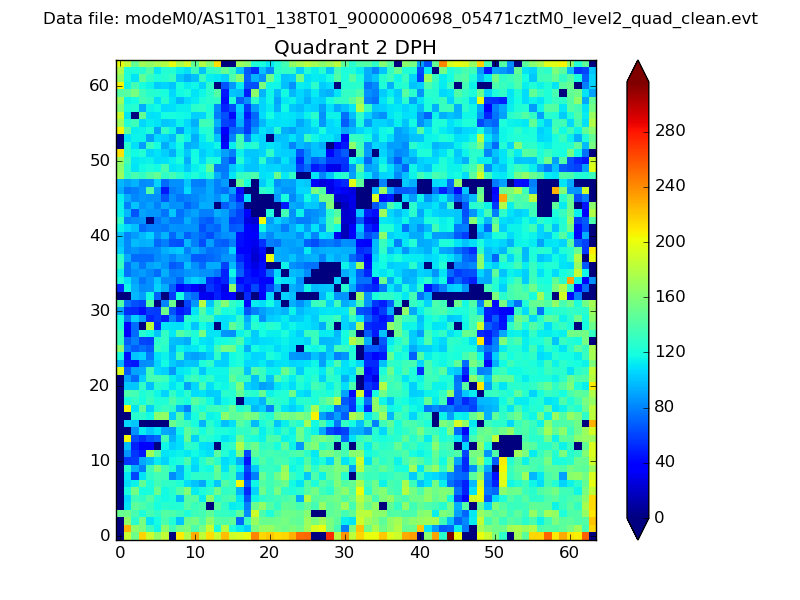 |
Quadrant C |
| Plot type | Count rate plots | Images |
|---|---|---|
| Comparison with Poisson distribution Blue bars denote a histogram of data divided into 1 sec bins. Red curve is a Poisson curve with rate = median count rate of data. |
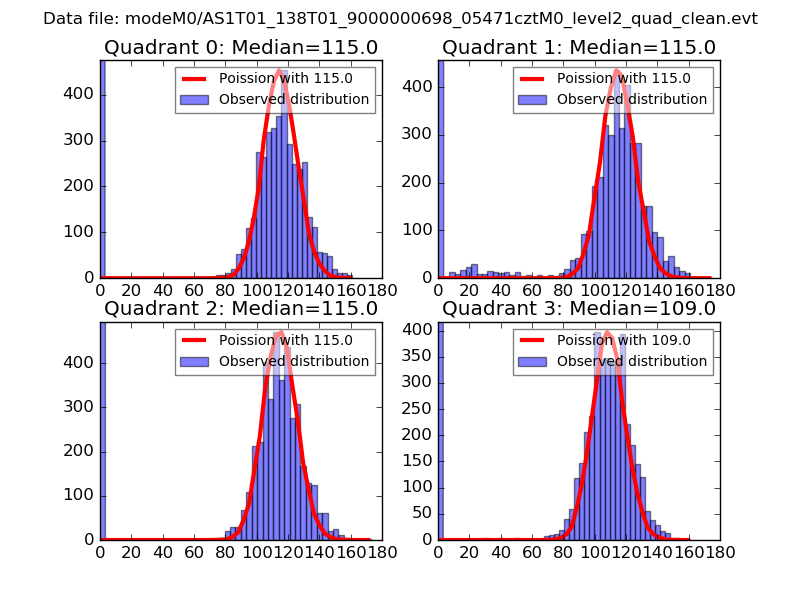 |
 |
| Quadrant-wise count rates Data is divided into 100 sec bins |
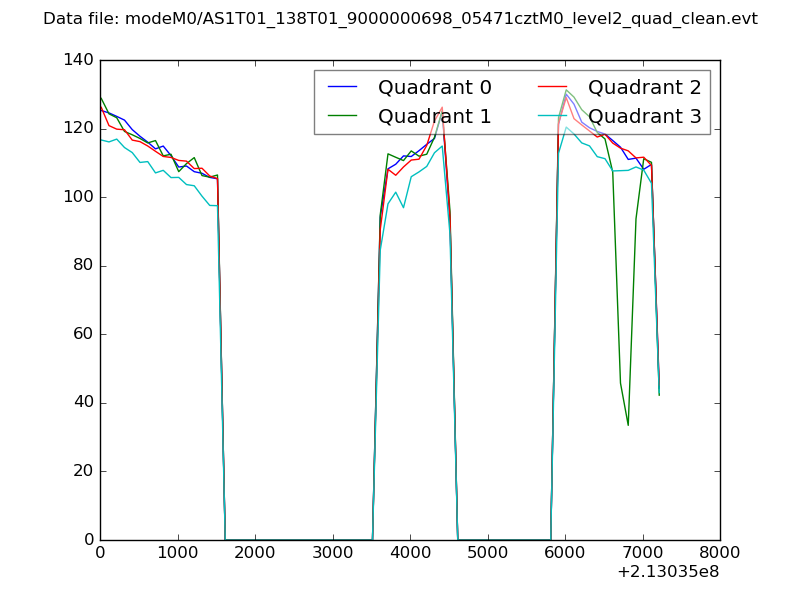 |
|
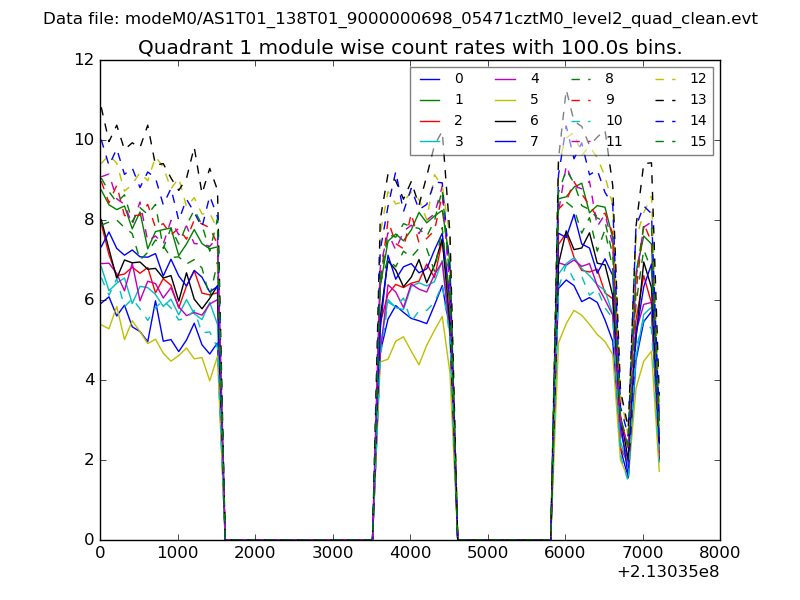
| Module-wise count rates for Quadrant A Data is divided into 100 sec bins |
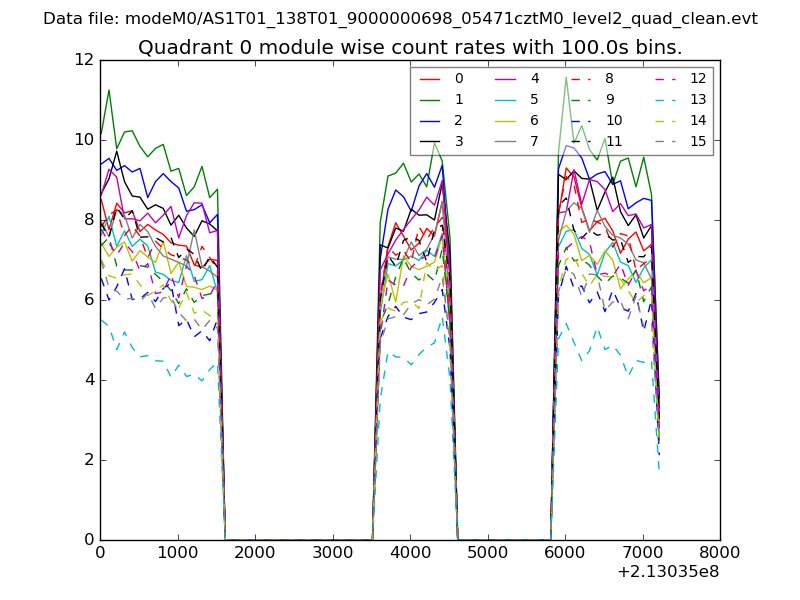 |
 |
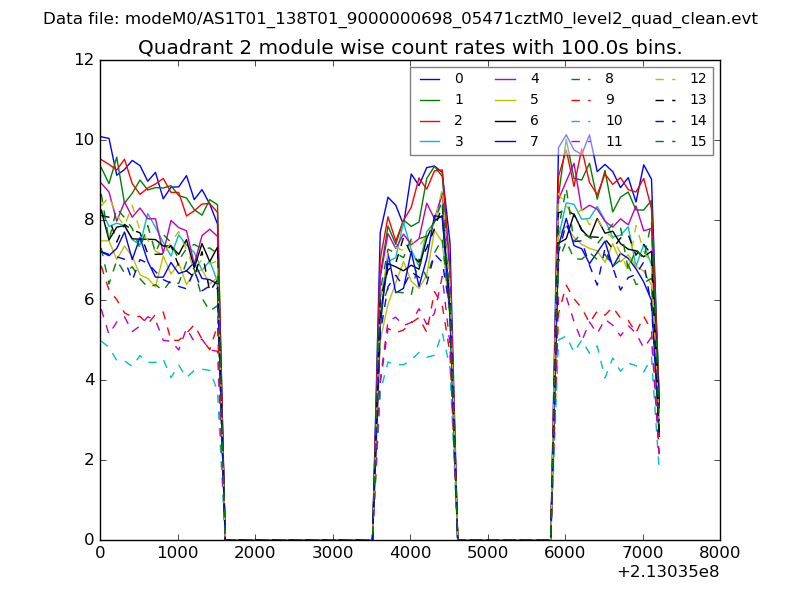
| Module-wise count rates for Quadrant B Data is divided into 100 sec bins |
 |
 |
| Module-wise count rates for Quadrant C Data is divided into 100 sec bins |
 |
 |
| Module-wise count rates for Quadrant D Data is divided into 100 sec bins |
 |
 |
| Parameter | Plot |
|---|---|
| CZT HV Monitor | 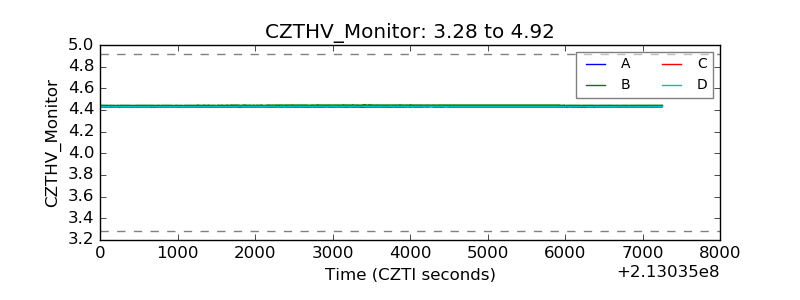 |
| D_VDD | 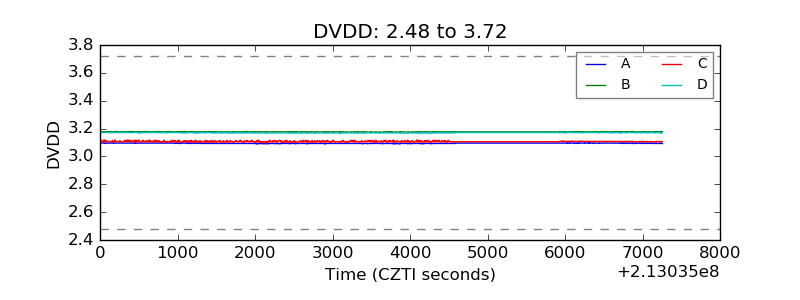 |
| Temperature 1 | 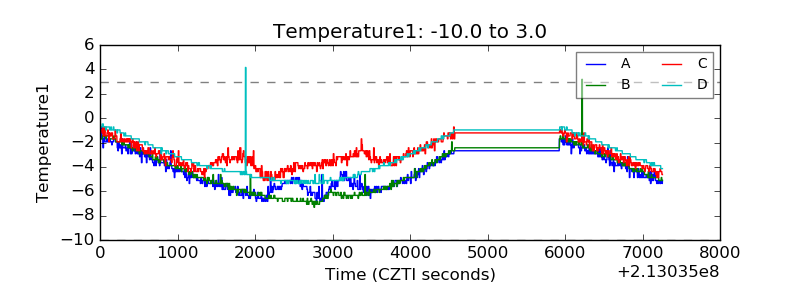 |
| Veto HV Monitor | 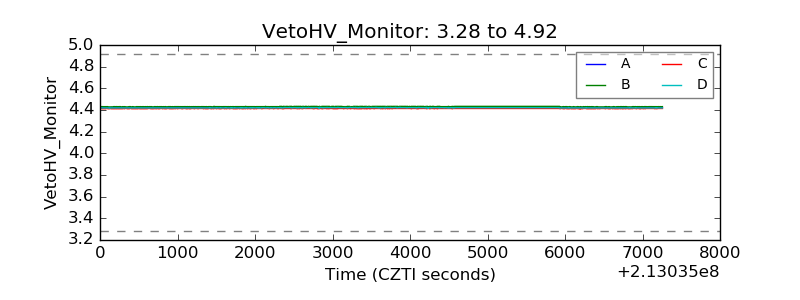 |
| Veto LLD | 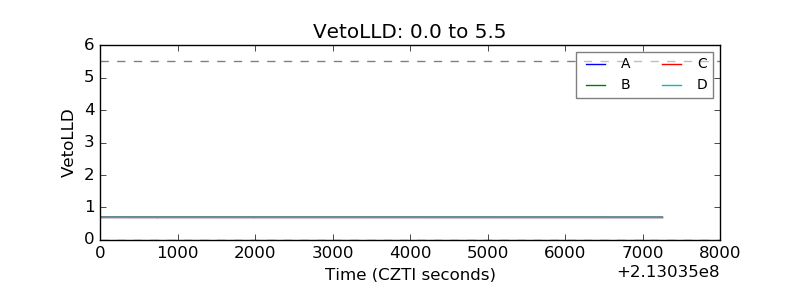 |
| Alpha Counter | 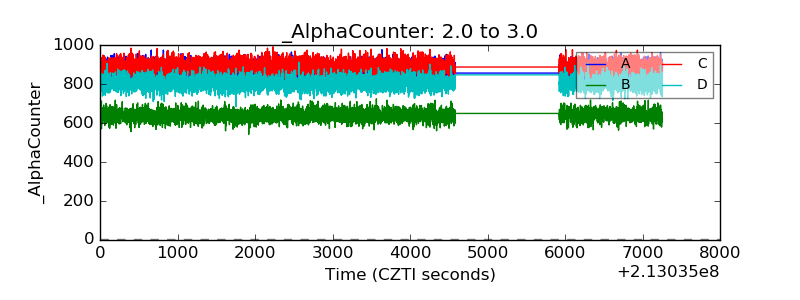 |
| _CPM_Rate | 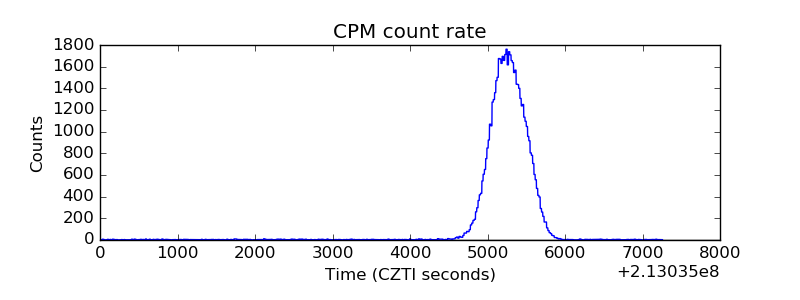 |
| CZT Counter | 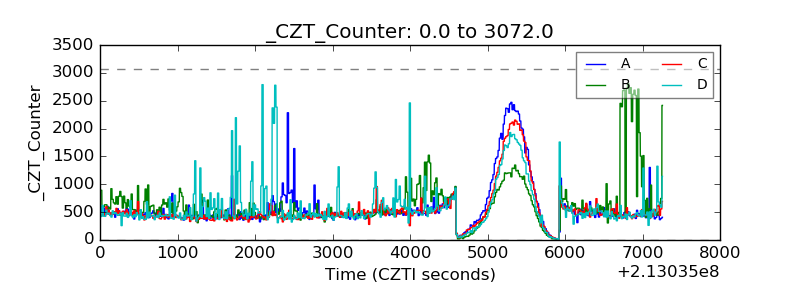 |
| +2.5 Volts monitor |  |
| +5 Volts monitor | 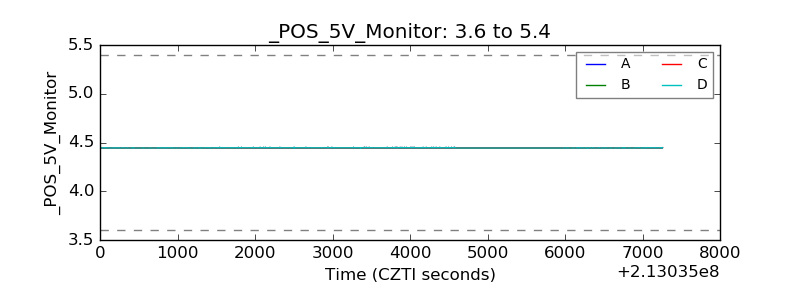 |
| _ROLL_ROT |  |
| _Roll_DEC | 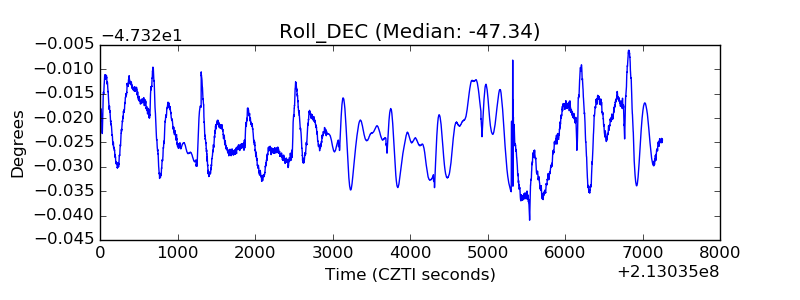 |
| _Roll_RA | 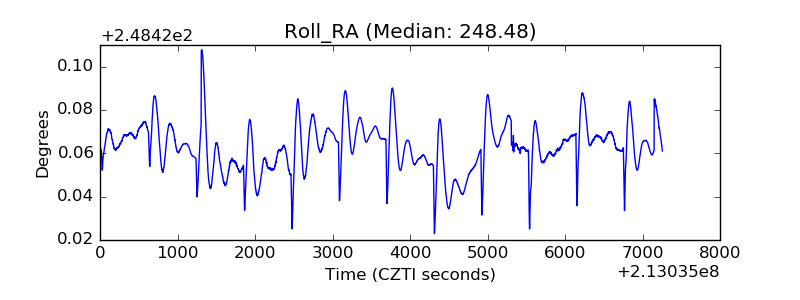 |
| Veto Counter |  |