| Param | Original file | Final file |
|---|---|---|
| Filename | modeM0/AS1T01_138T01_9000000698_05472cztM0_level2.evt | modeM0/AS1T01_138T01_9000000698_05472cztM0_level2_quad_clean.evt |
| Size (bytes) | 488,148,480 | 73,275,840 |
| Size | 465.5 MB | 69.9 MB |
| Events in quadrant A | 2,869,473 | 459,061 |
| Events in quadrant B | 4,482,647 | 439,922 |
| Events in quadrant C | 3,079,341 | 460,909 |
| Events in quadrant D | 3,935,260 | 429,897 |
| Mode M9 | |||
|---|---|---|---|
| Quadrant | BADHDUFLAG | Total packets | Discarded packets |
| A | 0 | 13 | 0 |
| B | 0 | 13 | 0 |
| C | 0 | 13 | 0 |
| D | 0 | 13 | 0 |
| Mode SS | |||
|---|---|---|---|
| Quadrant | BADHDUFLAG | Total packets | Discarded packets |
| A | 0 | 124 | 0 |
| B | 0 | 124 | 0 |
| C | 0 | 124 | 0 |
| D | 0 | 124 | 0 |
| Mode M0 | |||
|---|---|---|---|
| Quadrant | BADHDUFLAG | Total packets | Discarded packets |
| A | 0 | 12758 | 5 |
| B | 0 | 17309 | 2 |
| C | 0 | 13057 | 2 |
| D | 0 | 15817 | 2 |
| Quadrant | Total seconds | Saturated seconds | Saturation percentage |
|---|---|---|---|
| A | 6144 | 22 | 0.358073% |
| B | 6145 | 437 | 7.111473% |
| C | 6145 | 7 | 0.113914% |
| D | 6145 | 166 | 2.701383% |
Noise dominated data is calculated using 1-second bins in cleaned event files. If a bin has >2000 counts, and if more than 50% of those come from <1% of pixels, then it is considered to be noise-dominated and hence unusable.
| Quadrant | # 1 sec bins | Bins with >0 counts | Bins with >2000 counts | High rate bins dominated by noise | Noise dominated (total time) | Noise dominated (detector-on time) | Marked lightcurve |
|---|---|---|---|---|---|---|---|
| A | 7420 | 6146 | 1 | 1 | 0.01% | 0.02% | 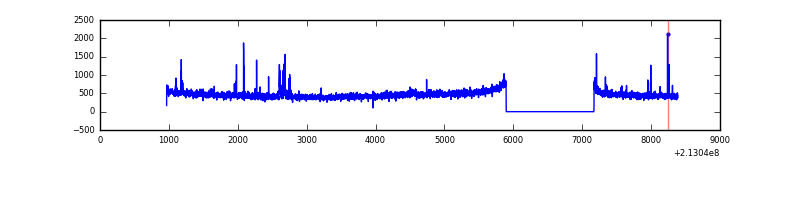 |
| B | 7420 | 6146 | 346 | 346 | 4.66% | 5.63% | 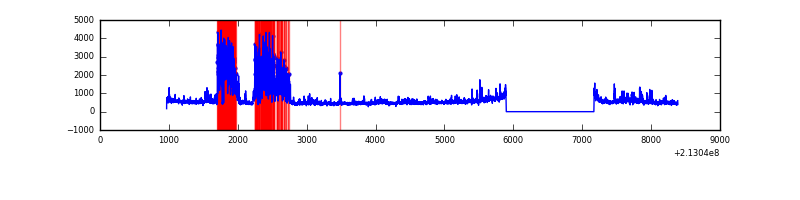 |
| C | 7420 | 6146 | 0 | 0 | 0.00% | 0.00% | 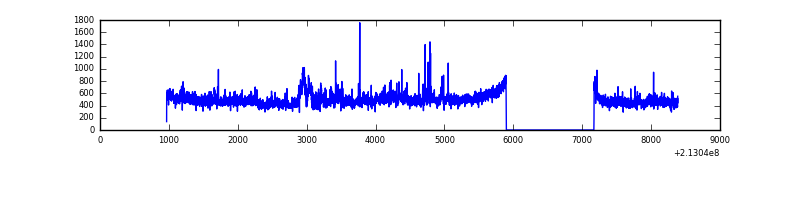 |
| D | 7420 | 6146 | 163 | 163 | 2.20% | 2.65% | 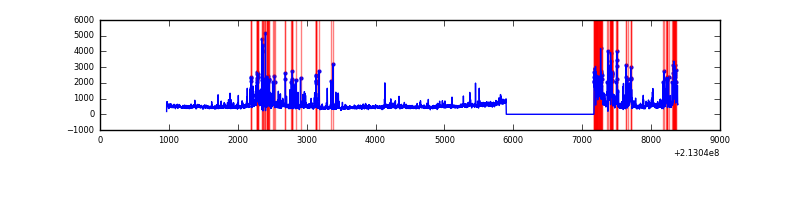 |
Top three noisy pixels from each quadrant. If the there are fewer than three noisy pixels in the level2.evt file, extra rows are filled as -1
| Pixel properties | Quadrant properties | ||||||
|---|---|---|---|---|---|---|---|
| Quadrant | DetID | PixID | Counts | Sigma | Mean | Median | Sigma |
| A | 0 | 50 | 52589 | 350.46 | 722 | 706 | 148.0 |
| A | 0 | 247 | 10474 | 65.98 | 722 | 706 | 148.0 |
| A | 13 | 6 | 9394 | 58.68 | 722 | 706 | 148.0 |
| B | 10 | 16 | 1249848 | 9341.11 | 707 | 692 | 133.7 |
| B | 15 | 204 | 350462 | 2615.55 | 707 | 692 | 133.7 |
| B | 11 | 51 | 49938 | 368.25 | 707 | 692 | 133.7 |
| C | 9 | 247 | 345540 | 2166.1 | 693 | 698 | 159.2 |
| C | 14 | 67 | 14671 | 87.77 | 693 | 698 | 159.2 |
| C | 13 | 61 | 5724 | 31.57 | 693 | 698 | 159.2 |
| D | 2 | 33 | 841107 | 4956.96 | 683 | 660 | 169.5 |
| D | 8 | 195 | 154017 | 904.5 | 683 | 660 | 169.5 |
| D | 5 | 81 | 68269 | 398.76 | 683 | 660 | 169.5 |
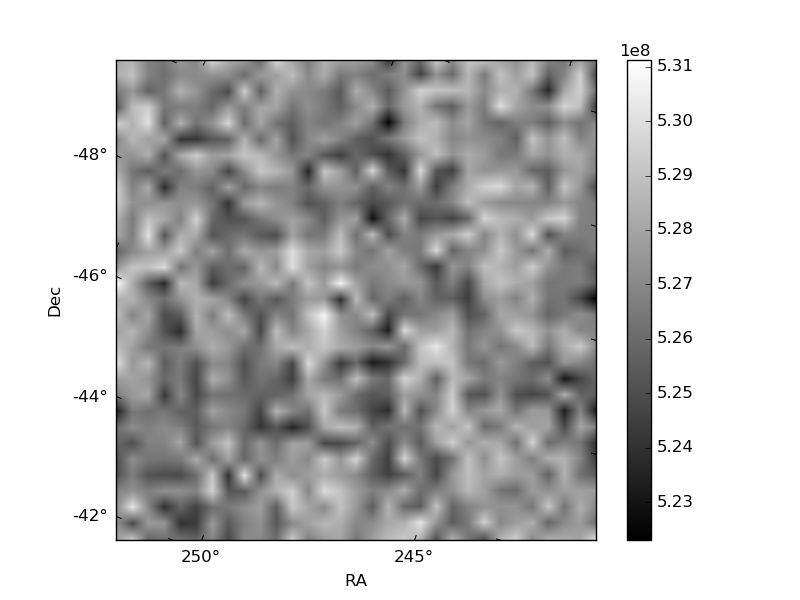
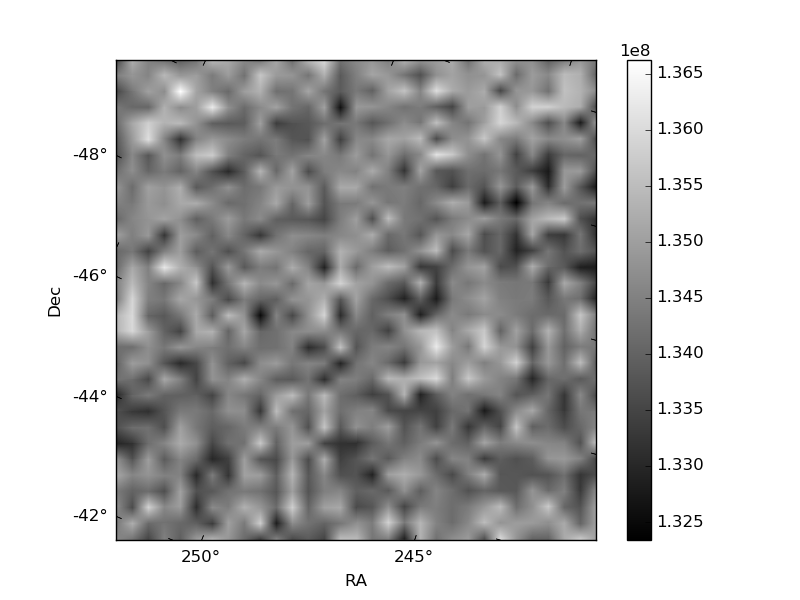
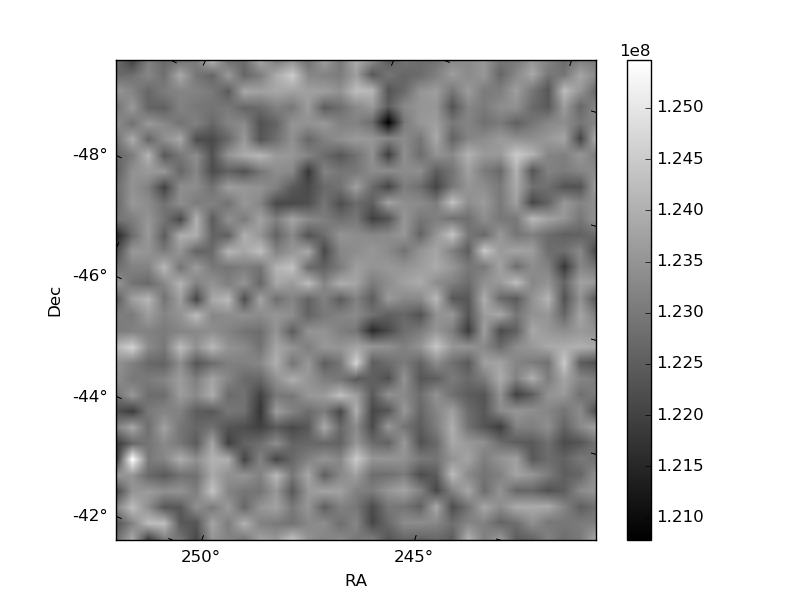
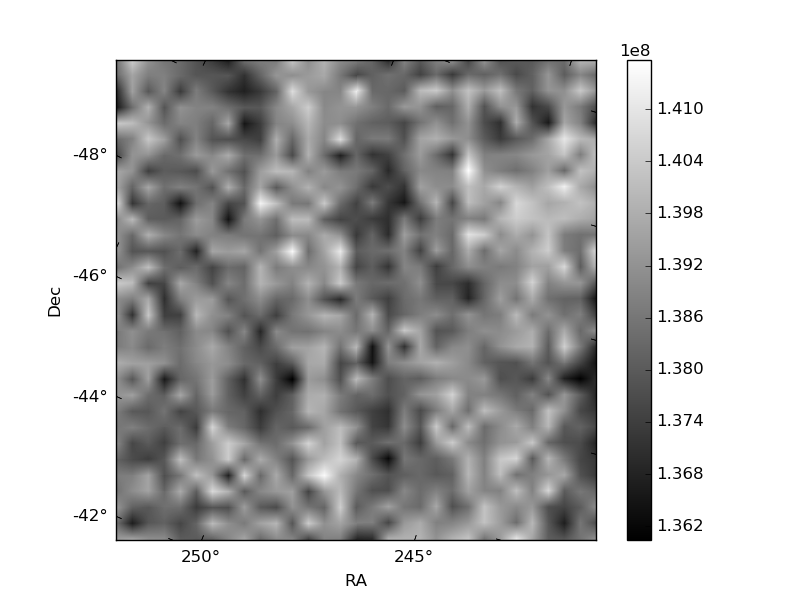
Histogram calculated using DETX and DETY for each event in the final _common_clean file
| Quadrant A | 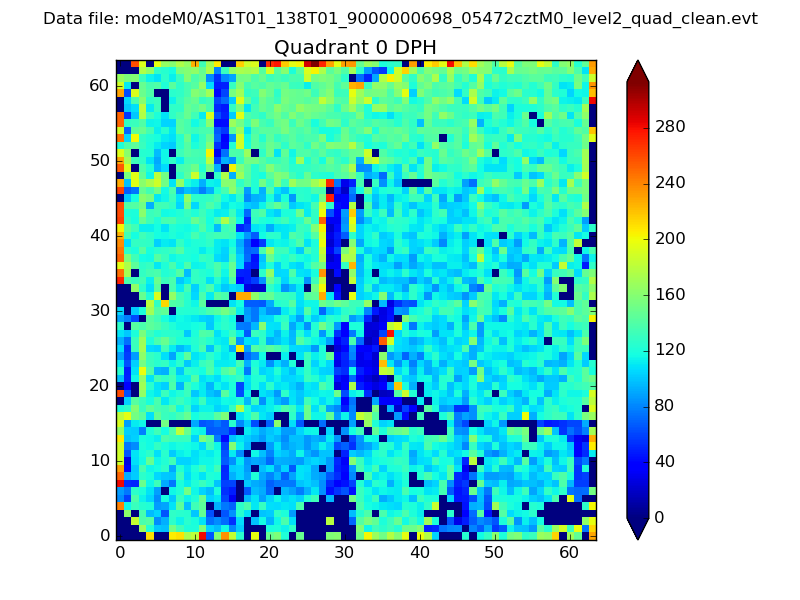 |
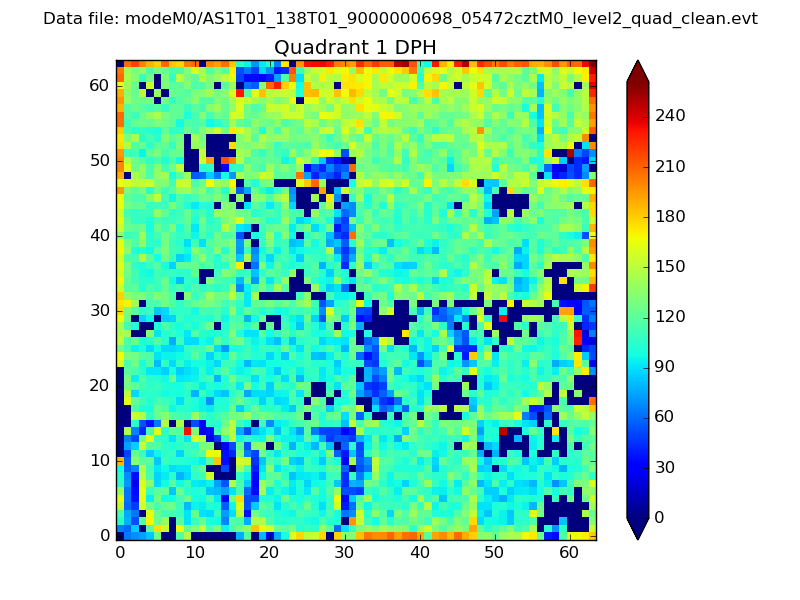 |
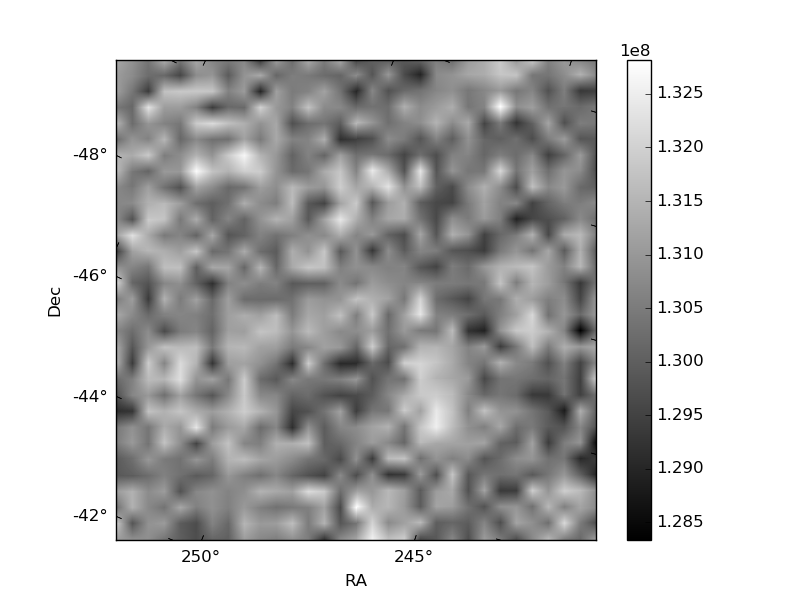
Quadrant B |
|---|---|---|---|
| Quadrant D | 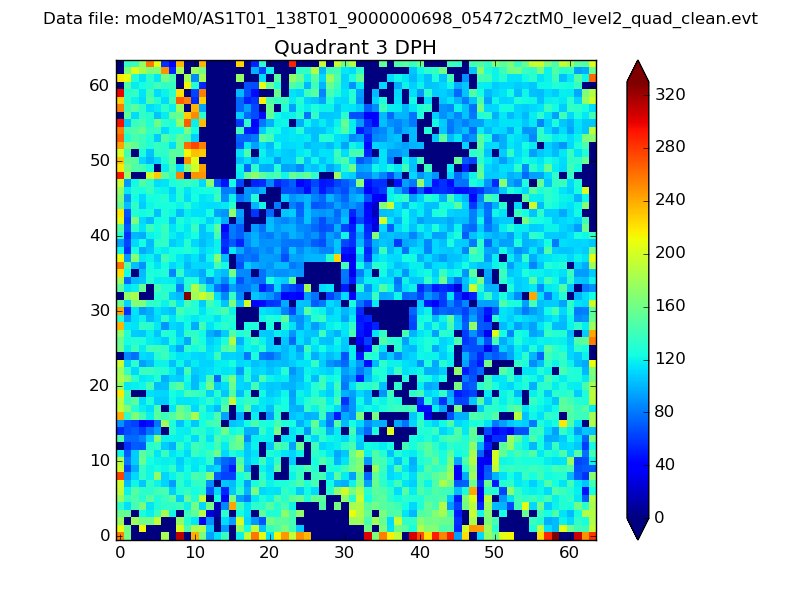 |
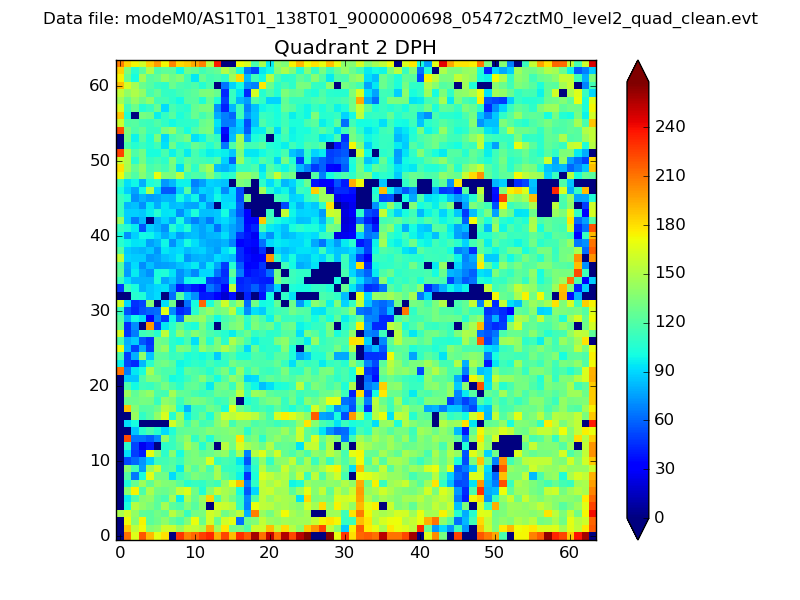 |
Quadrant C |
| Plot type | Count rate plots | Images |
|---|---|---|
| Comparison with Poisson distribution Blue bars denote a histogram of data divided into 1 sec bins. Red curve is a Poisson curve with rate = median count rate of data. |
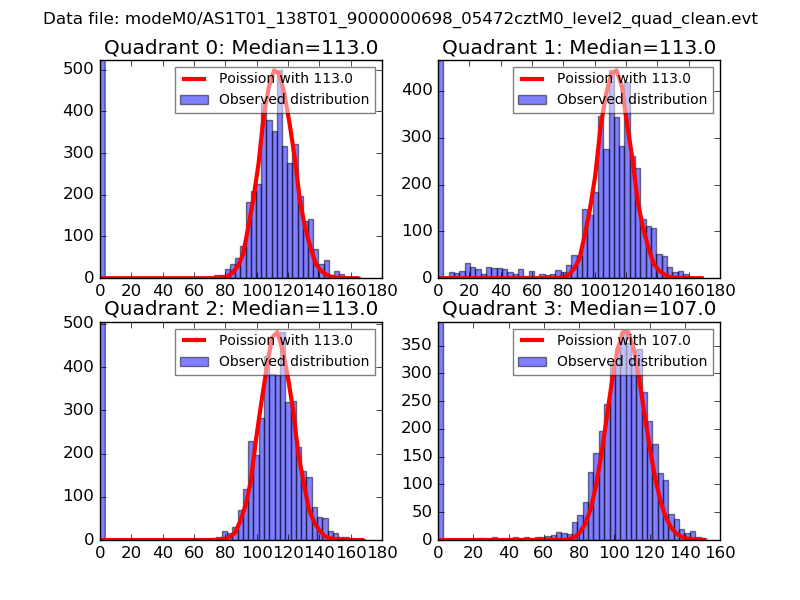 |
 |
| Quadrant-wise count rates Data is divided into 100 sec bins |
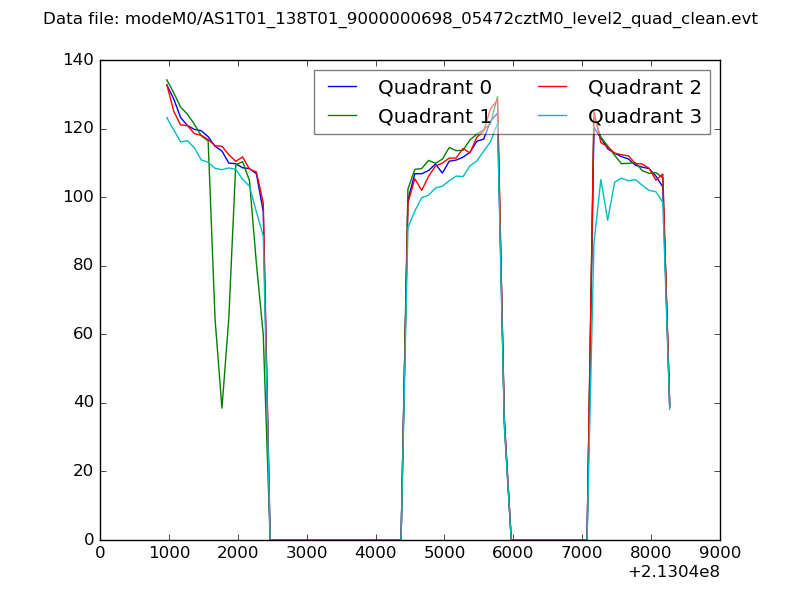 |
|
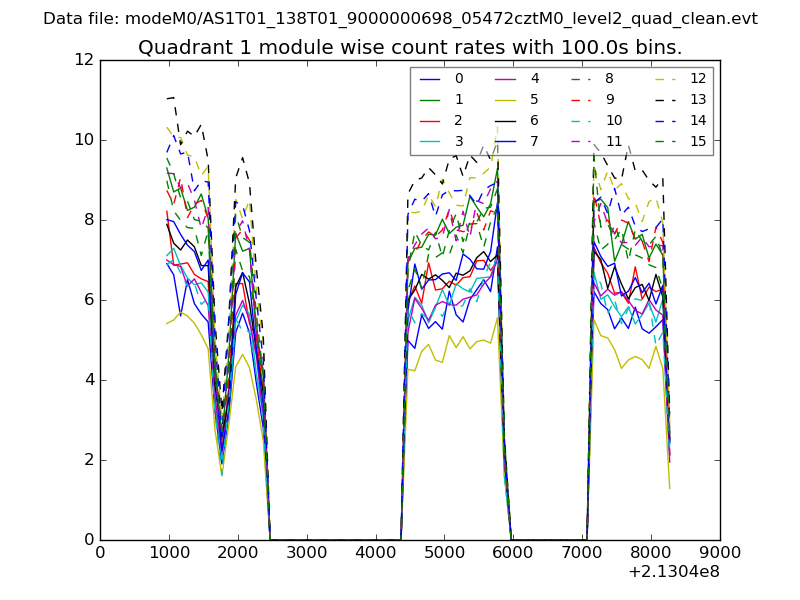
| Module-wise count rates for Quadrant A Data is divided into 100 sec bins |
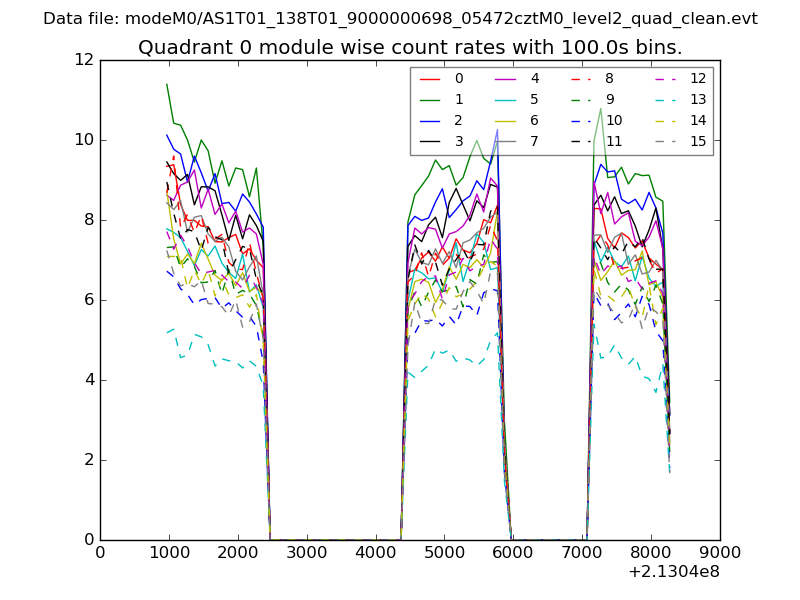 |
 |
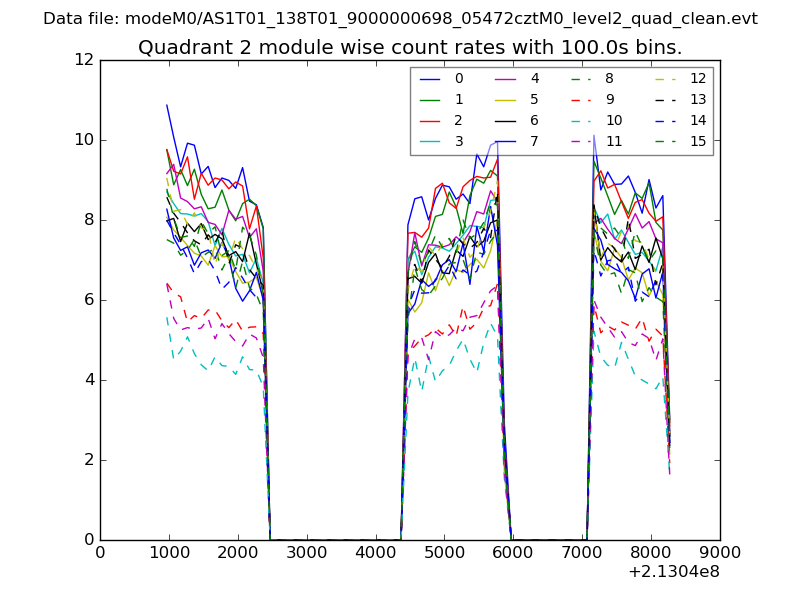
| Module-wise count rates for Quadrant B Data is divided into 100 sec bins |
 |
 |
| Module-wise count rates for Quadrant C Data is divided into 100 sec bins |
 |
 |
| Module-wise count rates for Quadrant D Data is divided into 100 sec bins |
 |
 |
| Parameter | Plot |
|---|---|
| CZT HV Monitor | 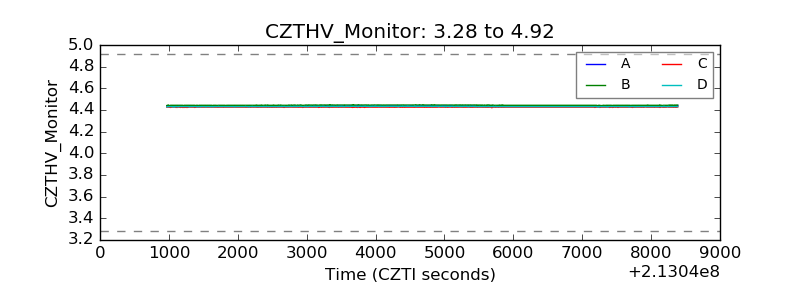 |
| D_VDD | 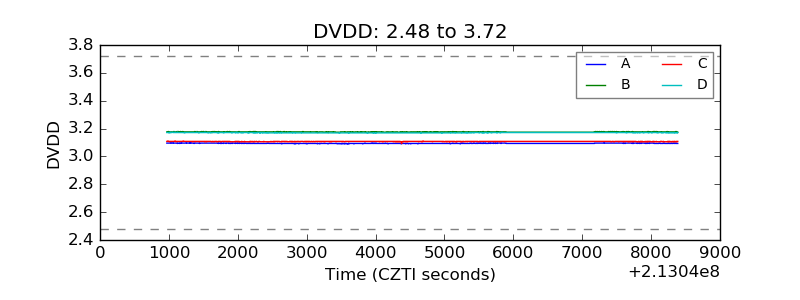 |
| Temperature 1 | 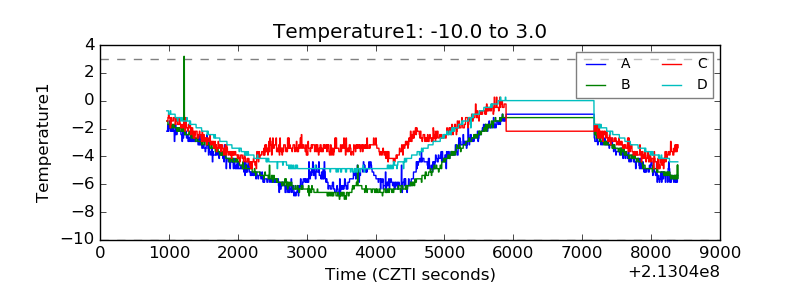 |
| Veto HV Monitor | 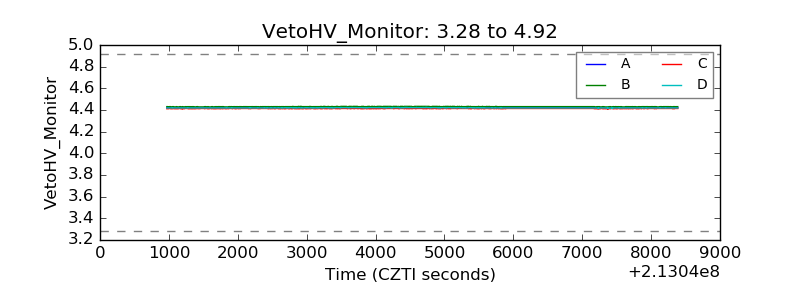 |
| Veto LLD | 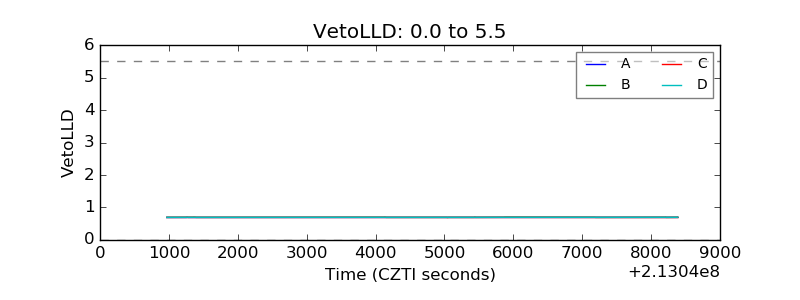 |
| Alpha Counter | 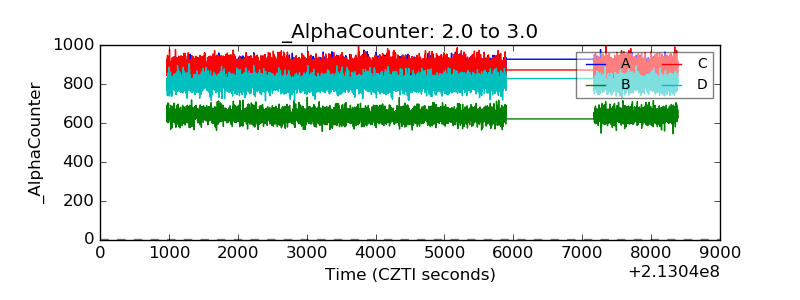 |
| _CPM_Rate | 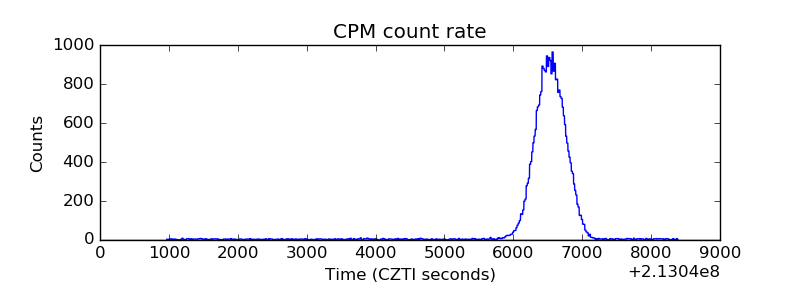 |
| CZT Counter | 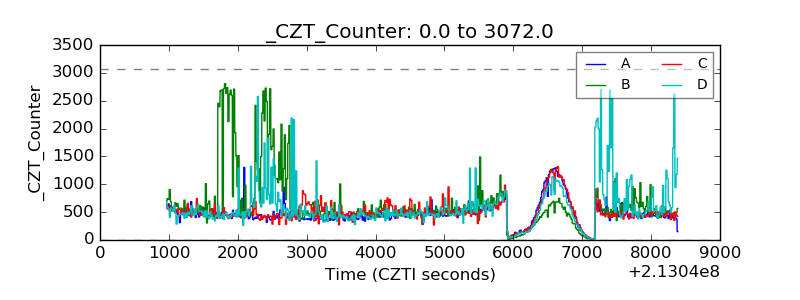 |
| +2.5 Volts monitor | 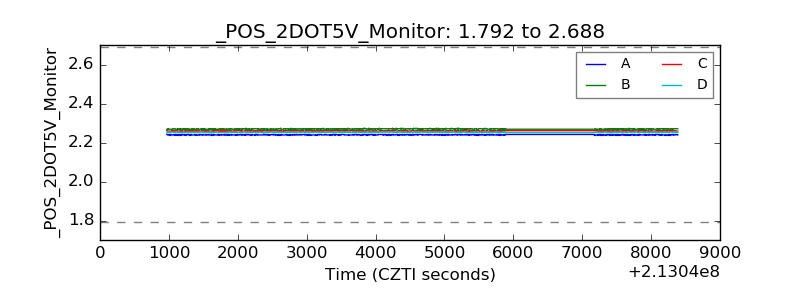 |
| +5 Volts monitor |  |
| _ROLL_ROT | 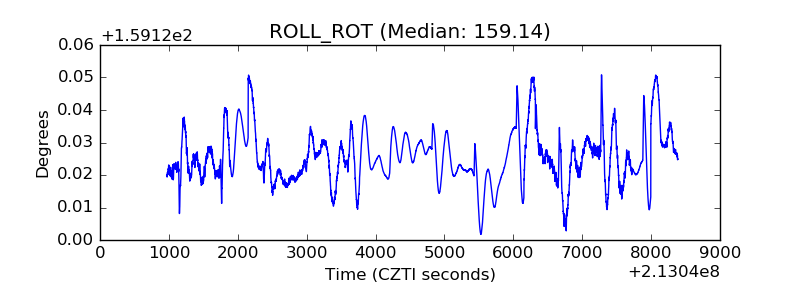 |
| _Roll_DEC |  |
| _Roll_RA | 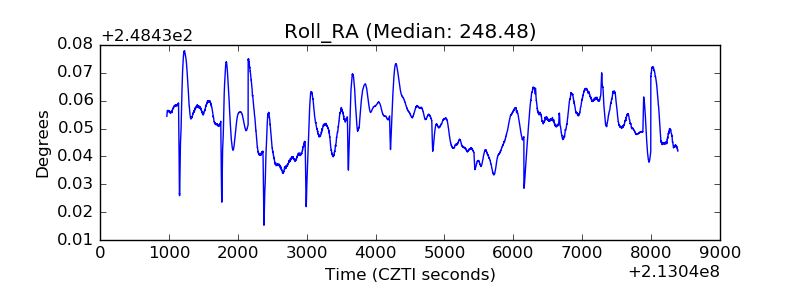 |
| Veto Counter | 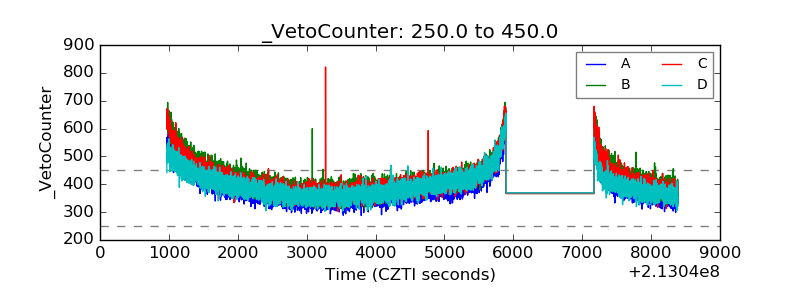 |