| Param | Original file | Final file |
|---|---|---|
| Filename | modeM0/AS1T01_138T01_9000000698_05473cztM0_level2.evt | modeM0/AS1T01_138T01_9000000698_05473cztM0_level2_quad_clean.evt |
| Size (bytes) | 522,743,040 | 69,851,520 |
| Size | 498.5 MB | 66.6 MB |
| Events in quadrant A | 2,909,576 | 431,962 |
| Events in quadrant B | 3,829,025 | 427,755 |
| Events in quadrant C | 2,893,632 | 434,340 |
| Events in quadrant D | 5,759,848 | 369,190 |
| Mode M9 | |||
|---|---|---|---|
| Quadrant | BADHDUFLAG | Total packets | Discarded packets |
| A | 0 | 13 | 0 |
| B | 0 | 13 | 0 |
| C | 0 | 13 | 0 |
| D | 0 | 14 | 0 |
| Mode SS | |||
|---|---|---|---|
| Quadrant | BADHDUFLAG | Total packets | Discarded packets |
| A | 0 | 134 | 0 |
| B | 0 | 134 | 0 |
| C | 0 | 134 | 0 |
| D | 0 | 134 | 0 |
| Mode M0 | |||
|---|---|---|---|
| Quadrant | BADHDUFLAG | Total packets | Discarded packets |
| A | 0 | 13249 | 3 |
| B | 0 | 15789 | 2 |
| C | 0 | 13126 | 2 |
| D | 0 | 21568 | 2 |
| Quadrant | Total seconds | Saturated seconds | Saturation percentage |
|---|---|---|---|
| A | 6461 | 19 | 0.294072% |
| B | 6461 | 108 | 1.671568% |
| C | 6461 | 9 | 0.139297% |
| D | 6461 | 907 | 14.038075% |
Noise dominated data is calculated using 1-second bins in cleaned event files. If a bin has >2000 counts, and if more than 50% of those come from <1% of pixels, then it is considered to be noise-dominated and hence unusable.
| Quadrant | # 1 sec bins | Bins with >0 counts | Bins with >2000 counts | High rate bins dominated by noise | Noise dominated (total time) | Noise dominated (detector-on time) | Marked lightcurve |
|---|---|---|---|---|---|---|---|
| A | 7526 | 6462 | 2 | 2 | 0.03% | 0.03% | 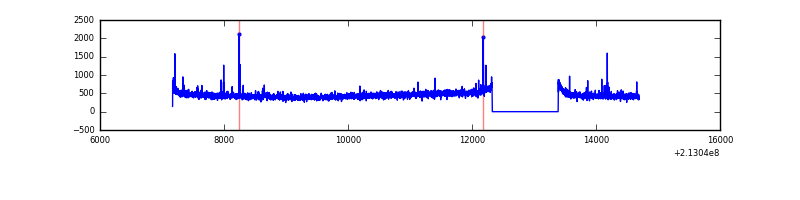 |
| B | 7526 | 6462 | 39 | 39 | 0.52% | 0.60% | 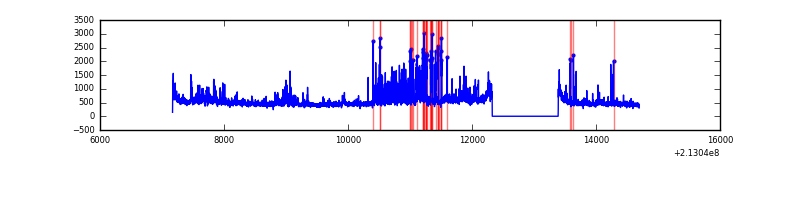 |
| C | 7526 | 6462 | 0 | 0 | 0.00% | 0.00% | 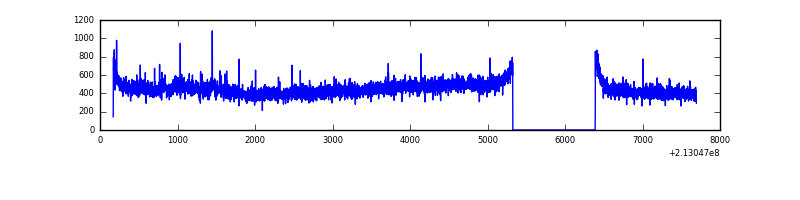 |
| D | 7526 | 6462 | 818 | 818 | 10.87% | 12.66% | 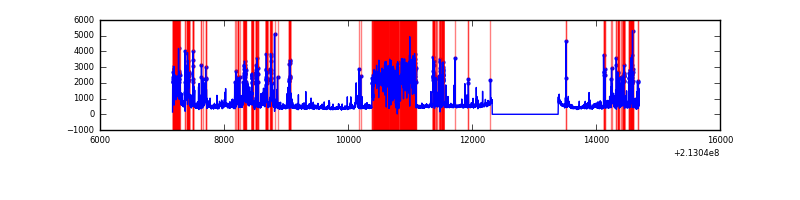 |
Top three noisy pixels from each quadrant. If the there are fewer than three noisy pixels in the level2.evt file, extra rows are filled as -1
| Pixel properties | Quadrant properties | ||||||
|---|---|---|---|---|---|---|---|
| Quadrant | DetID | PixID | Counts | Sigma | Mean | Median | Sigma |
| A | 0 | 50 | 18933 | 120.19 | 740 | 724 | 151.5 |
| A | 15 | 174 | 13936 | 87.2 | 740 | 724 | 151.5 |
| A | 13 | 6 | 10947 | 67.48 | 740 | 724 | 151.5 |
| B | 7 | 221 | 464456 | 3217.16 | 747 | 730 | 144.1 |
| B | 15 | 204 | 273899 | 1895.14 | 747 | 730 | 144.1 |
| B | 11 | 51 | 54860 | 375.53 | 747 | 730 | 144.1 |
| C | 9 | 247 | 89103 | 536.49 | 715 | 719 | 164.7 |
| C | 12 | 4 | 9899 | 55.72 | 715 | 719 | 164.7 |
| C | 13 | 61 | 5765 | 30.63 | 715 | 719 | 164.7 |
| D | 2 | 33 | 2810348 | 17107.21 | 661 | 640 | 164.2 |
| D | 8 | 195 | 103088 | 623.77 | 661 | 640 | 164.2 |
| D | 5 | 81 | 87999 | 531.89 | 661 | 640 | 164.2 |
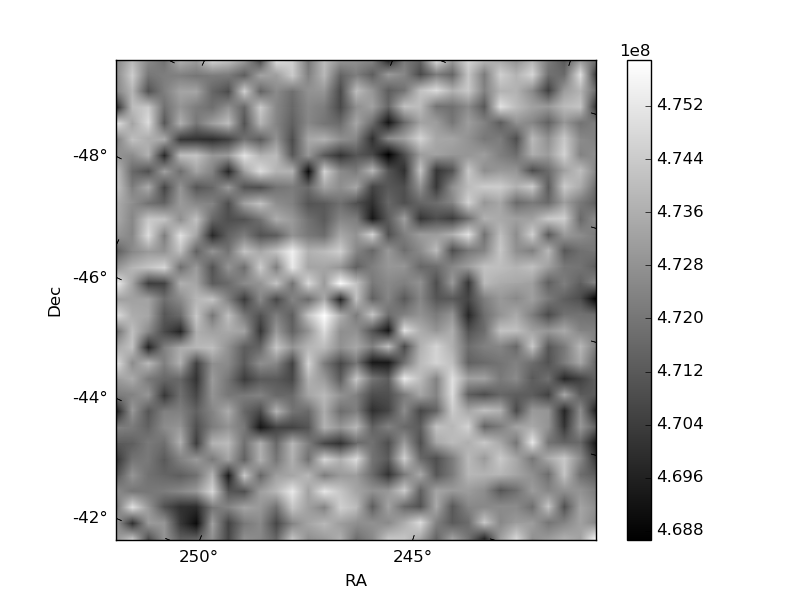
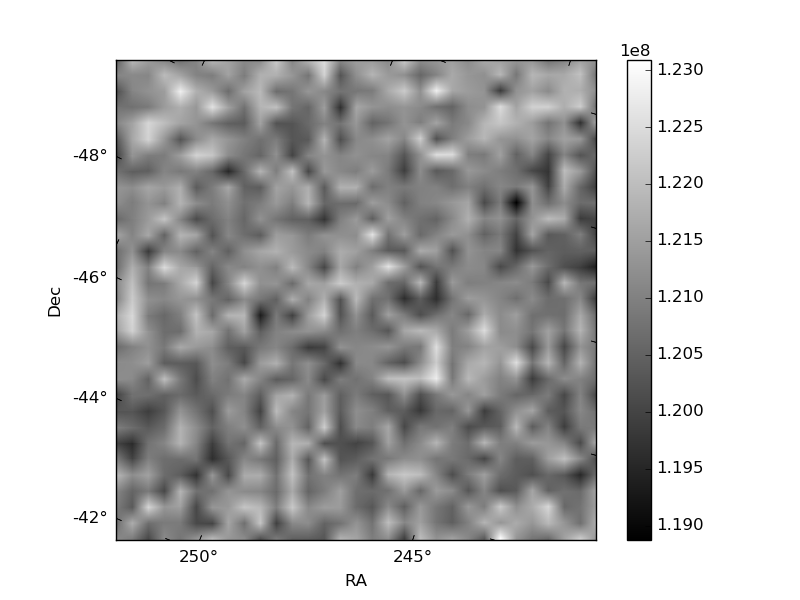
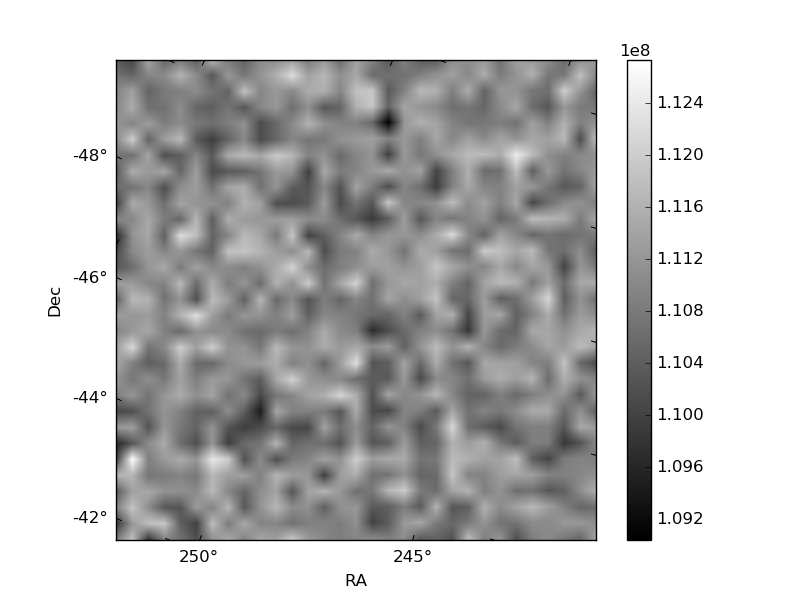
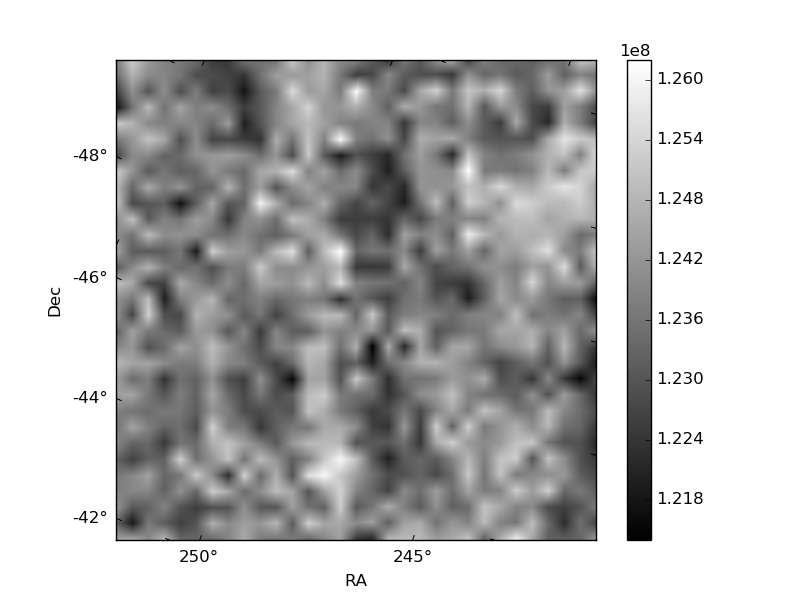
Histogram calculated using DETX and DETY for each event in the final _common_clean file
| Quadrant A | 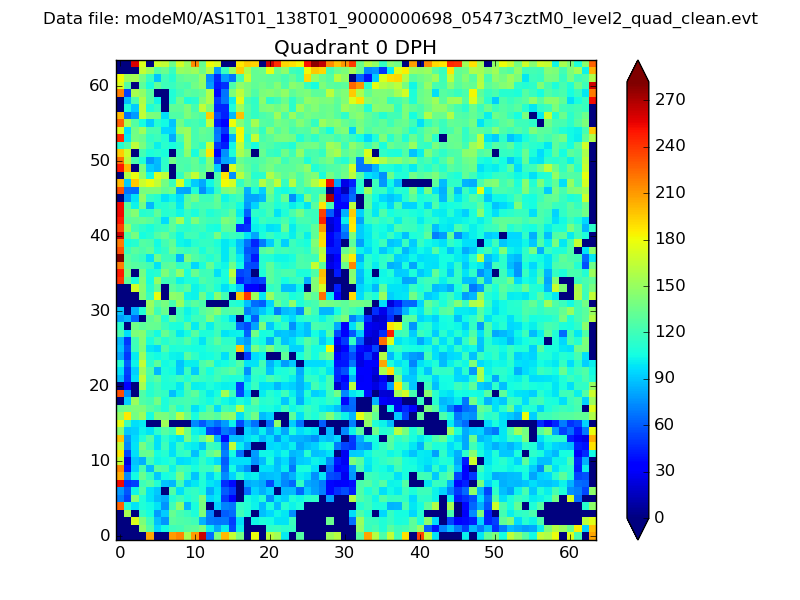 |
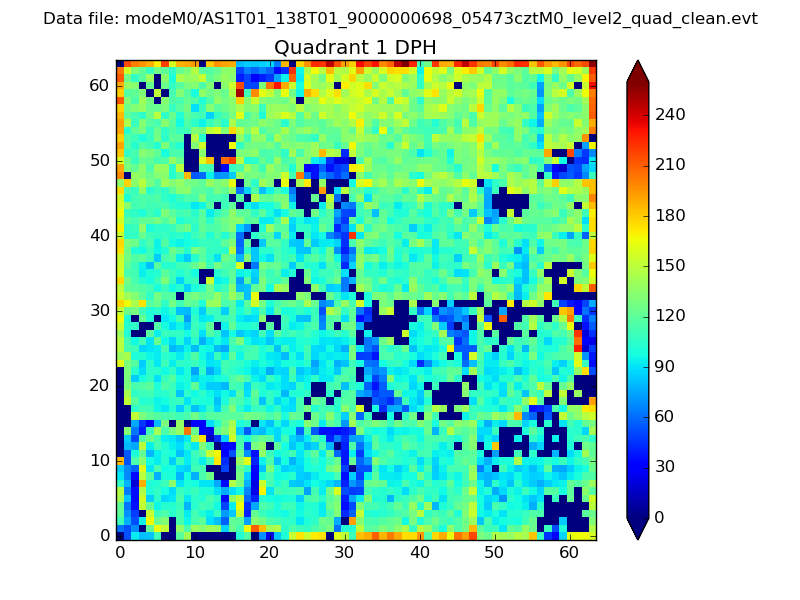 |
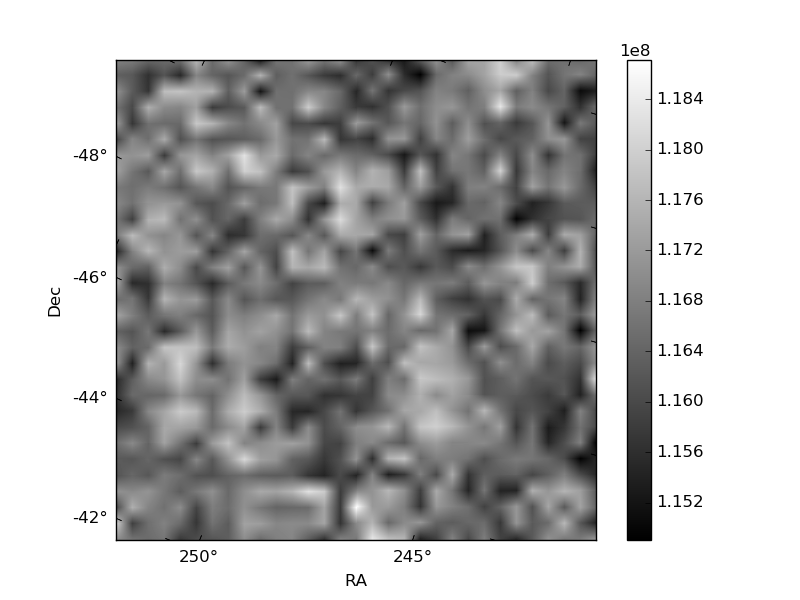
Quadrant B |
|---|---|---|---|
| Quadrant D | 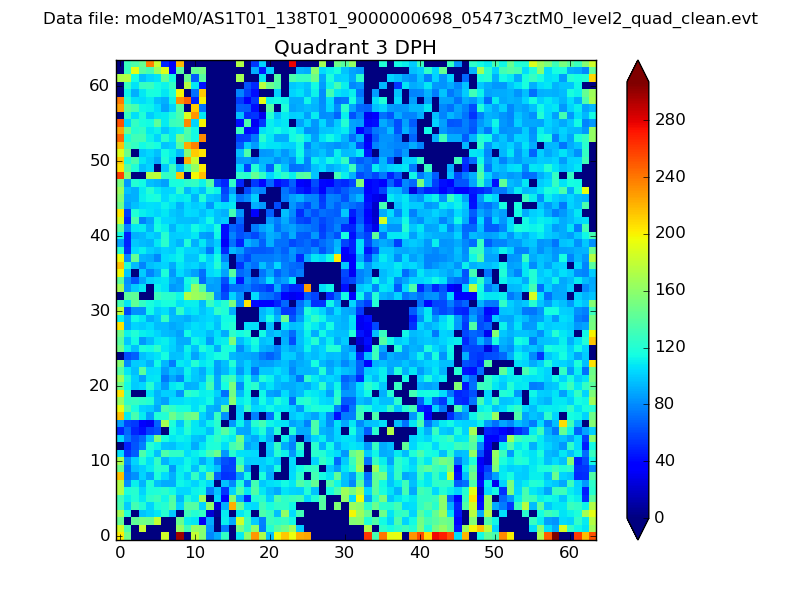 |
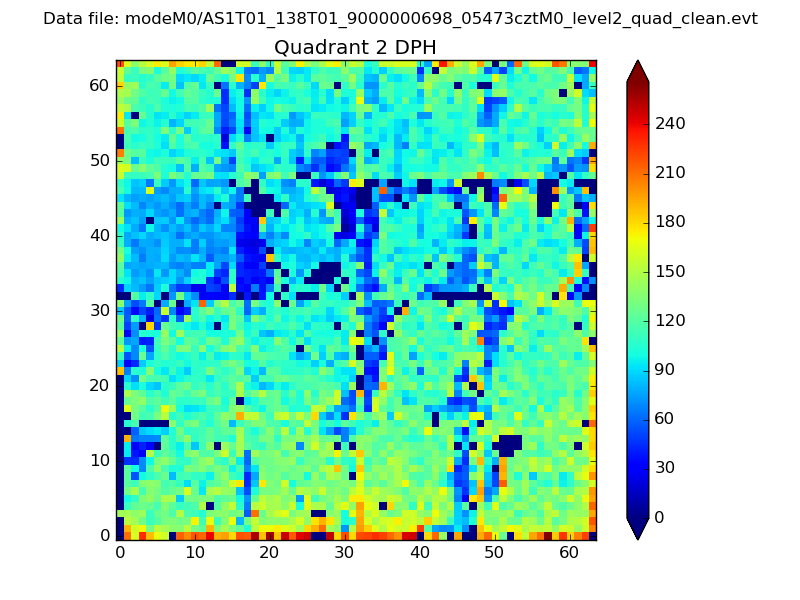 |
Quadrant C |
| Plot type | Count rate plots | Images |
|---|---|---|
| Comparison with Poisson distribution Blue bars denote a histogram of data divided into 1 sec bins. Red curve is a Poisson curve with rate = median count rate of data. |
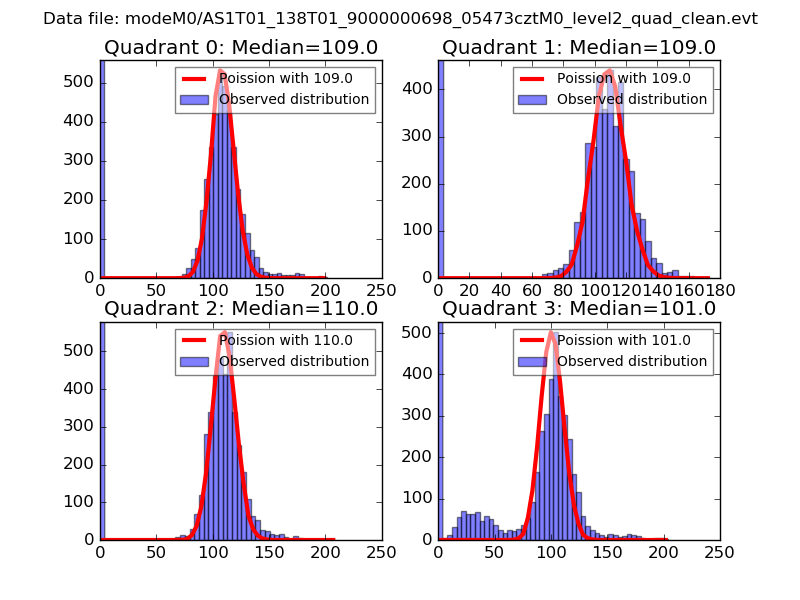 |
 |
| Quadrant-wise count rates Data is divided into 100 sec bins |
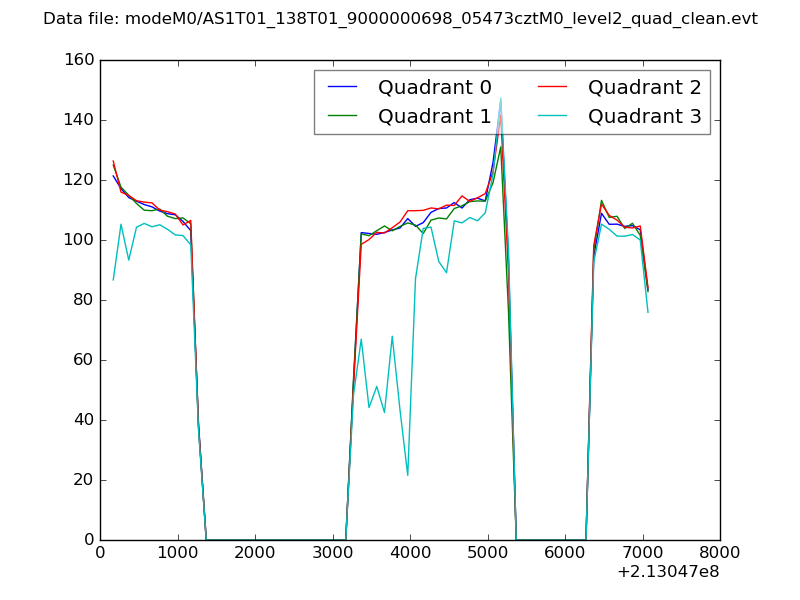 |
|
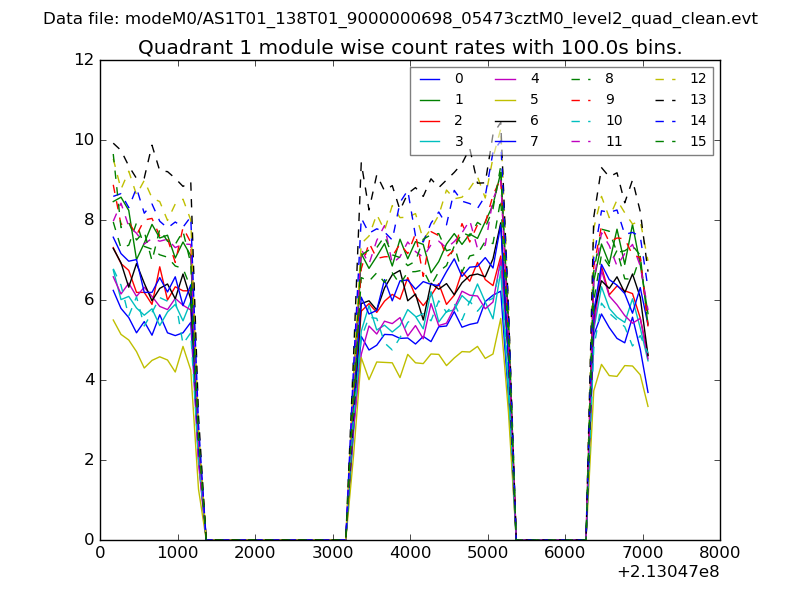
| Module-wise count rates for Quadrant A Data is divided into 100 sec bins |
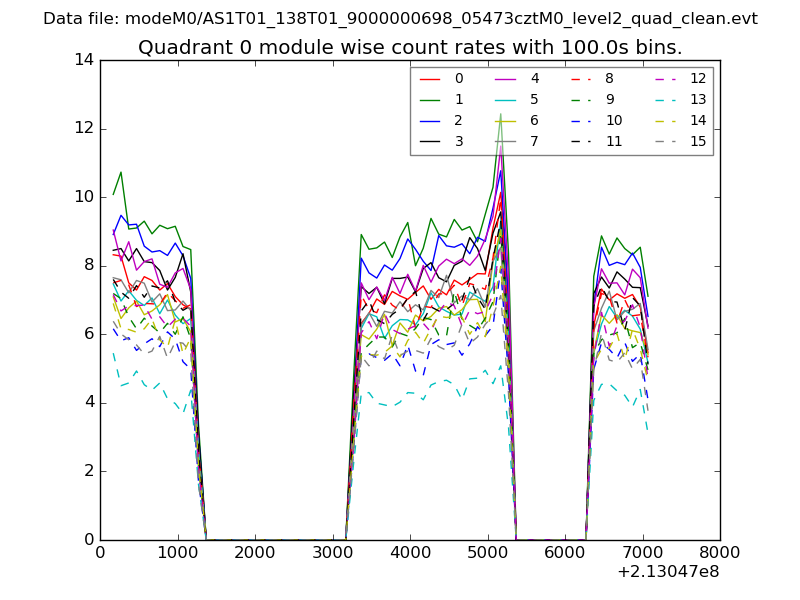 |
 |
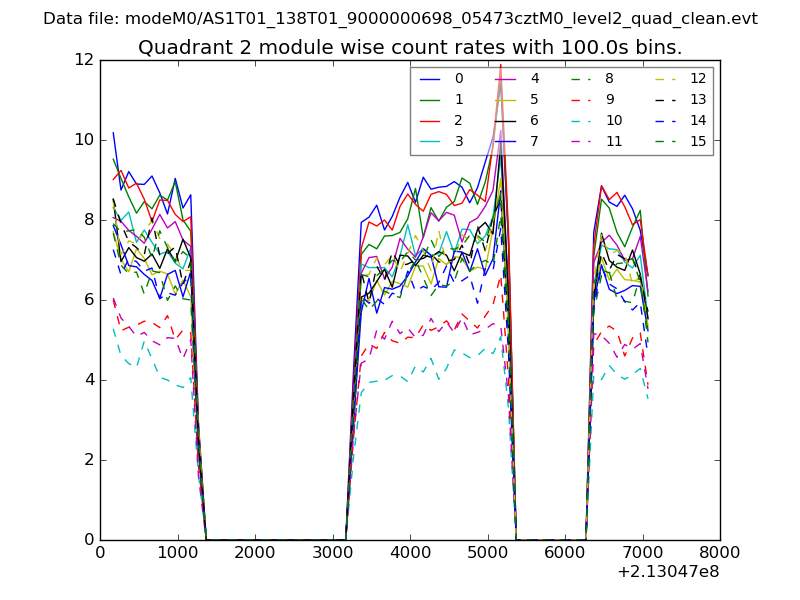
| Module-wise count rates for Quadrant B Data is divided into 100 sec bins |
 |
 |
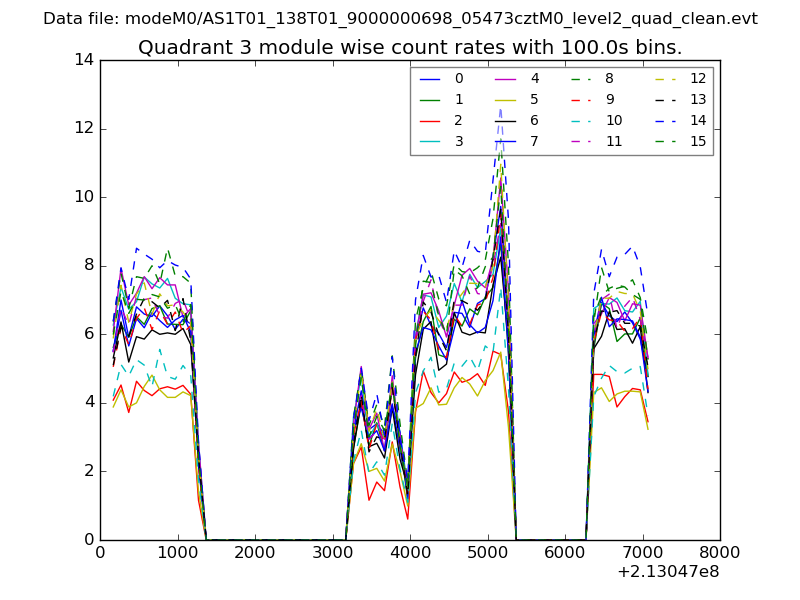
| Module-wise count rates for Quadrant C Data is divided into 100 sec bins |
 |
 |
| Module-wise count rates for Quadrant D Data is divided into 100 sec bins |
 |
 |
| Parameter | Plot |
|---|---|
| CZT HV Monitor | 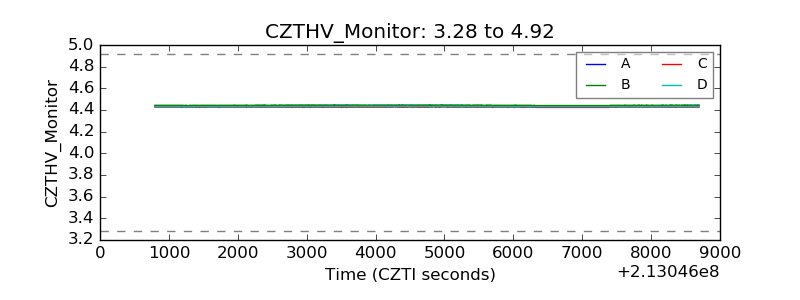 |
| D_VDD | 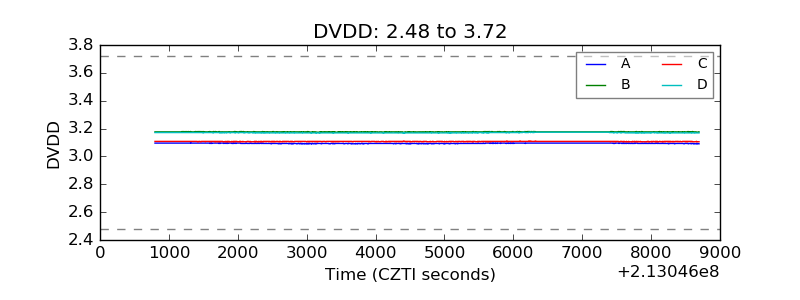 |
| Temperature 1 | 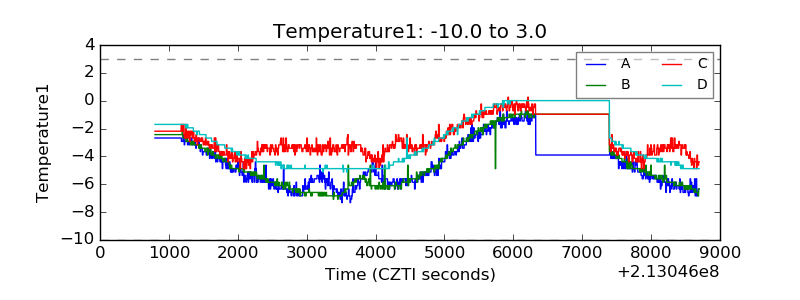 |
| Veto HV Monitor | 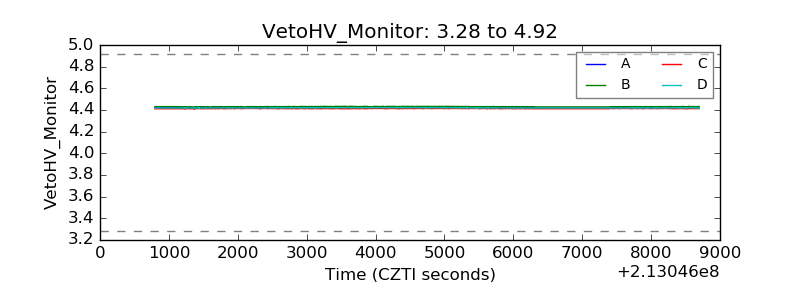 |
| Veto LLD | 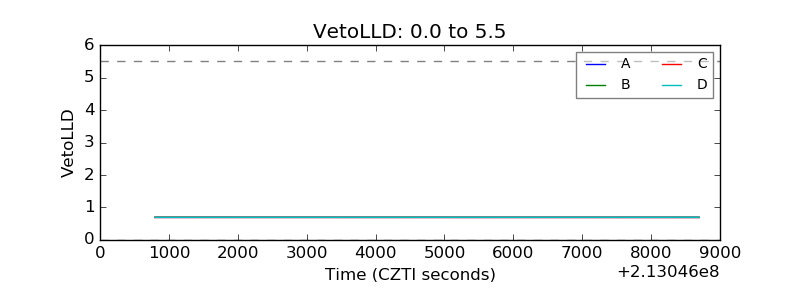 |
| Alpha Counter | 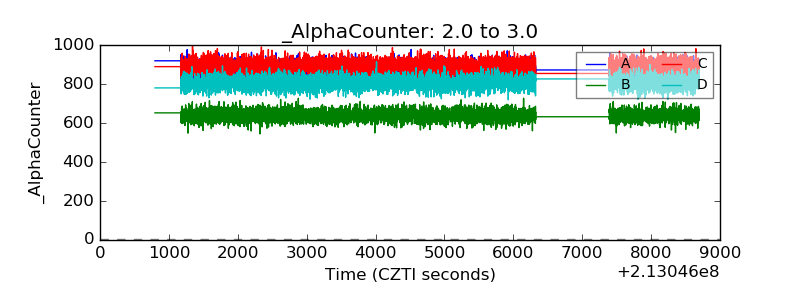 |
| _CPM_Rate | 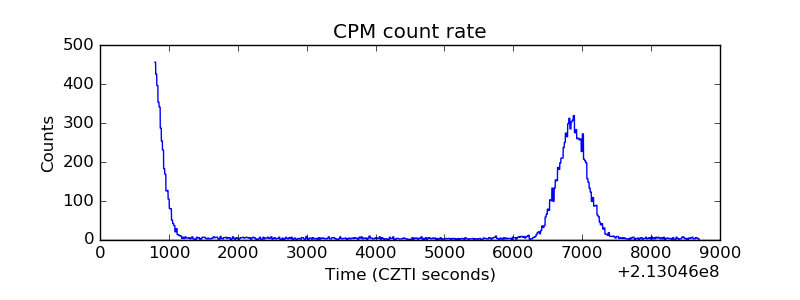 |
| CZT Counter | 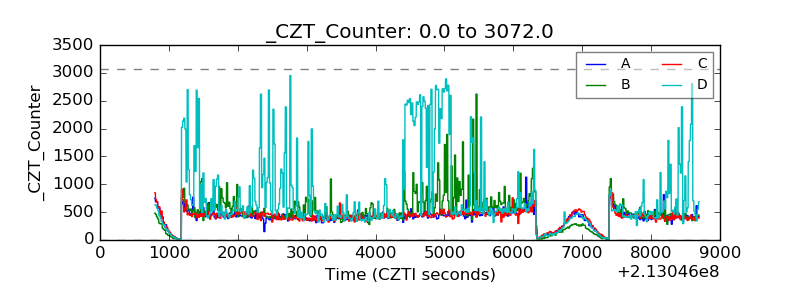 |
| +2.5 Volts monitor |  |
| +5 Volts monitor |  |
| _ROLL_ROT | 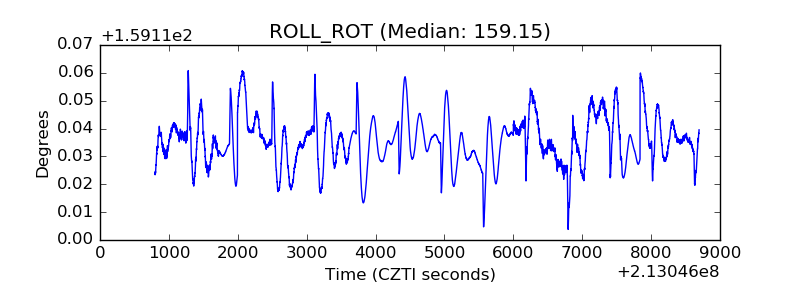 |
| _Roll_DEC | 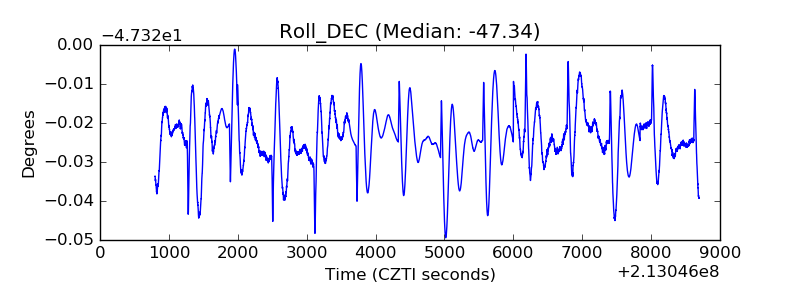 |
| _Roll_RA | 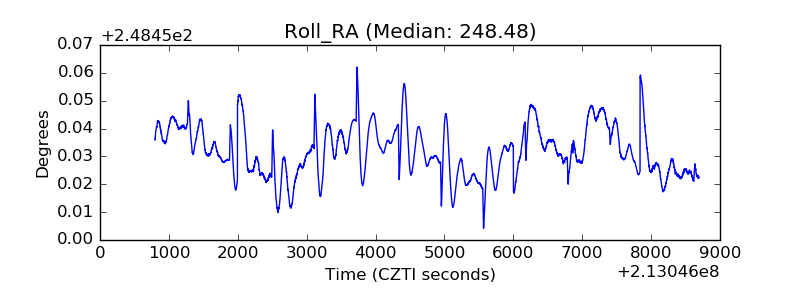 |
| Veto Counter | 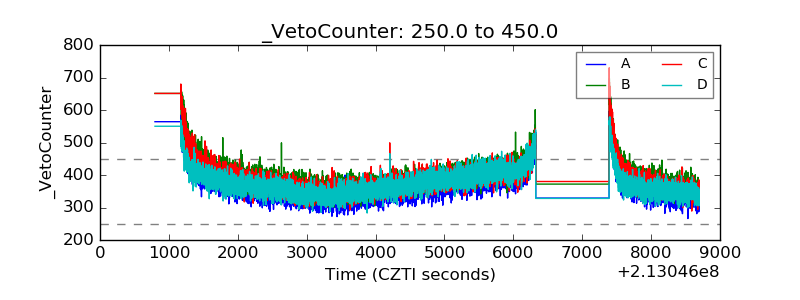 |