| Param | Original file | Final file |
|---|---|---|
| Filename | modeM0/AS1T01_138T01_9000000698_05474cztM0_level2.evt | modeM0/AS1T01_138T01_9000000698_05474cztM0_level2_quad_clean.evt |
| Size (bytes) | 512,182,080 | 74,067,840 |
| Size | 488.5 MB | 70.6 MB |
| Events in quadrant A | 3,301,211 | 444,627 |
| Events in quadrant B | 3,708,206 | 442,286 |
| Events in quadrant C | 3,142,372 | 450,654 |
| Events in quadrant D | 4,872,818 | 405,962 |
| Mode M9 | |||
|---|---|---|---|
| Quadrant | BADHDUFLAG | Total packets | Discarded packets |
| A | 0 | 16 | 0 |
| B | 0 | 16 | 0 |
| C | 0 | 16 | 0 |
| D | 0 | 16 | 0 |
| Mode SS | |||
|---|---|---|---|
| Quadrant | BADHDUFLAG | Total packets | Discarded packets |
| A | 0 | 148 | 0 |
| B | 0 | 148 | 0 |
| C | 0 | 148 | 0 |
| D | 0 | 148 | 0 |
| Mode M0 | |||
|---|---|---|---|
| Quadrant | BADHDUFLAG | Total packets | Discarded packets |
| A | 0 | 15040 | 3 |
| B | 0 | 15912 | 2 |
| C | 0 | 14714 | 2 |
| D | 0 | 19625 | 2 |
| Quadrant | Total seconds | Saturated seconds | Saturation percentage |
|---|---|---|---|
| A | 7162 | 85 | 1.186819% |
| B | 7162 | 125 | 1.745323% |
| C | 7162 | 46 | 0.642279% |
| D | 7162 | 579 | 8.084334% |
Noise dominated data is calculated using 1-second bins in cleaned event files. If a bin has >2000 counts, and if more than 50% of those come from <1% of pixels, then it is considered to be noise-dominated and hence unusable.
| Quadrant | # 1 sec bins | Bins with >0 counts | Bins with >2000 counts | High rate bins dominated by noise | Noise dominated (total time) | Noise dominated (detector-on time) | Marked lightcurve |
|---|---|---|---|---|---|---|---|
| A | 8867 | 7164 | 14 | 14 | 0.16% | 0.20% | 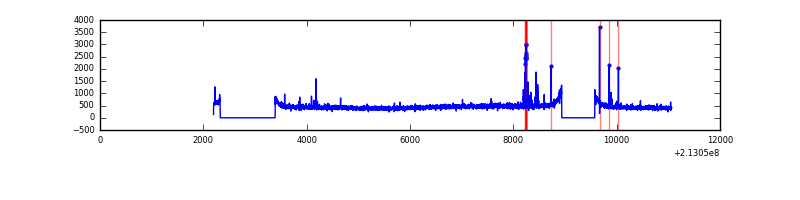 |
| B | 8867 | 7164 | 10 | 10 | 0.11% | 0.14% | 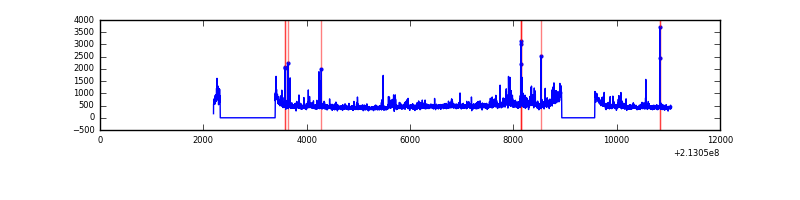 |
| C | 8867 | 7164 | 0 | 0 | 0.00% | 0.00% | 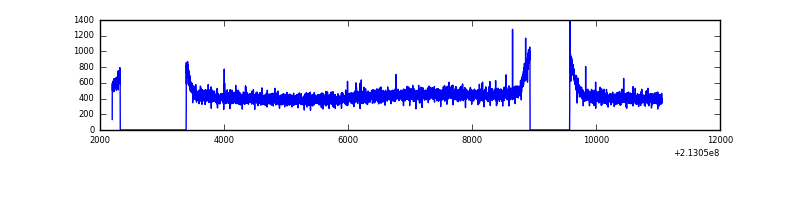 |
| D | 8867 | 7164 | 421 | 421 | 4.75% | 5.88% | 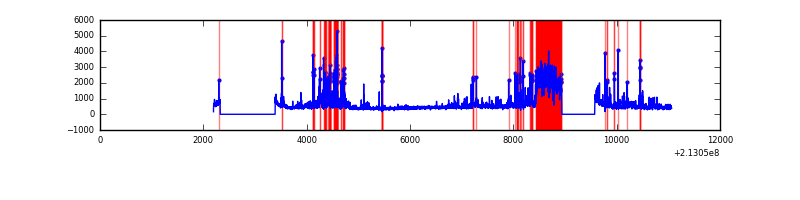 |
Top three noisy pixels from each quadrant. If the there are fewer than three noisy pixels in the level2.evt file, extra rows are filled as -1
| Pixel properties | Quadrant properties | ||||||
|---|---|---|---|---|---|---|---|
| Quadrant | DetID | PixID | Counts | Sigma | Mean | Median | Sigma |
| A | 15 | 174 | 62222 | 361.24 | 827 | 809 | 170.0 |
| A | 0 | 50 | 49290 | 285.17 | 827 | 809 | 170.0 |
| A | 0 | 226 | 8129 | 43.06 | 827 | 809 | 170.0 |
| B | 15 | 204 | 270320 | 1672.82 | 836 | 815 | 161.1 |
| B | 4 | 48 | 47837 | 291.87 | 836 | 815 | 161.1 |
| B | 11 | 51 | 38497 | 233.89 | 836 | 815 | 161.1 |
| C | 13 | 61 | 6512 | 30.54 | 802 | 807 | 186.8 |
| C | 12 | 4 | 4330 | 18.86 | 802 | 807 | 186.8 |
| C | 8 | 222 | 3678 | 15.37 | 802 | 807 | 186.8 |
| D | 2 | 152 | 919732 | 4796.26 | 770 | 746 | 191.6 |
| D | 2 | 33 | 763155 | 3979.07 | 770 | 746 | 191.6 |
| D | 8 | 195 | 63205 | 325.98 | 770 | 746 | 191.6 |
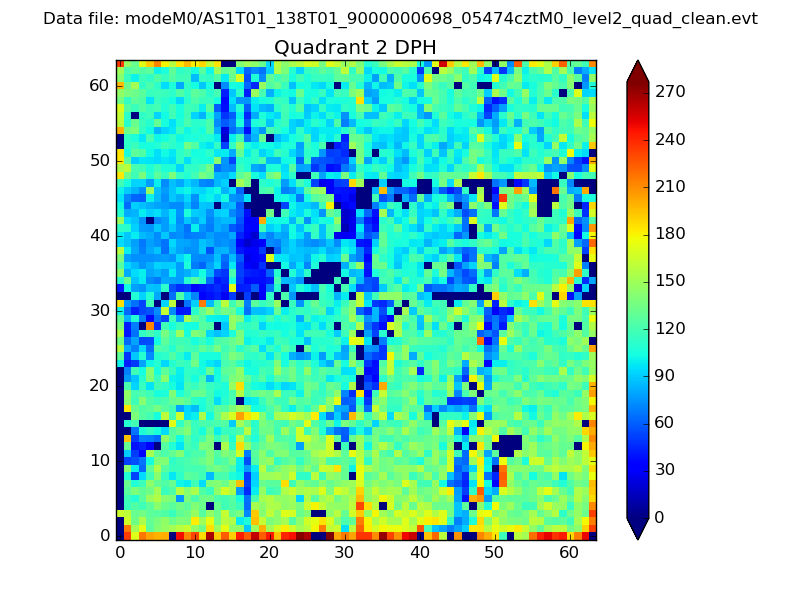
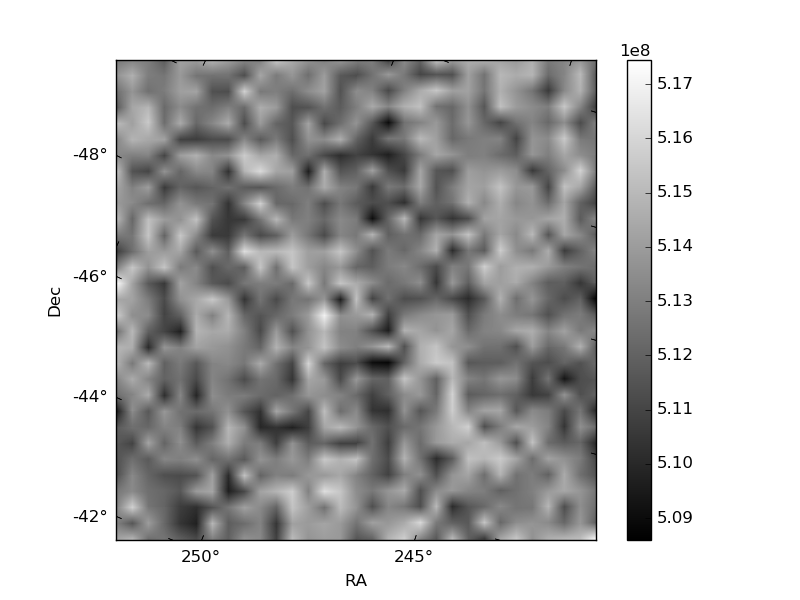
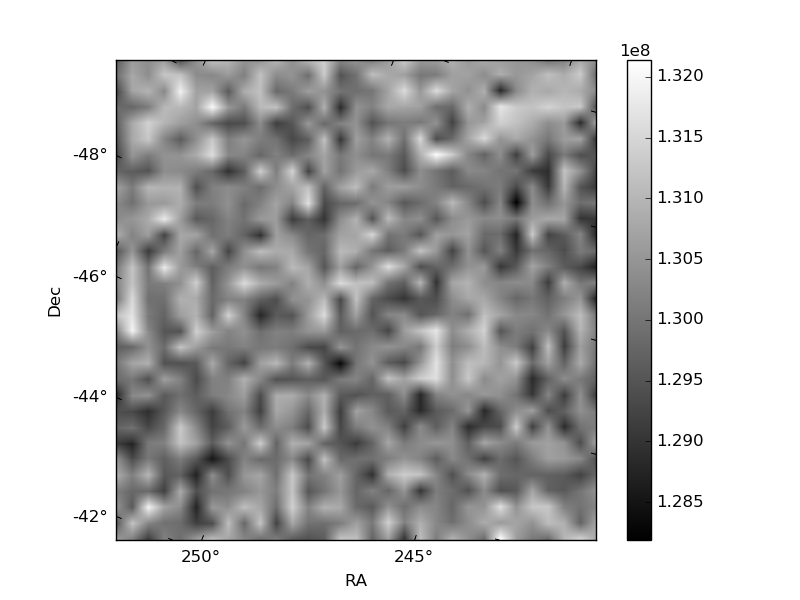
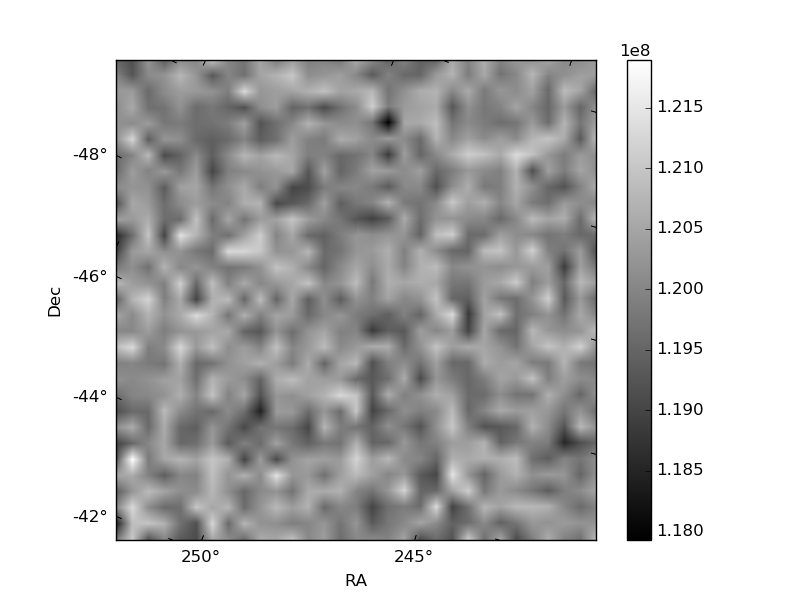
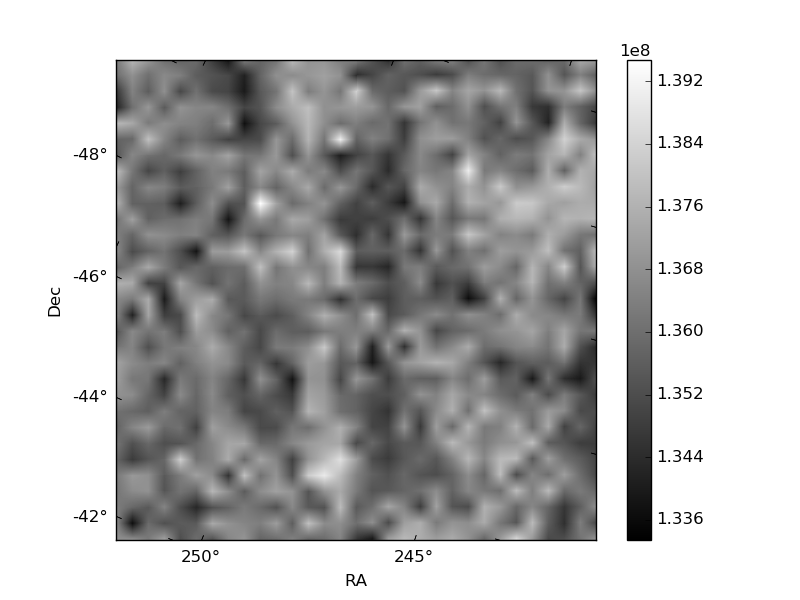
Histogram calculated using DETX and DETY for each event in the final _common_clean file
| Quadrant A | 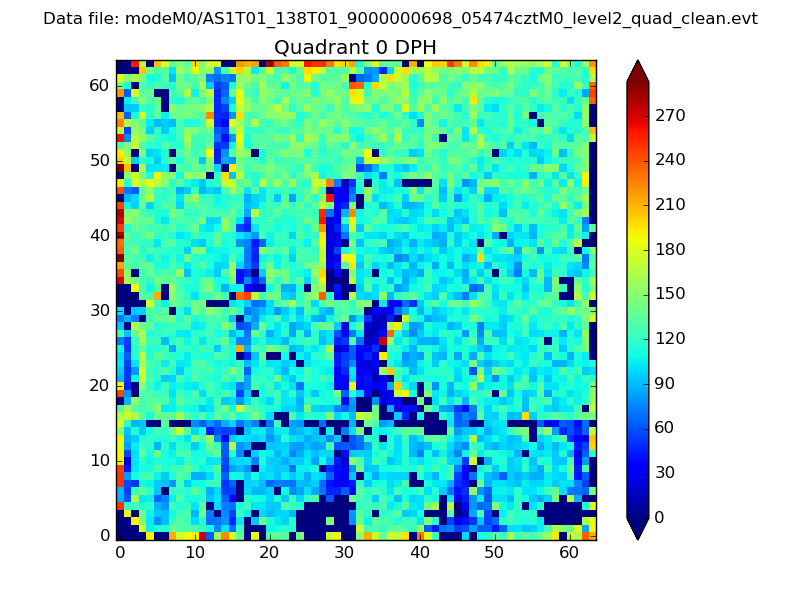 |
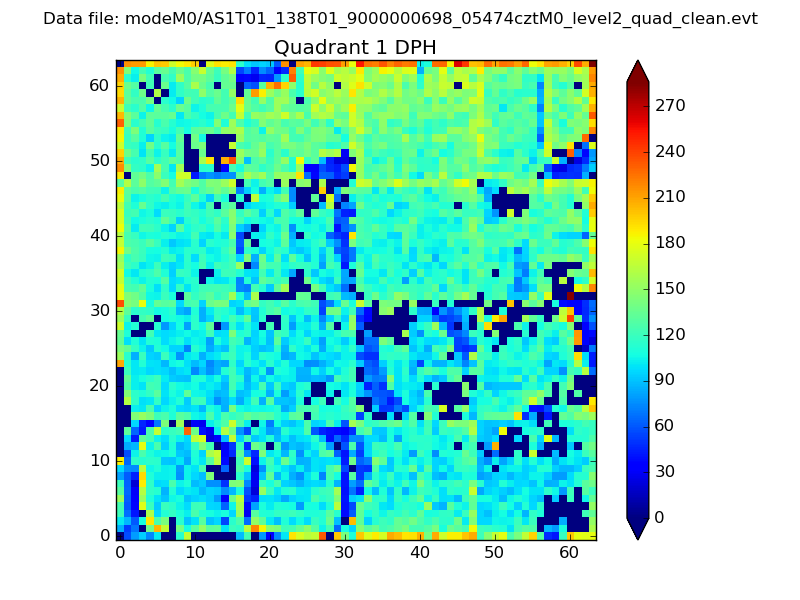 |
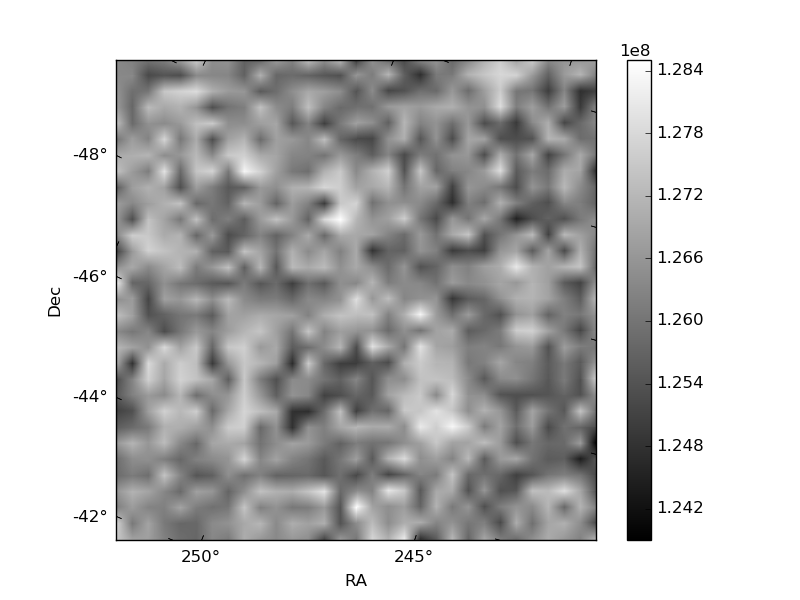
Quadrant B |
|---|---|---|---|
| Quadrant D | 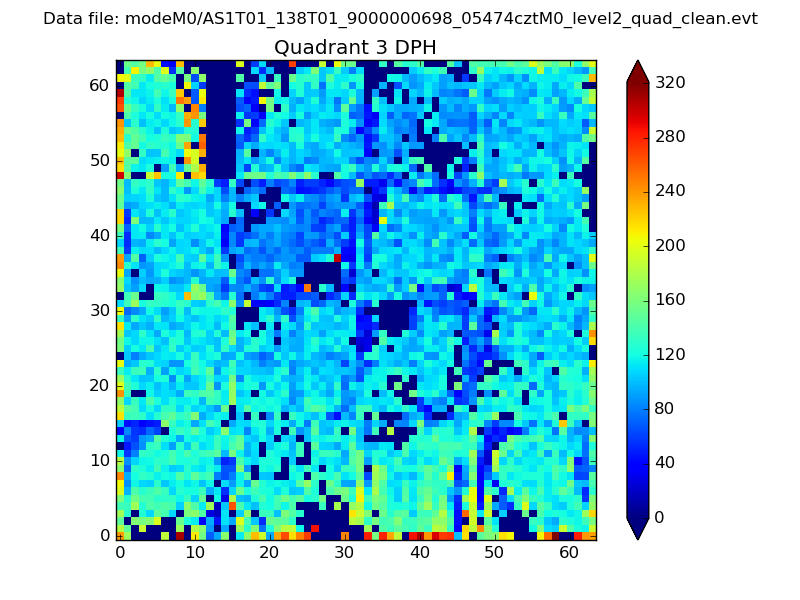 |
 |
Quadrant C |
| Plot type | Count rate plots | Images |
|---|---|---|
| Comparison with Poisson distribution Blue bars denote a histogram of data divided into 1 sec bins. Red curve is a Poisson curve with rate = median count rate of data. |
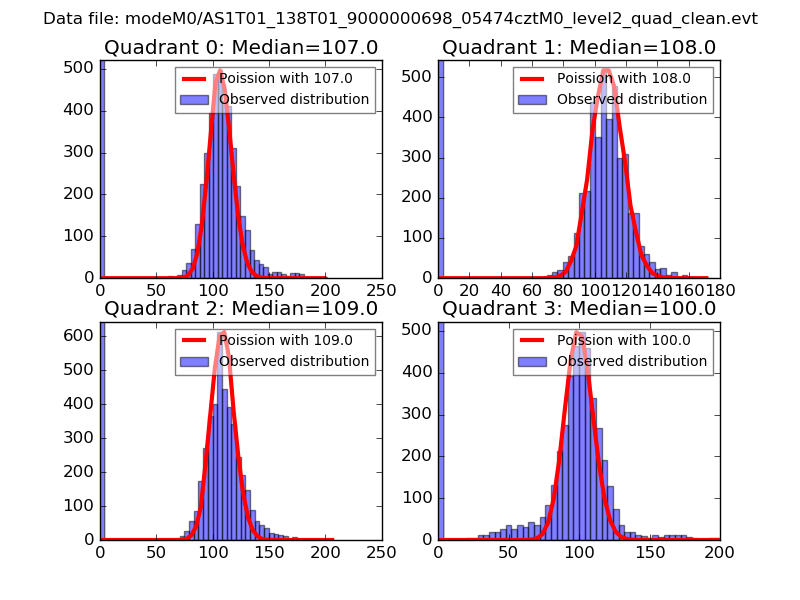 |
 |
| Quadrant-wise count rates Data is divided into 100 sec bins |
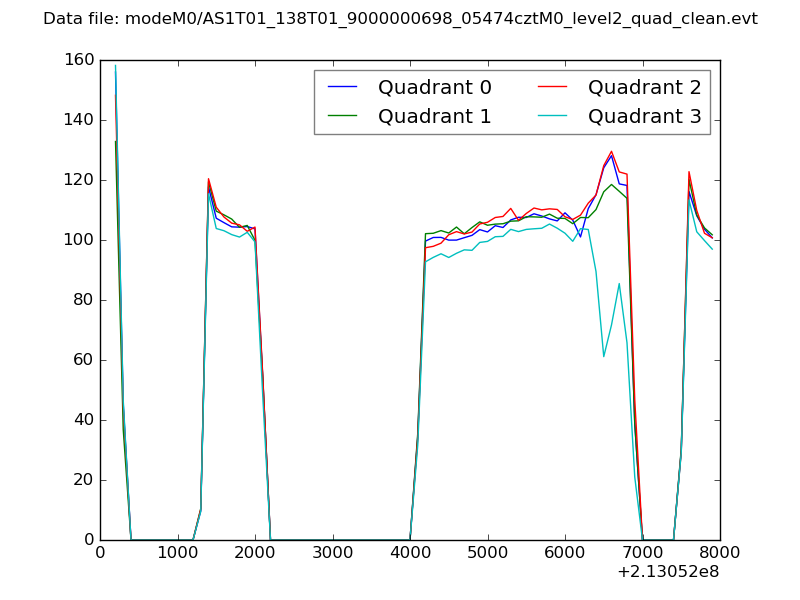 |
|
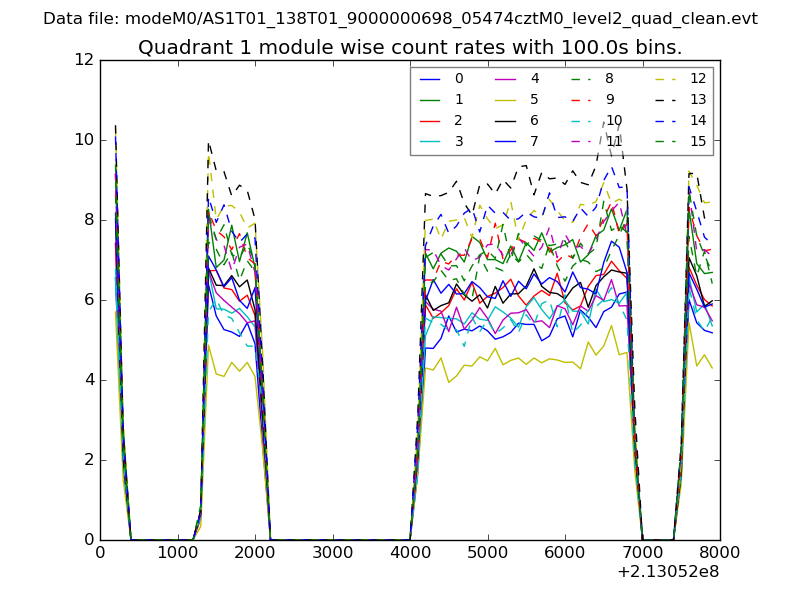
| Module-wise count rates for Quadrant A Data is divided into 100 sec bins |
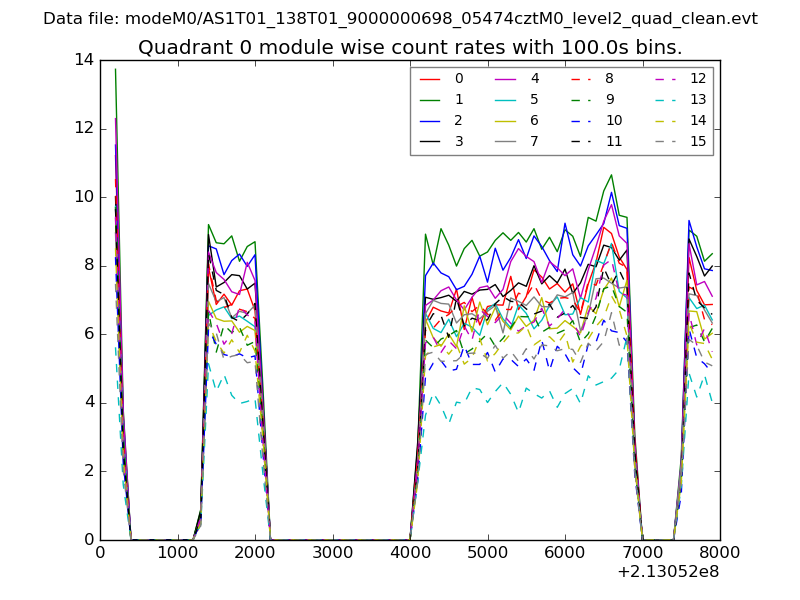 |
 |
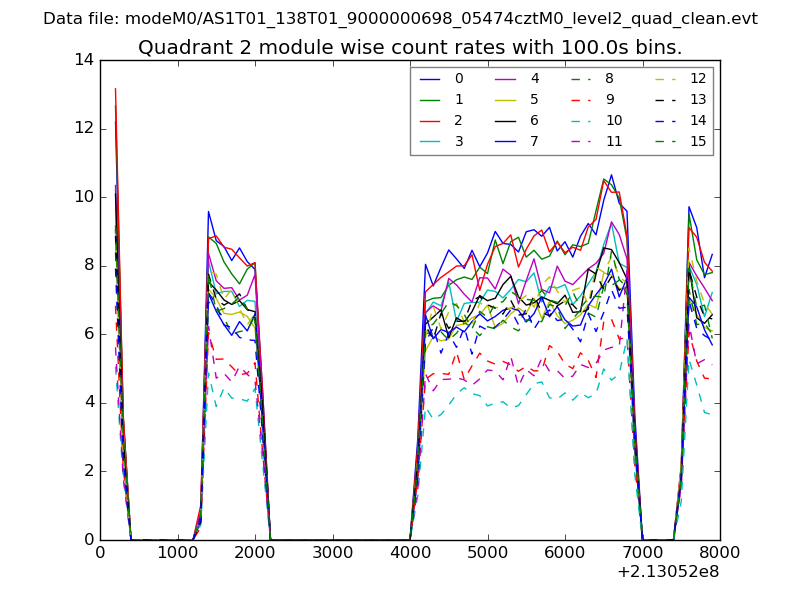
| Module-wise count rates for Quadrant B Data is divided into 100 sec bins |
 |
 |
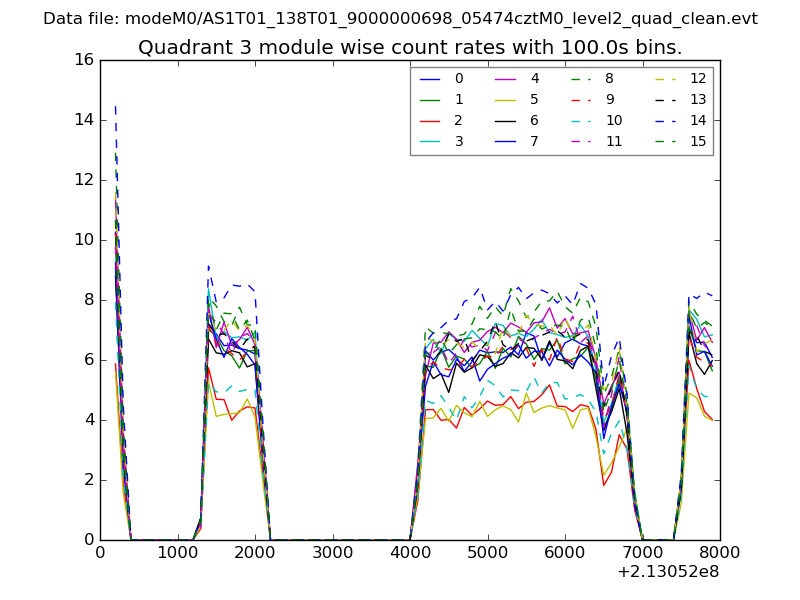
| Module-wise count rates for Quadrant C Data is divided into 100 sec bins |
 |
 |
| Module-wise count rates for Quadrant D Data is divided into 100 sec bins |
 |
 |
| Parameter | Plot |
|---|---|
| CZT HV Monitor | 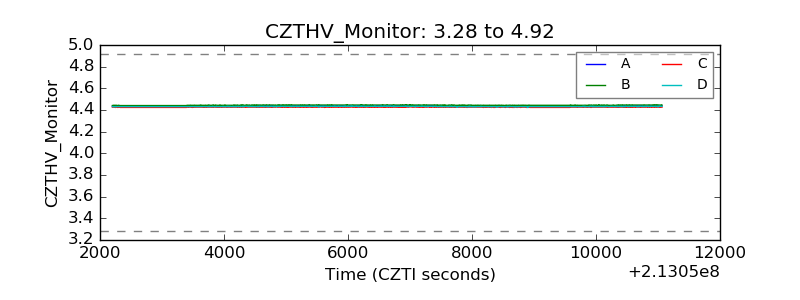 |
| D_VDD | 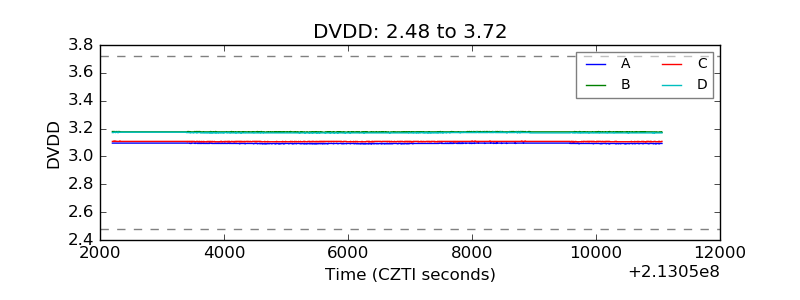 |
| Temperature 1 | 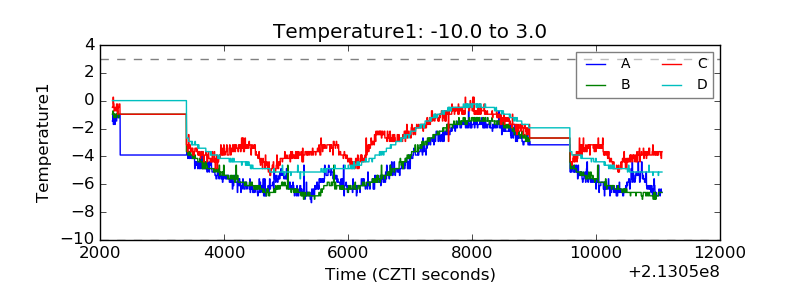 |
| Veto HV Monitor | 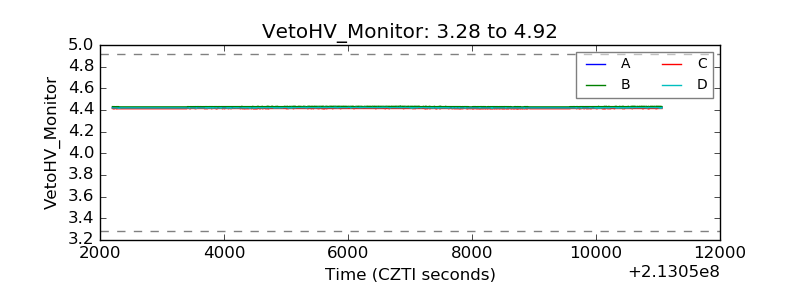 |
| Veto LLD | 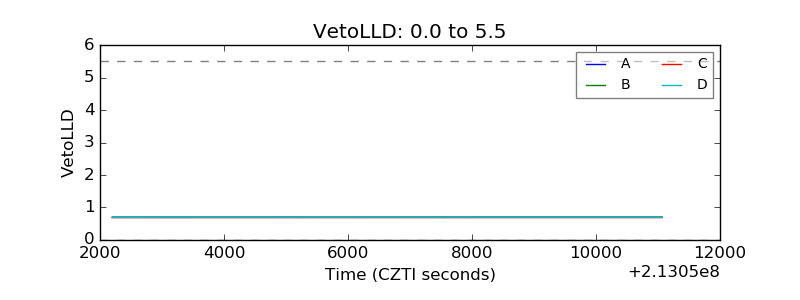 |
| Alpha Counter | 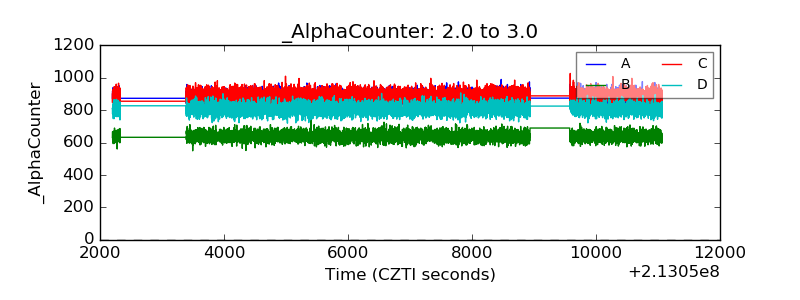 |
| _CPM_Rate | 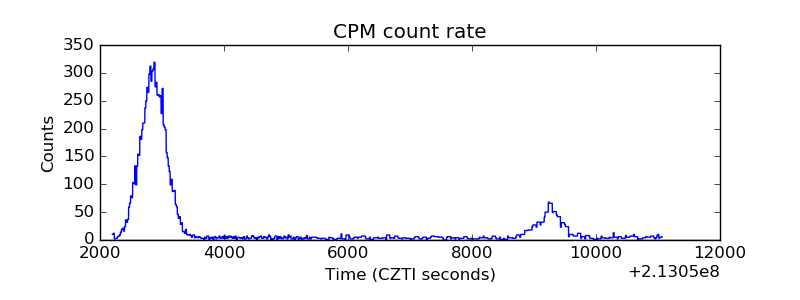 |
| CZT Counter | 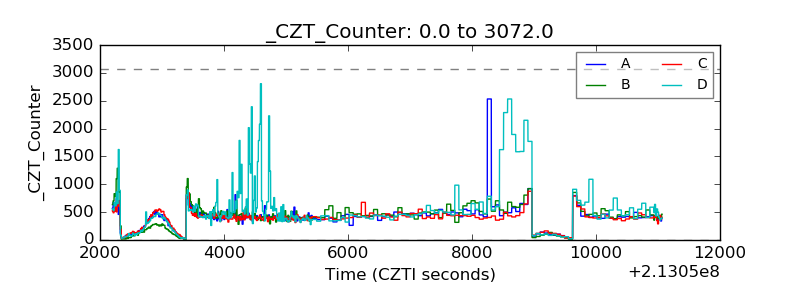 |
| +2.5 Volts monitor |  |
| +5 Volts monitor |  |
| _ROLL_ROT | 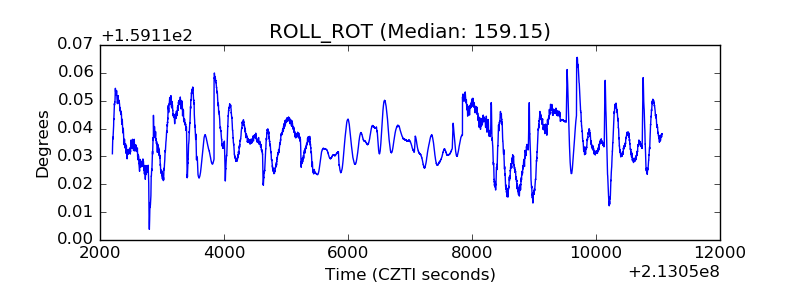 |
| _Roll_DEC | 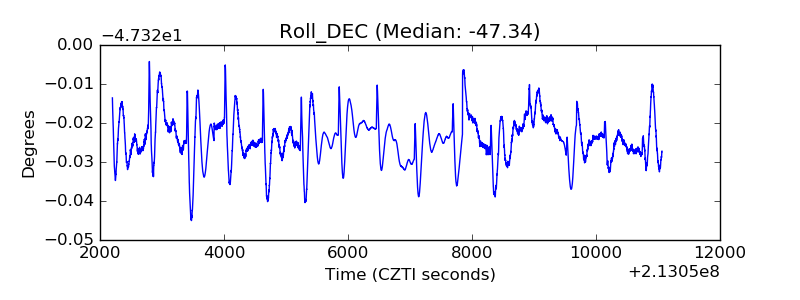 |
| _Roll_RA | 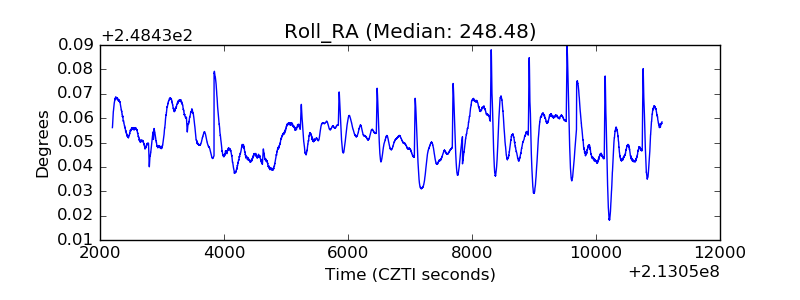 |
| Veto Counter | 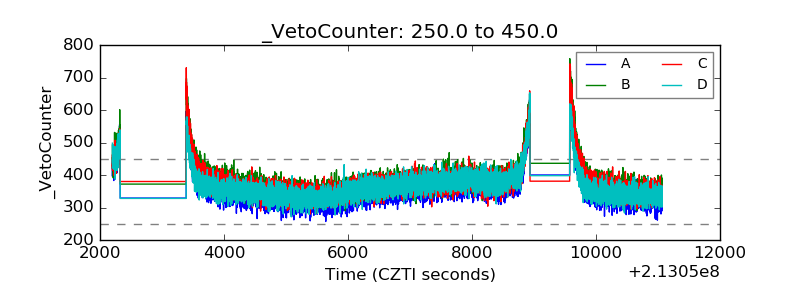 |