| Param | Original file | Final file |
|---|---|---|
| Filename | modeM0/AS1T01_138T01_9000000698_05476cztM0_level2.evt | modeM0/AS1T01_138T01_9000000698_05476cztM0_level2_quad_clean.evt |
| Size (bytes) | 600,770,880 | 83,390,400 |
| Size | 572.9 MB | 79.5 MB |
| Events in quadrant A | 4,246,164 | 481,904 |
| Events in quadrant B | 4,517,106 | 484,553 |
| Events in quadrant C | 4,016,624 | 489,020 |
| Events in quadrant D | 4,824,560 | 466,128 |
| Mode M9 | |||
|---|---|---|---|
| Quadrant | BADHDUFLAG | Total packets | Discarded packets |
| A | 0 | 4 | 0 |
| B | 0 | 4 | 0 |
| C | 0 | 4 | 0 |
| D | 0 | 4 | 0 |
| Mode SS | |||
|---|---|---|---|
| Quadrant | BADHDUFLAG | Total packets | Discarded packets |
| A | 0 | 176 | 0 |
| B | 0 | 176 | 0 |
| C | 0 | 176 | 0 |
| D | 0 | 176 | 0 |
| Mode M0 | |||
|---|---|---|---|
| Quadrant | BADHDUFLAG | Total packets | Discarded packets |
| A | 0 | 18883 | 4 |
| B | 0 | 19221 | 3 |
| C | 0 | 18345 | 3 |
| D | 0 | 20262 | 3 |
| Quadrant | Total seconds | Saturated seconds | Saturation percentage |
|---|---|---|---|
| A | 8697 | 278 | 3.196505% |
| B | 8697 | 284 | 3.265494% |
| C | 8697 | 239 | 2.748074% |
| D | 8697 | 275 | 3.162010% |
Noise dominated data is calculated using 1-second bins in cleaned event files. If a bin has >2000 counts, and if more than 50% of those come from <1% of pixels, then it is considered to be noise-dominated and hence unusable.
| Quadrant | # 1 sec bins | Bins with >0 counts | Bins with >2000 counts | High rate bins dominated by noise | Noise dominated (total time) | Noise dominated (detector-on time) | Marked lightcurve |
|---|---|---|---|---|---|---|---|
| A | 9027 | 8701 | 18 | 18 | 0.20% | 0.21% | 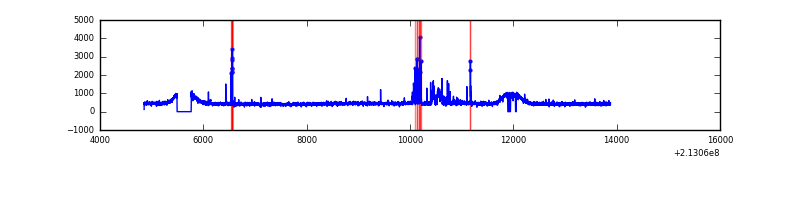 |
| B | 9027 | 8701 | 0 | 0 | 0.00% | 0.00% | 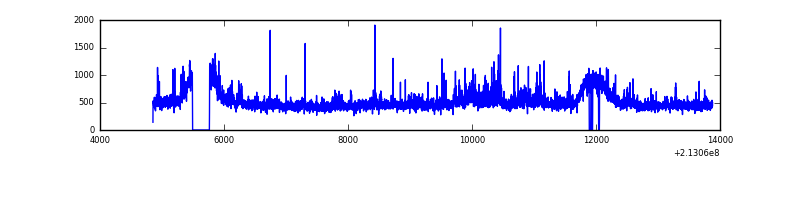 |
| C | 9027 | 8701 | 1 | 1 | 0.01% | 0.01% | 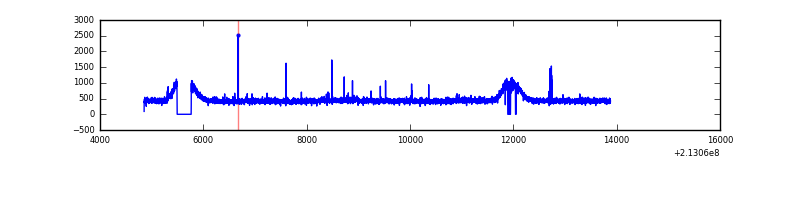 |
| D | 9027 | 8701 | 66 | 66 | 0.73% | 0.76% | 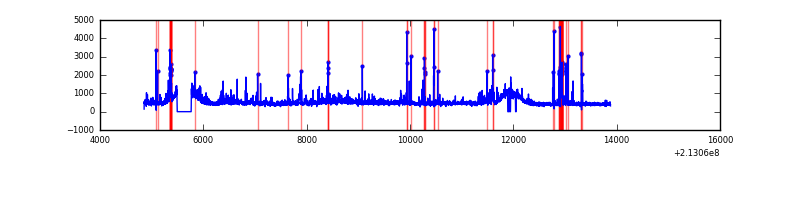 |
Top three noisy pixels from each quadrant. If the there are fewer than three noisy pixels in the level2.evt file, extra rows are filled as -1
| Pixel properties | Quadrant properties | ||||||
|---|---|---|---|---|---|---|---|
| Quadrant | DetID | PixID | Counts | Sigma | Mean | Median | Sigma |
| A | 15 | 174 | 170767 | 792.3 | 1029 | 1003 | 214.3 |
| A | 0 | 50 | 76848 | 353.97 | 1029 | 1003 | 214.3 |
| A | 0 | 247 | 19072 | 84.33 | 1029 | 1003 | 214.3 |
| B | 15 | 204 | 295096 | 1439.33 | 1047 | 1021 | 204.3 |
| B | 11 | 51 | 65309 | 314.65 | 1047 | 1021 | 204.3 |
| B | 4 | 81 | 31725 | 150.28 | 1047 | 1021 | 204.3 |
| C | 9 | 247 | 41312 | 170.81 | 1008 | 1012 | 235.9 |
| C | 8 | 128 | 18935 | 75.97 | 1008 | 1012 | 235.9 |
| C | 8 | 112 | 10022 | 38.19 | 1008 | 1012 | 235.9 |
| D | 2 | 33 | 225800 | 914.1 | 999 | 965 | 246.0 |
| D | 12 | 221 | 202450 | 819.17 | 999 | 965 | 246.0 |
| D | 8 | 195 | 202196 | 818.14 | 999 | 965 | 246.0 |
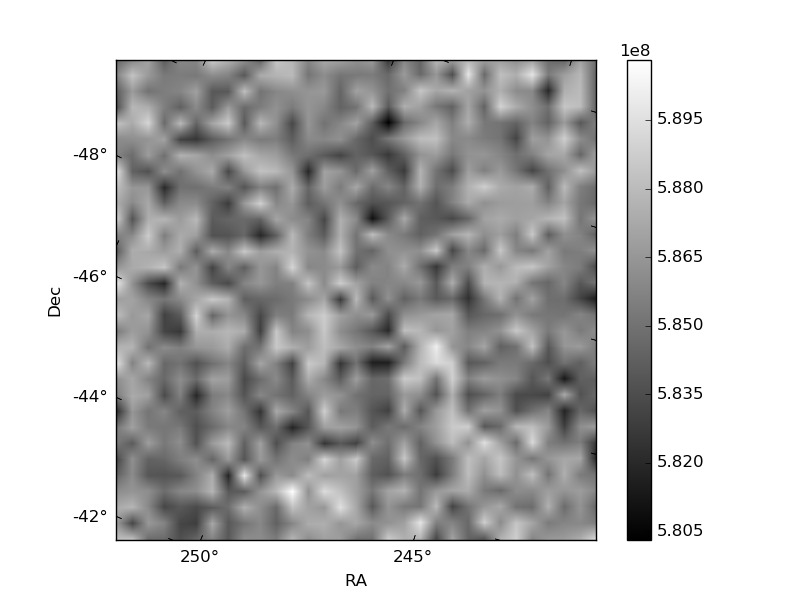
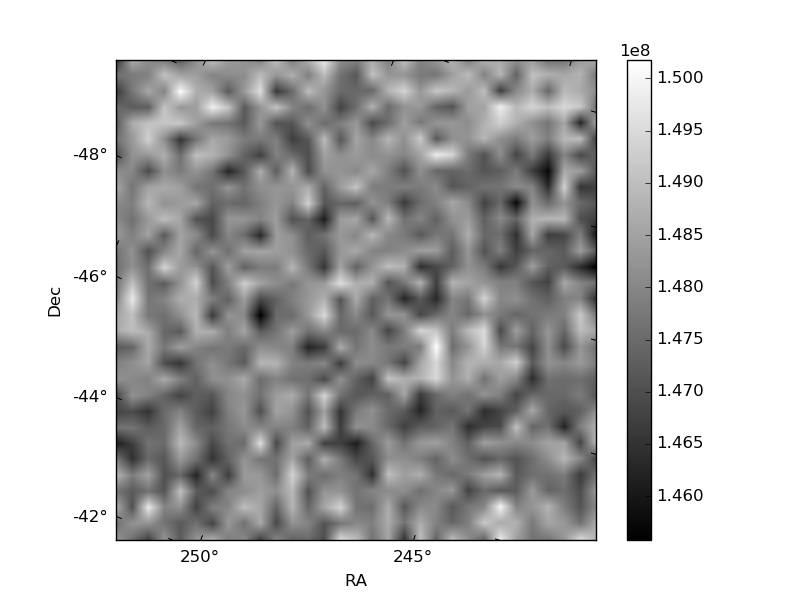
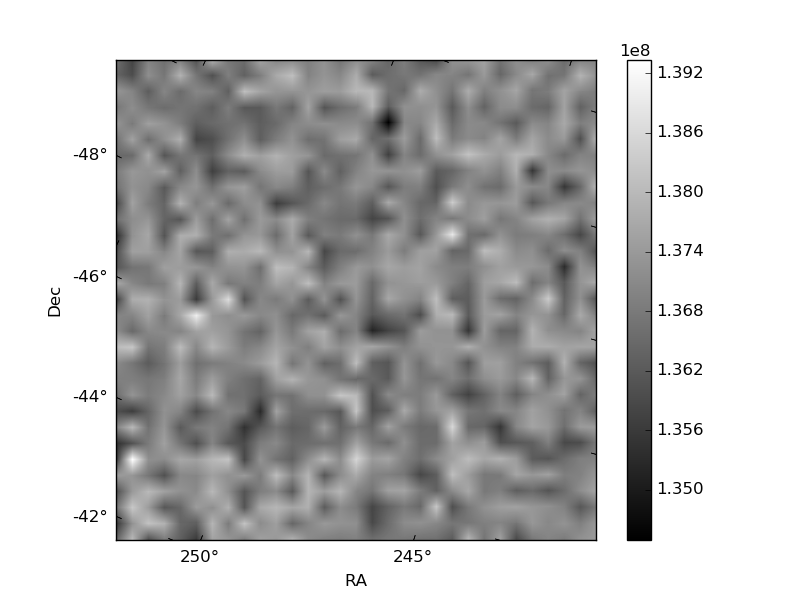
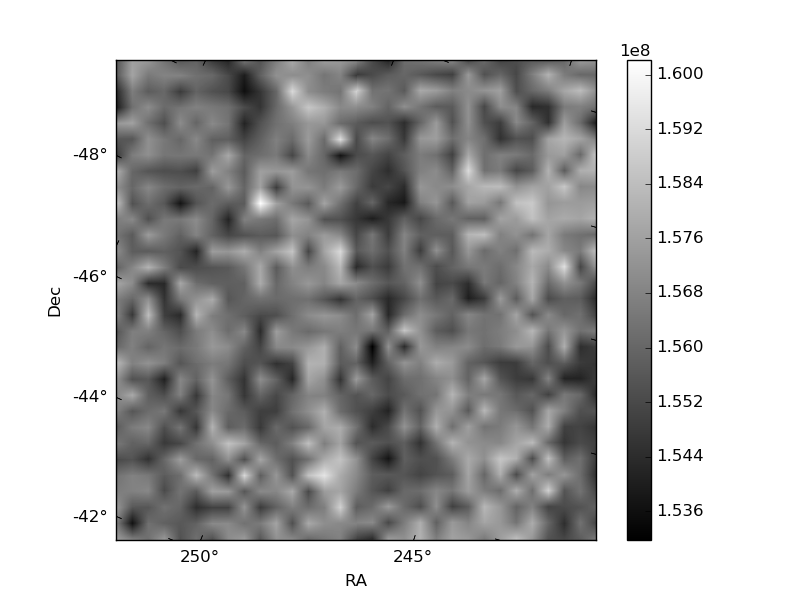
Histogram calculated using DETX and DETY for each event in the final _common_clean file
| Quadrant A | 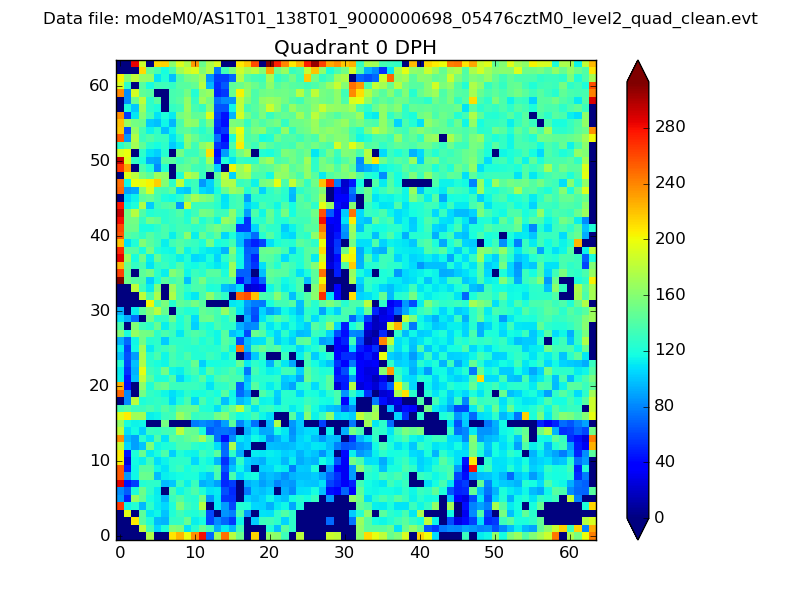 |
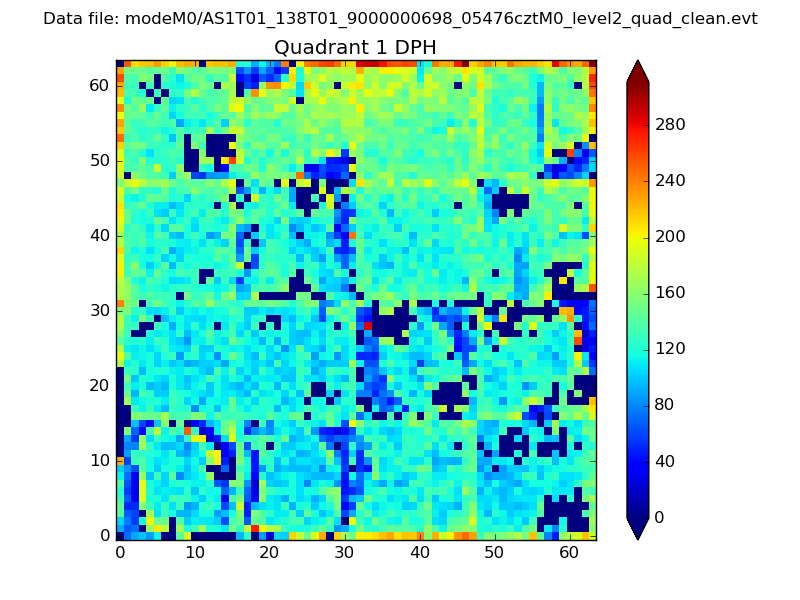 |
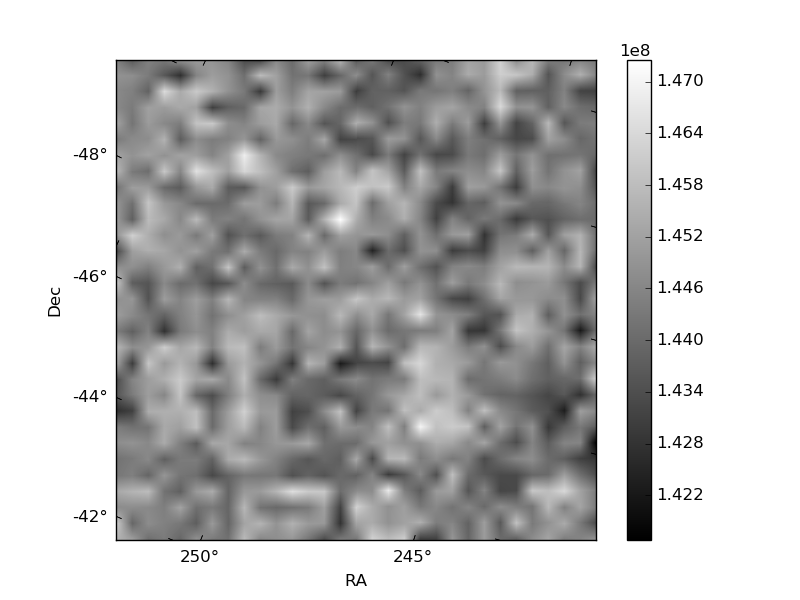
Quadrant B |
|---|---|---|---|
| Quadrant D | 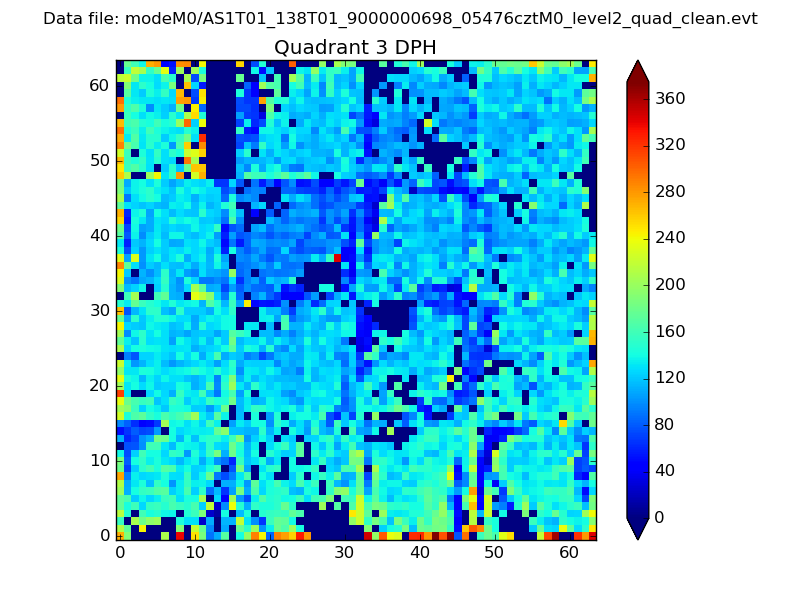 |
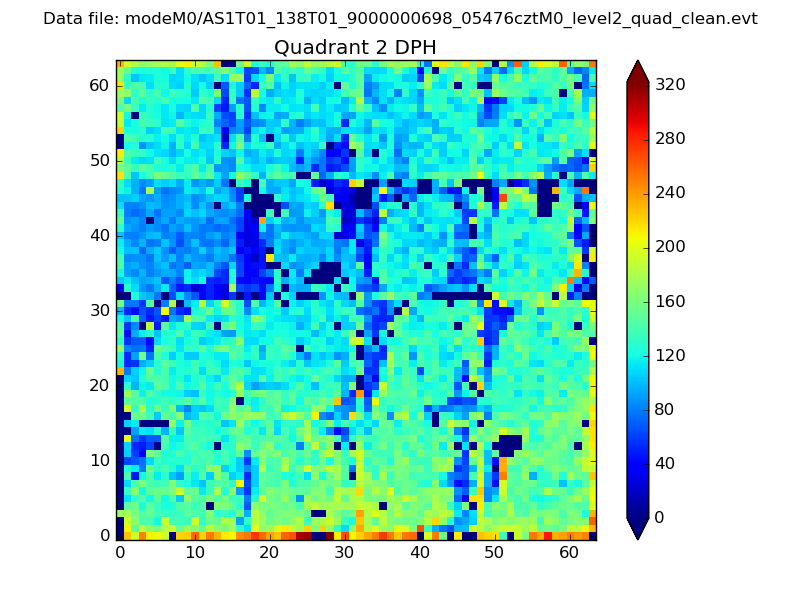 |
Quadrant C |
| Plot type | Count rate plots | Images |
|---|---|---|
| Comparison with Poisson distribution Blue bars denote a histogram of data divided into 1 sec bins. Red curve is a Poisson curve with rate = median count rate of data. |
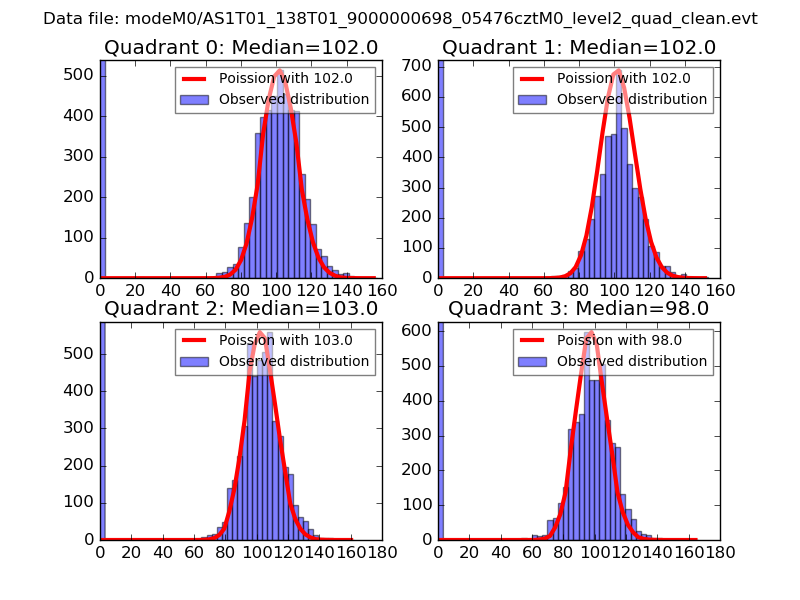 |
 |
| Quadrant-wise count rates Data is divided into 100 sec bins |
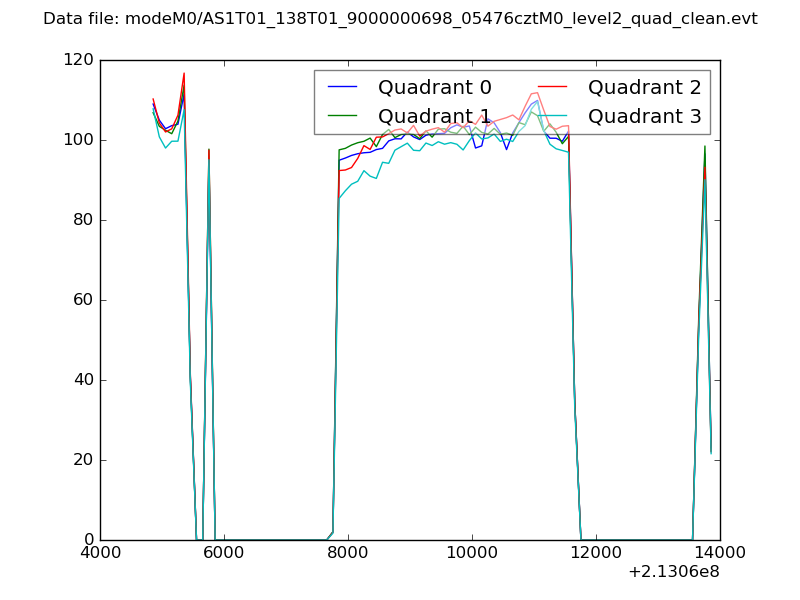 |
|
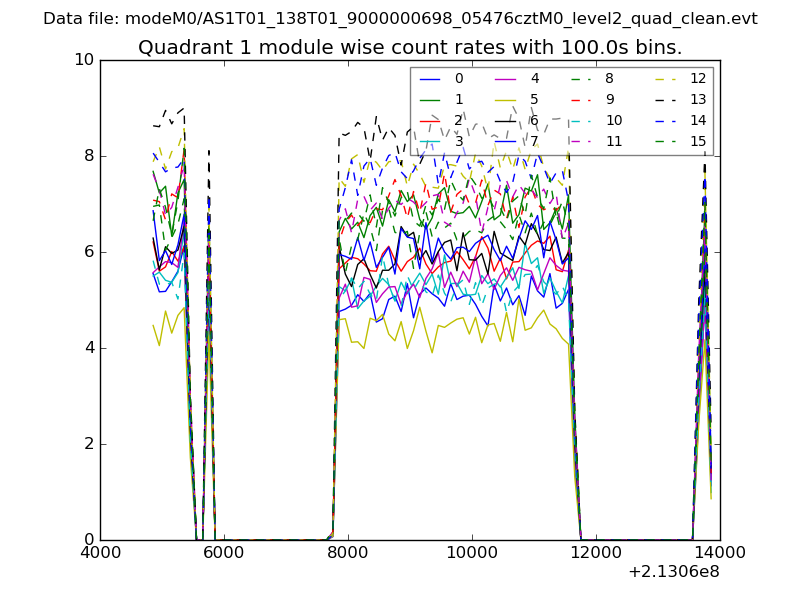
| Module-wise count rates for Quadrant A Data is divided into 100 sec bins |
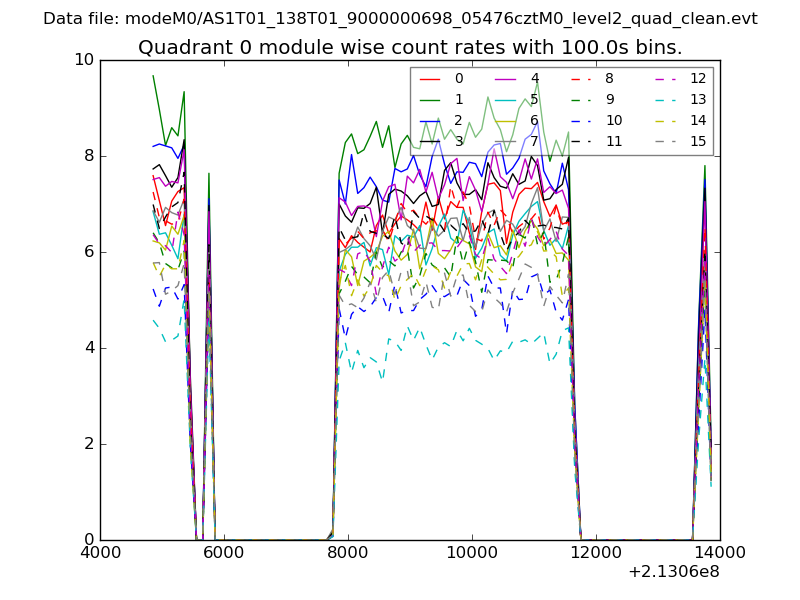 |
 |
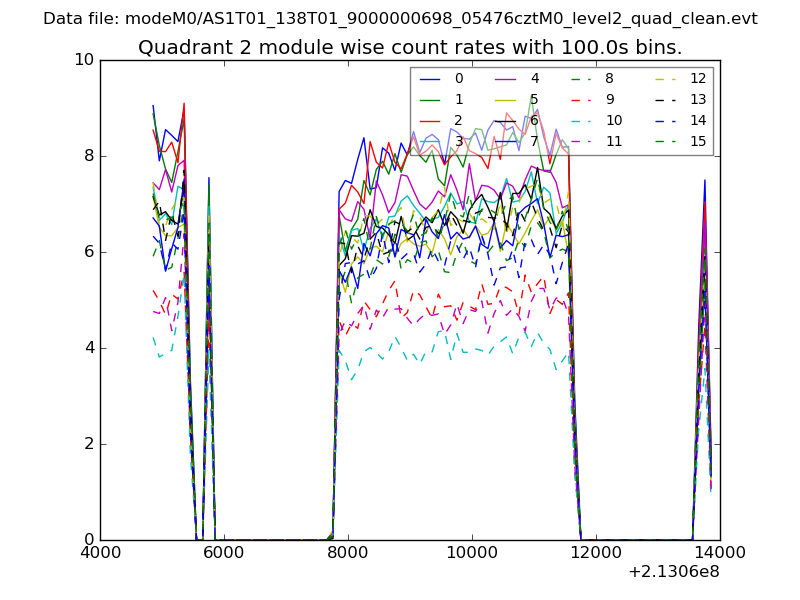
| Module-wise count rates for Quadrant B Data is divided into 100 sec bins |
 |
 |
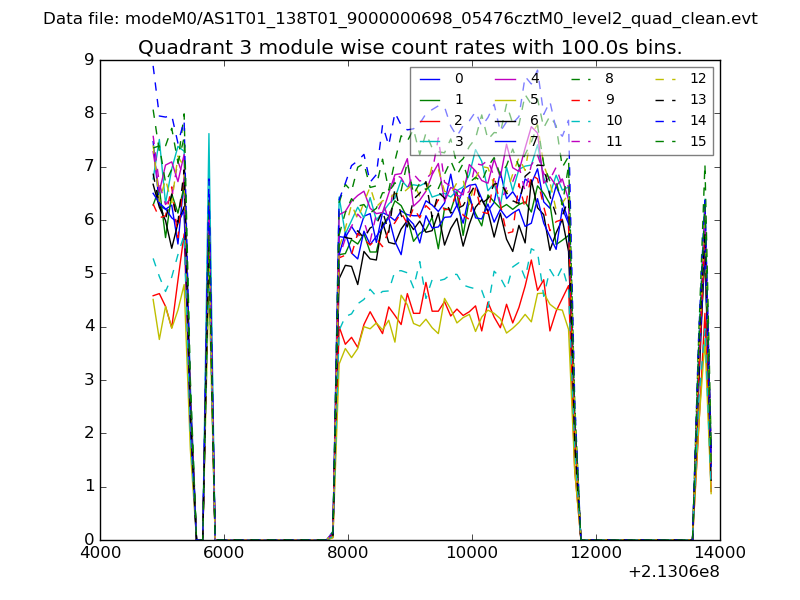
| Module-wise count rates for Quadrant C Data is divided into 100 sec bins |
 |
 |
| Module-wise count rates for Quadrant D Data is divided into 100 sec bins |
 |
 |
| Parameter | Plot |
|---|---|
| CZT HV Monitor |  |
| D_VDD | 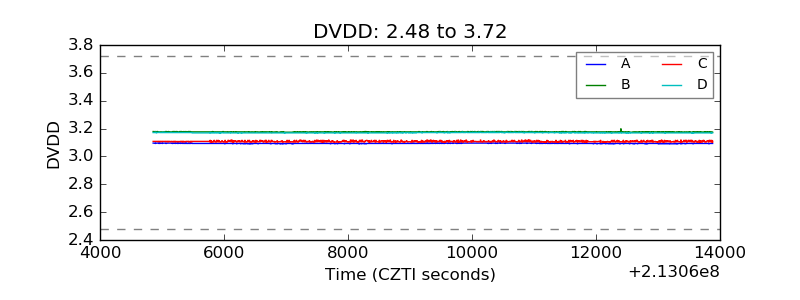 |
| Temperature 1 | 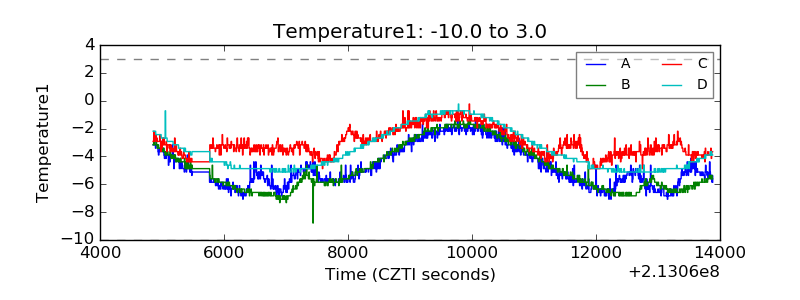 |
| Veto HV Monitor | 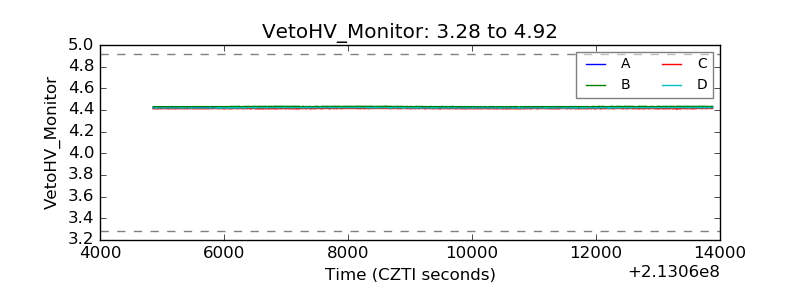 |
| Veto LLD |  |
| Alpha Counter | 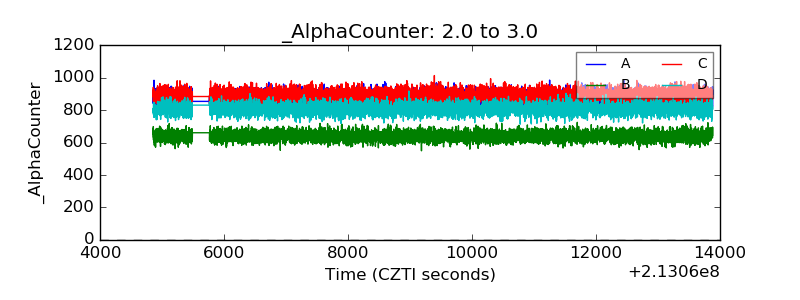 |
| _CPM_Rate | 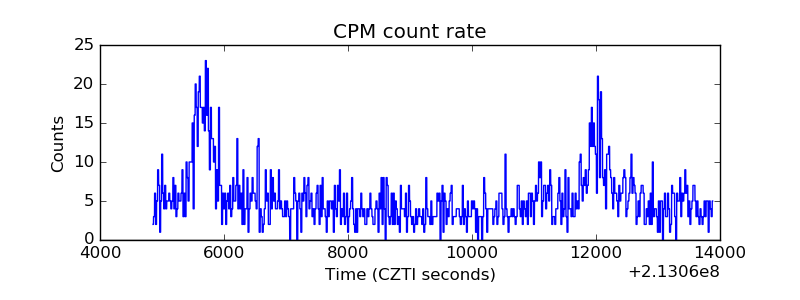 |
| CZT Counter | 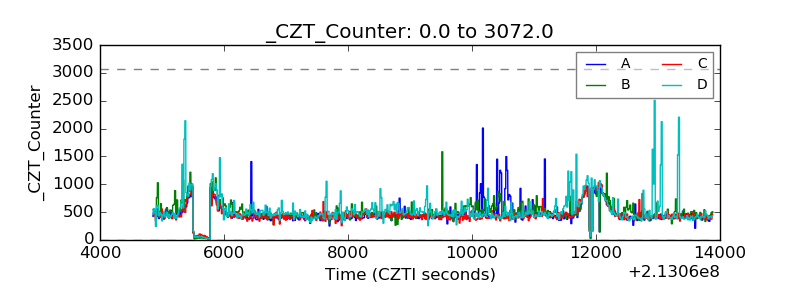 |
| +2.5 Volts monitor |  |
| +5 Volts monitor |  |
| _ROLL_ROT | 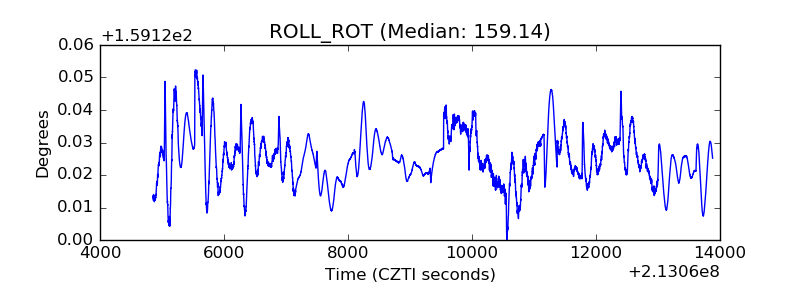 |
| _Roll_DEC | 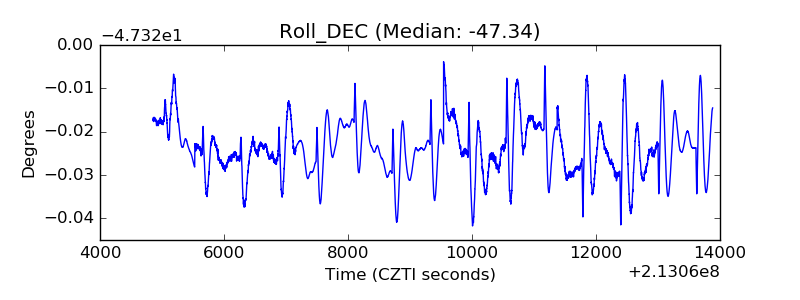 |
| _Roll_RA | 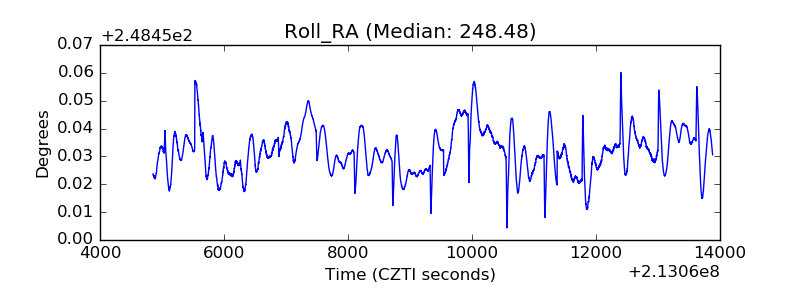 |
| Veto Counter | 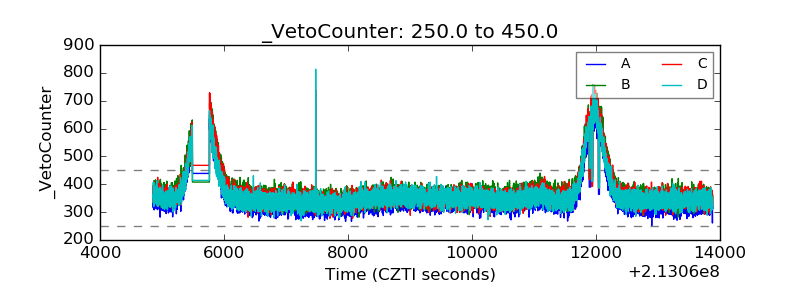 |