| Param | Original file | Final file |
|---|---|---|
| Filename | modeM0/AS1T01_138T01_9000000698_05479cztM0_level2.evt | modeM0/AS1T01_138T01_9000000698_05479cztM0_level2_quad_clean.evt |
| Size (bytes) | 666,129,600 | 104,883,840 |
| Size | 635.3 MB | 100.0 MB |
| Events in quadrant A | 4,841,075 | 622,642 |
| Events in quadrant B | 5,048,915 | 628,604 |
| Events in quadrant C | 4,457,365 | 633,582 |
| Events in quadrant D | 5,154,185 | 604,862 |
| Mode M9 | |||
|---|---|---|---|
| Quadrant | BADHDUFLAG | Total packets | Discarded packets |
| A | 0 | 5 | 0 |
| B | 0 | 5 | 0 |
| C | 0 | 5 | 0 |
| D | 0 | 5 | 0 |
| Mode SS | |||
|---|---|---|---|
| Quadrant | BADHDUFLAG | Total packets | Discarded packets |
| A | 0 | 200 | 0 |
| B | 0 | 200 | 0 |
| C | 0 | 200 | 0 |
| D | 0 | 200 | 0 |
| Mode M0 | |||
|---|---|---|---|
| Quadrant | BADHDUFLAG | Total packets | Discarded packets |
| A | 0 | 21499 | 17 |
| B | 0 | 21532 | 3 |
| C | 0 | 20592 | 17 |
| D | 0 | 22264 | 7 |
| Quadrant | Total seconds | Saturated seconds | Saturation percentage |
|---|---|---|---|
| A | 9911 | 336 | 3.390173% |
| B | 9915 | 293 | 2.955119% |
| C | 9908 | 256 | 2.583771% |
| D | 9913 | 298 | 3.006154% |
Noise dominated data is calculated using 1-second bins in cleaned event files. If a bin has >2000 counts, and if more than 50% of those come from <1% of pixels, then it is considered to be noise-dominated and hence unusable.
| Quadrant | # 1 sec bins | Bins with >0 counts | Bins with >2000 counts | High rate bins dominated by noise | Noise dominated (total time) | Noise dominated (detector-on time) | Marked lightcurve |
|---|---|---|---|---|---|---|---|
| A | 10310 | 9918 | 40 | 40 | 0.39% | 0.40% | 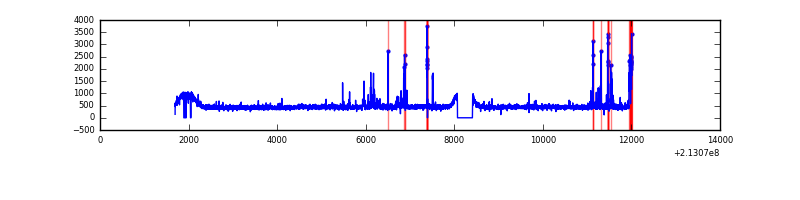 |
| B | 10310 | 9919 | 2 | 2 | 0.02% | 0.02% | 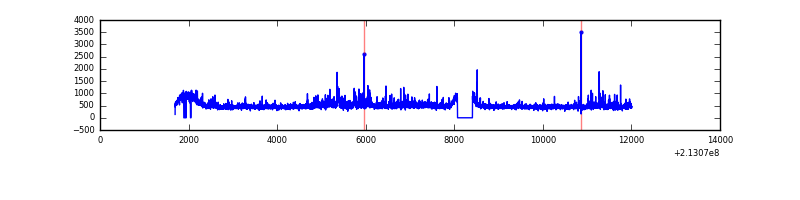 |
| C | 10310 | 9919 | 0 | 0 | 0.00% | 0.00% | 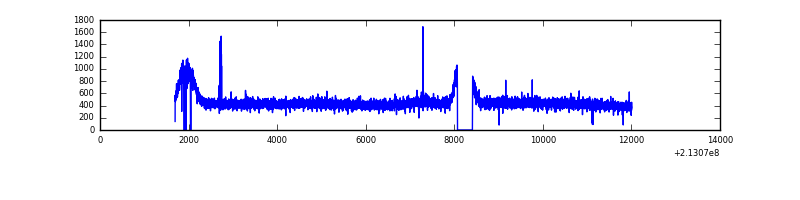 |
| D | 10310 | 9919 | 60 | 60 | 0.58% | 0.60% | 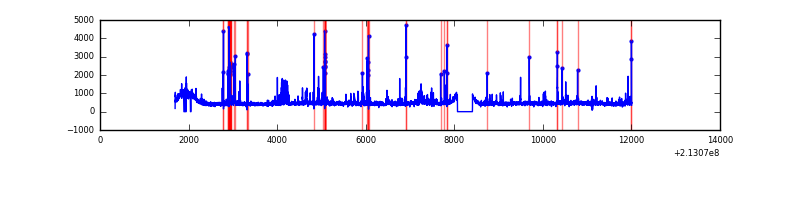 |
Top three noisy pixels from each quadrant. If the there are fewer than three noisy pixels in the level2.evt file, extra rows are filled as -1
| Pixel properties | Quadrant properties | ||||||
|---|---|---|---|---|---|---|---|
| Quadrant | DetID | PixID | Counts | Sigma | Mean | Median | Sigma |
| A | 15 | 174 | 303087 | 1266.56 | 1153 | 1123 | 238.4 |
| A | 0 | 50 | 74988 | 309.82 | 1153 | 1123 | 238.4 |
| A | 13 | 6 | 16081 | 62.74 | 1153 | 1123 | 238.4 |
| B | 15 | 204 | 294855 | 1301.88 | 1165 | 1136 | 225.6 |
| B | 11 | 51 | 120962 | 531.12 | 1165 | 1136 | 225.6 |
| B | 15 | 54 | 26029 | 110.34 | 1165 | 1136 | 225.6 |
| C | 9 | 247 | 18258 | 65.22 | 1128 | 1129 | 262.6 |
| C | 8 | 128 | 15278 | 53.87 | 1128 | 1129 | 262.6 |
| C | 13 | 61 | 9094 | 30.33 | 1128 | 1129 | 262.6 |
| D | 2 | 33 | 201223 | 719.3 | 1131 | 1095 | 278.2 |
| D | 8 | 195 | 192537 | 688.08 | 1131 | 1095 | 278.2 |
| D | 2 | 136 | 173356 | 619.14 | 1131 | 1095 | 278.2 |
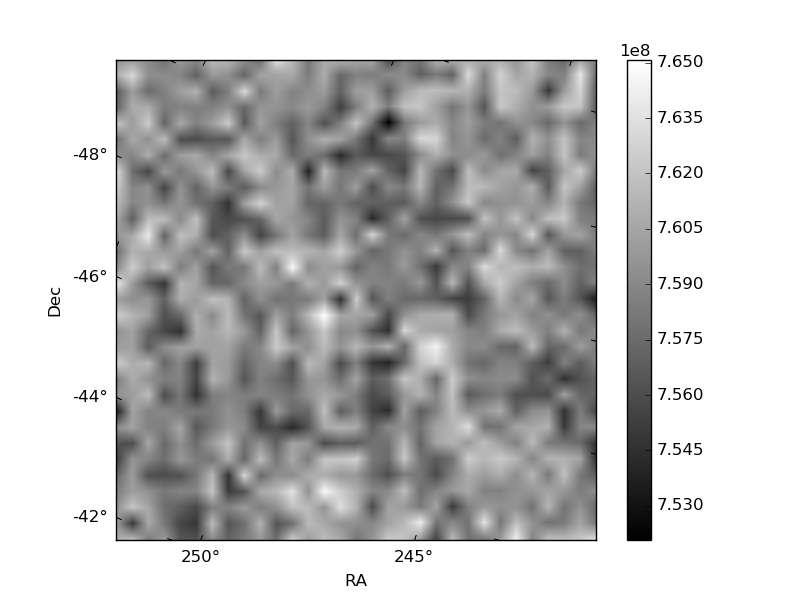
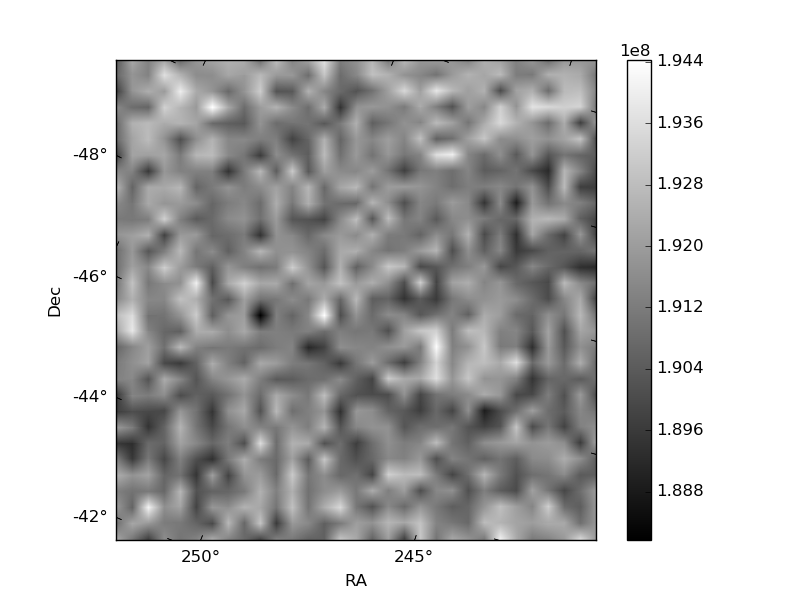
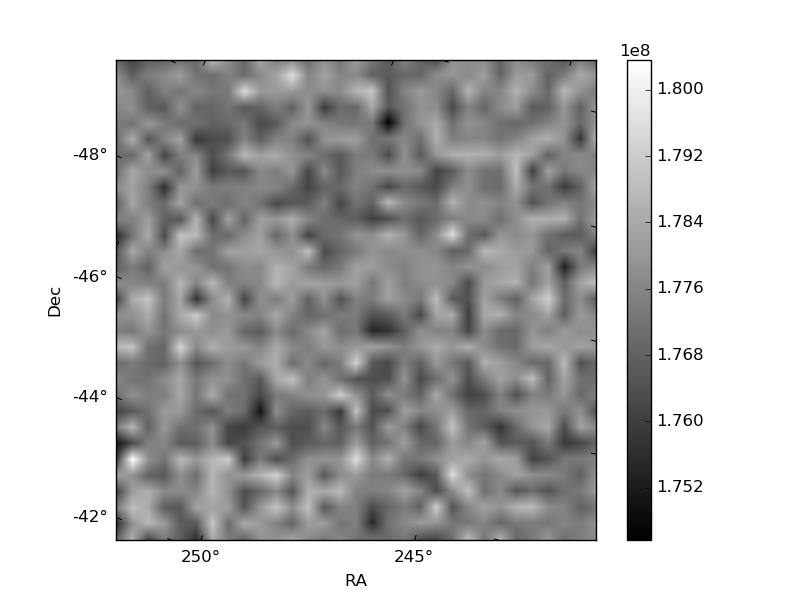
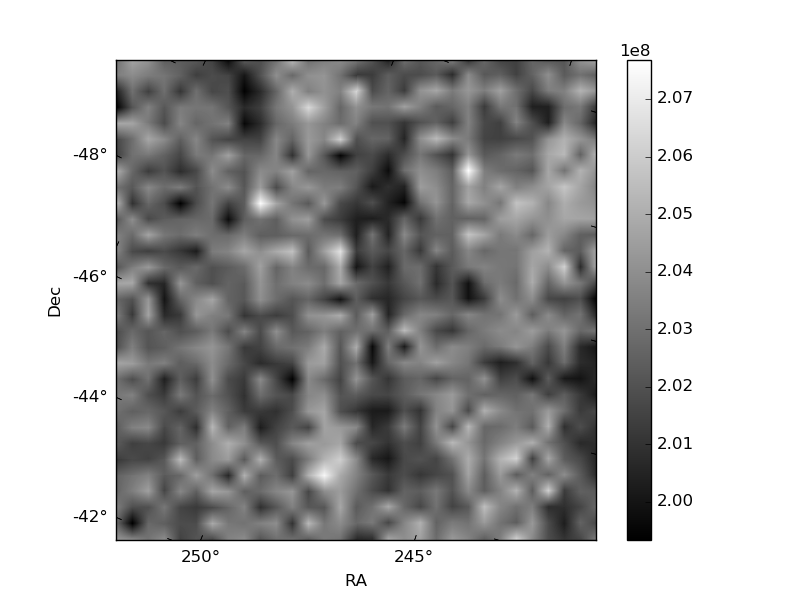
Histogram calculated using DETX and DETY for each event in the final _common_clean file
| Quadrant A | 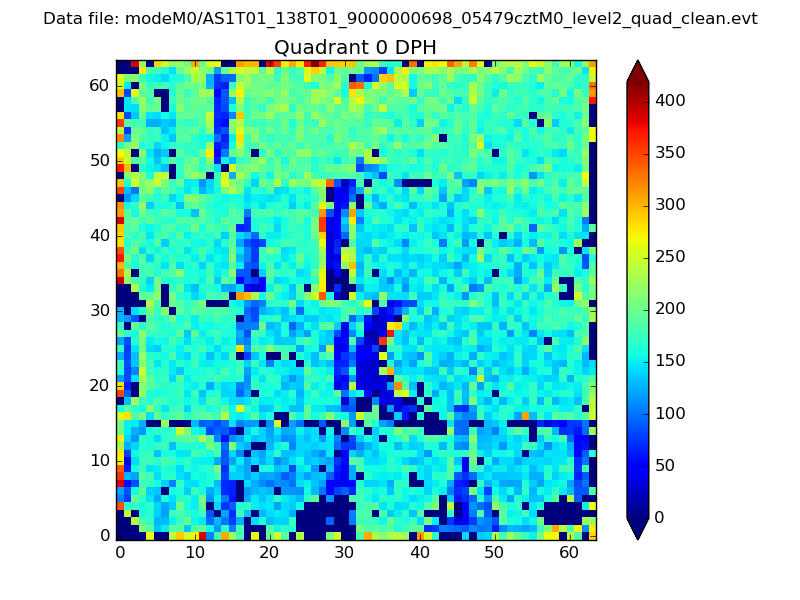 |
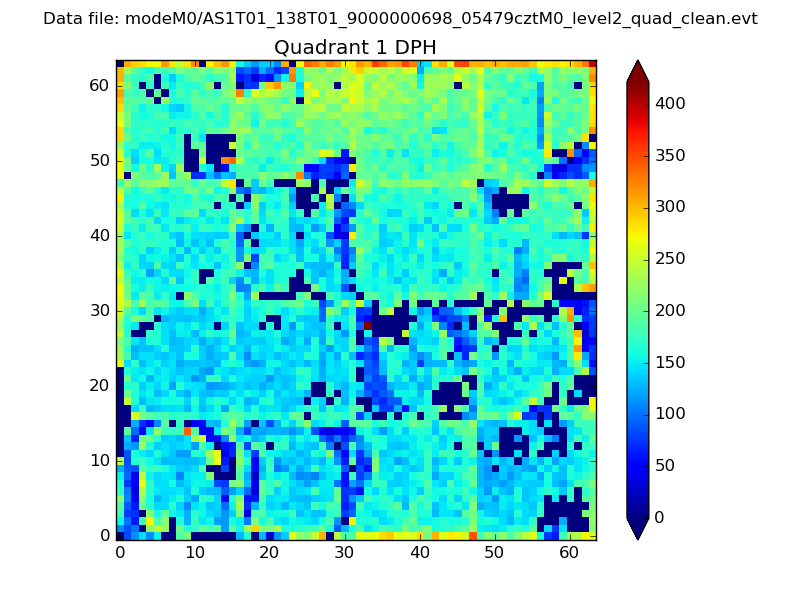 |
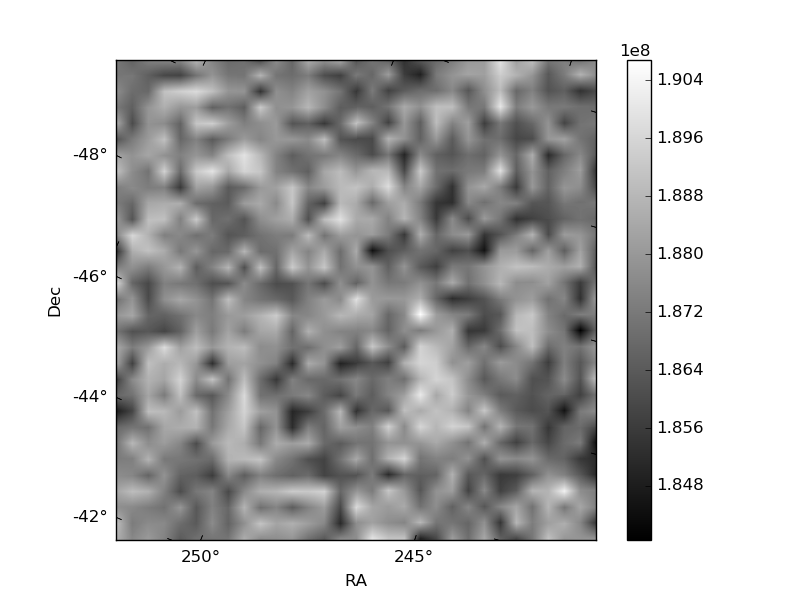
Quadrant B |
|---|---|---|---|
| Quadrant D | 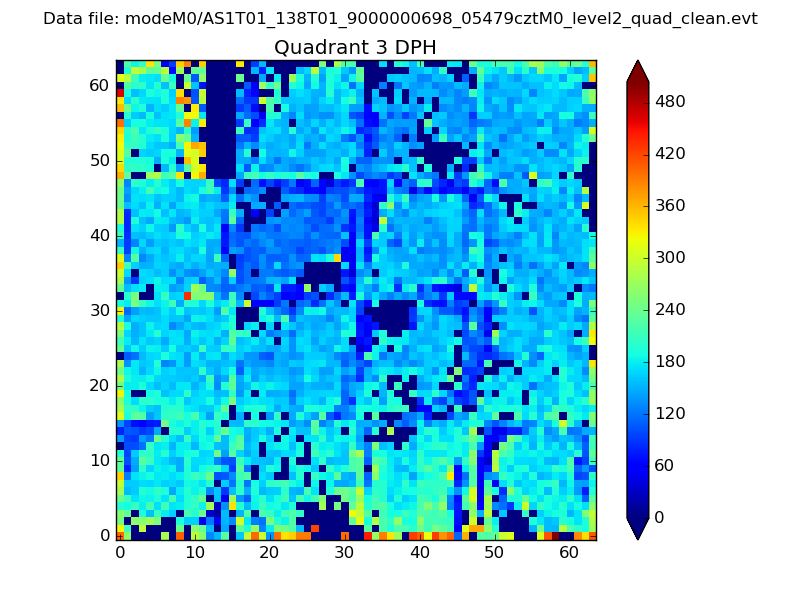 |
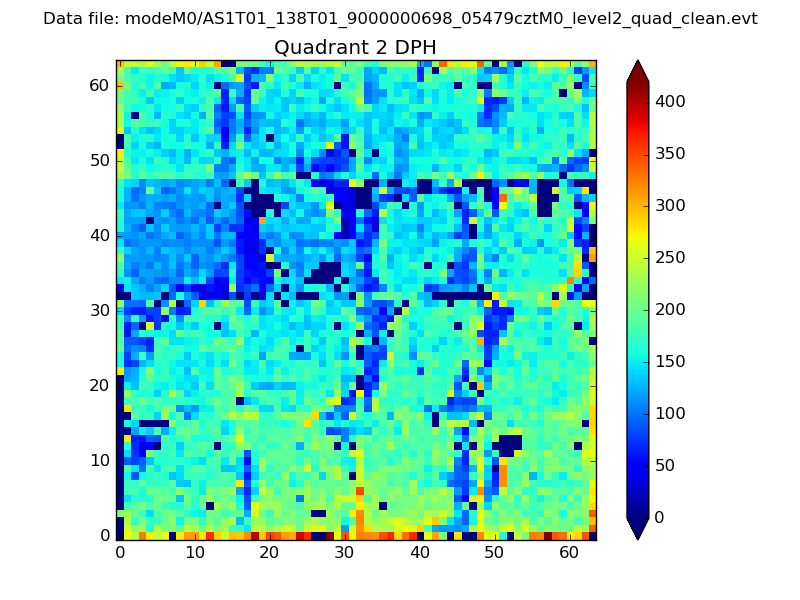 |
Quadrant C |
| Plot type | Count rate plots | Images |
|---|---|---|
| Comparison with Poisson distribution Blue bars denote a histogram of data divided into 1 sec bins. Red curve is a Poisson curve with rate = median count rate of data. |
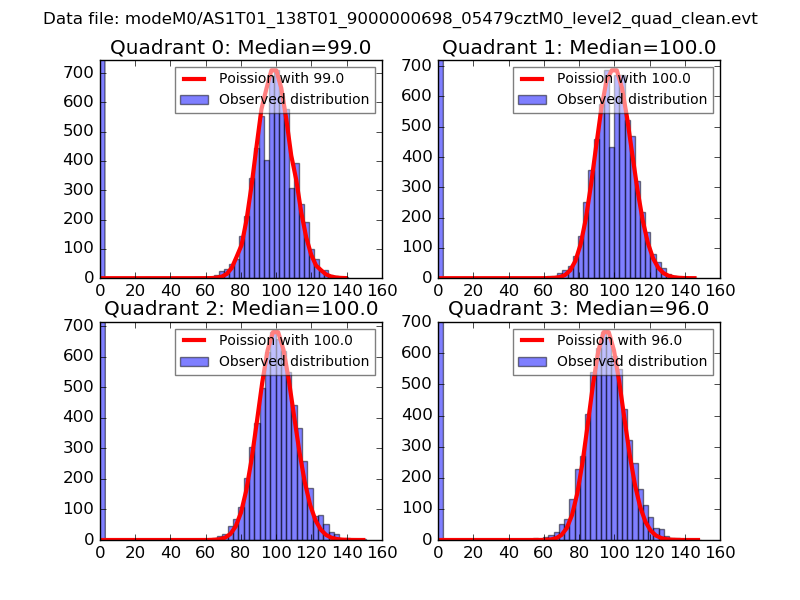 |
 |
| Quadrant-wise count rates Data is divided into 100 sec bins |
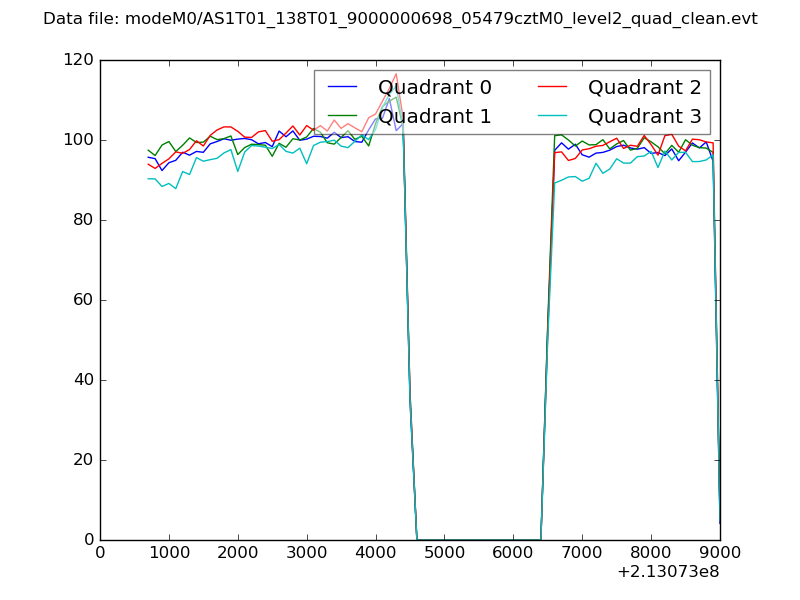 |
|
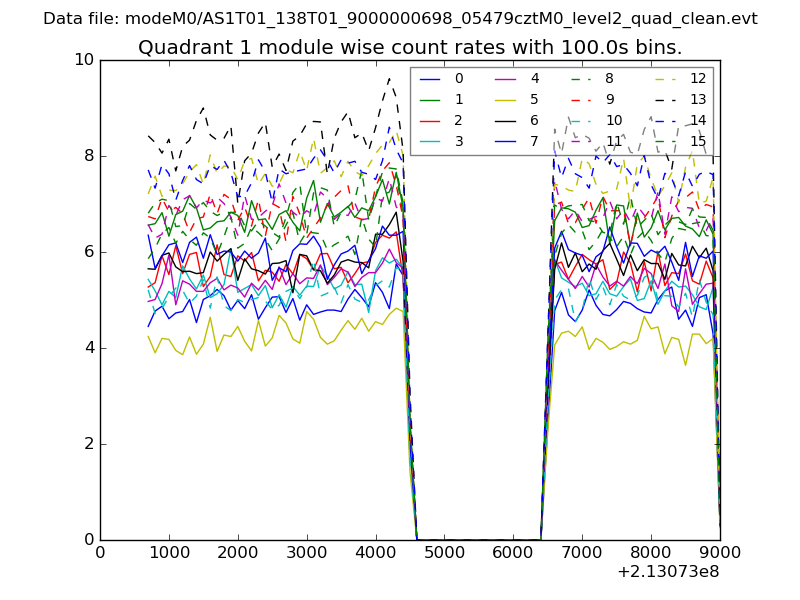
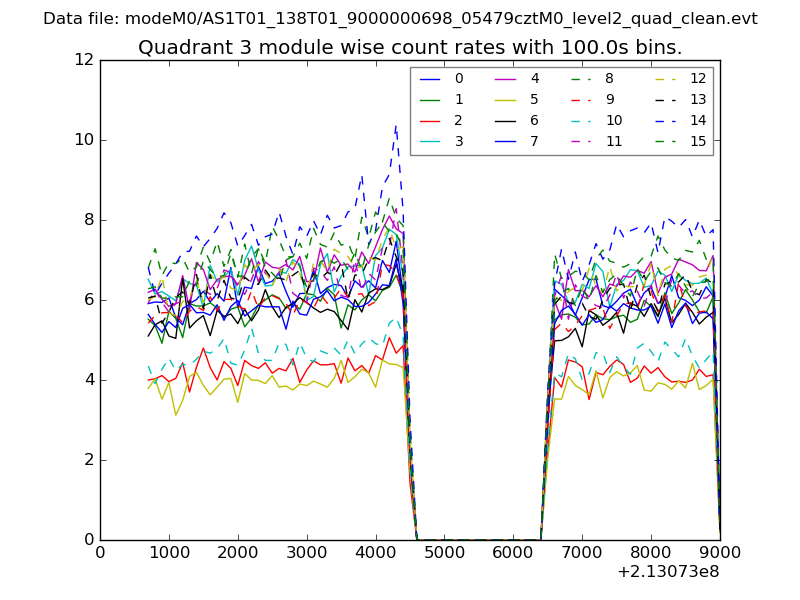
| Module-wise count rates for Quadrant A Data is divided into 100 sec bins |
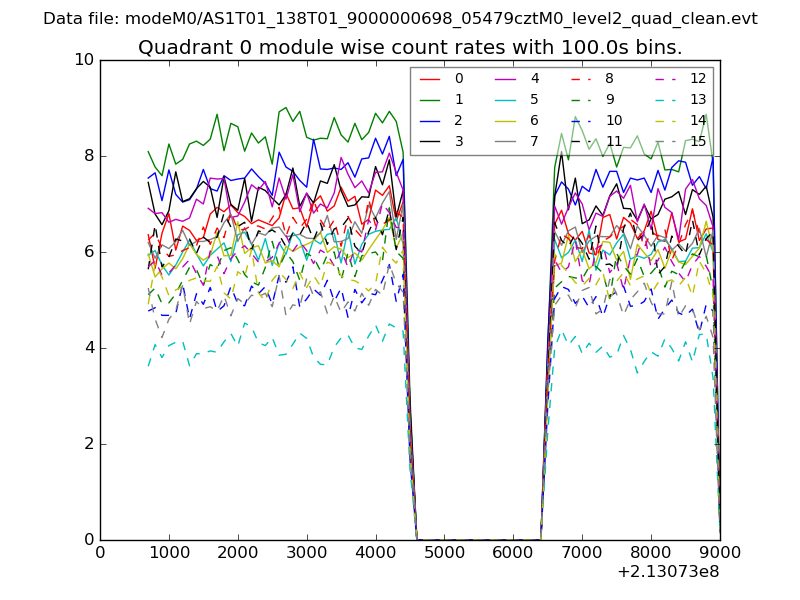 |
 |
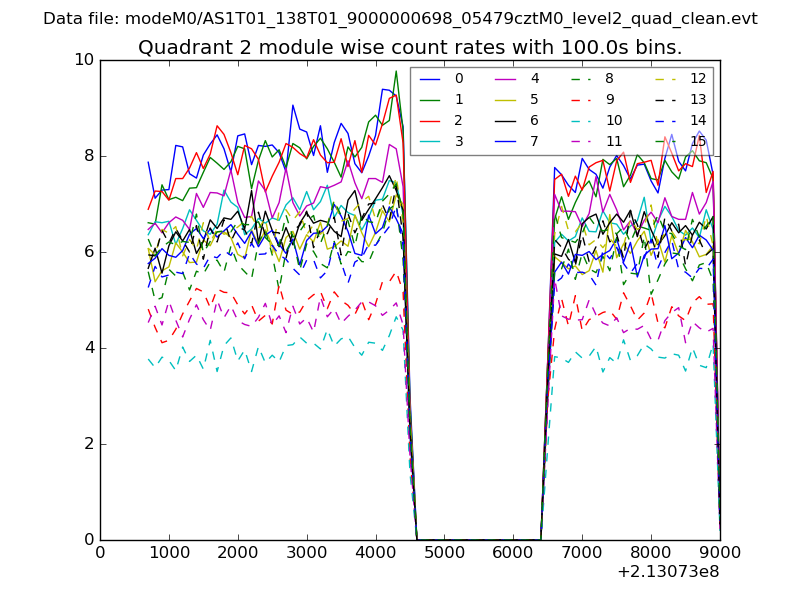
| Module-wise count rates for Quadrant B Data is divided into 100 sec bins |
 |
 |
| Module-wise count rates for Quadrant C Data is divided into 100 sec bins |
 |
 |
| Module-wise count rates for Quadrant D Data is divided into 100 sec bins |
 |
 |
| Parameter | Plot |
|---|---|
| CZT HV Monitor |  |
| D_VDD | 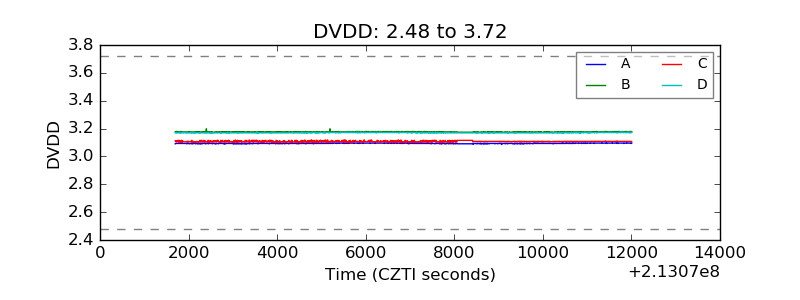 |
| Temperature 1 | 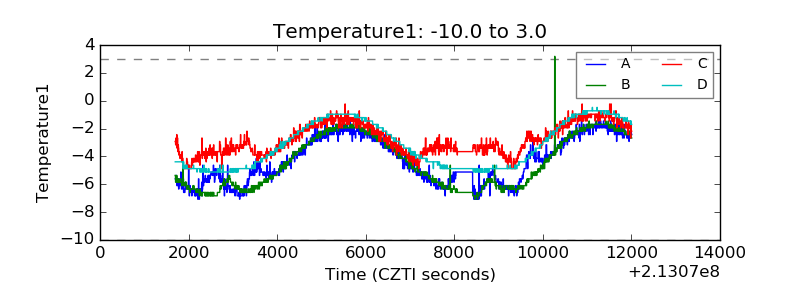 |
| Veto HV Monitor | 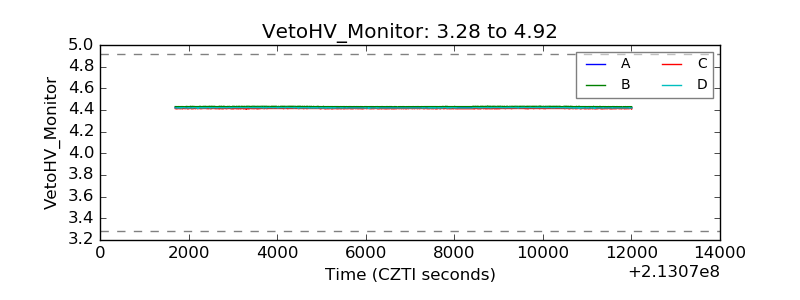 |
| Veto LLD | 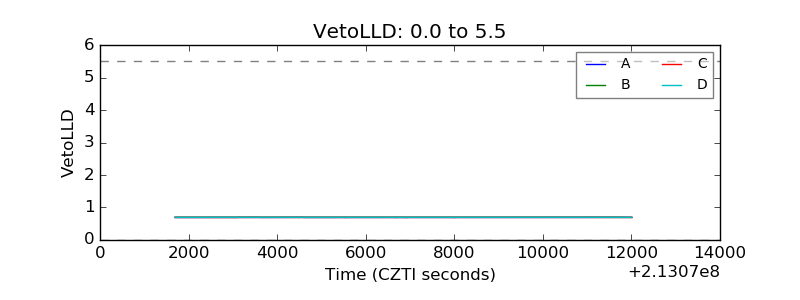 |
| Alpha Counter | 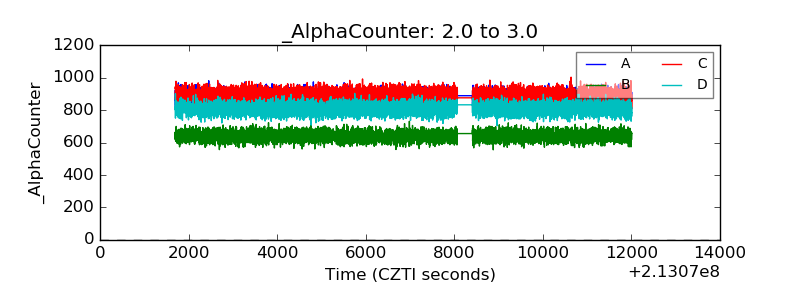 |
| _CPM_Rate | 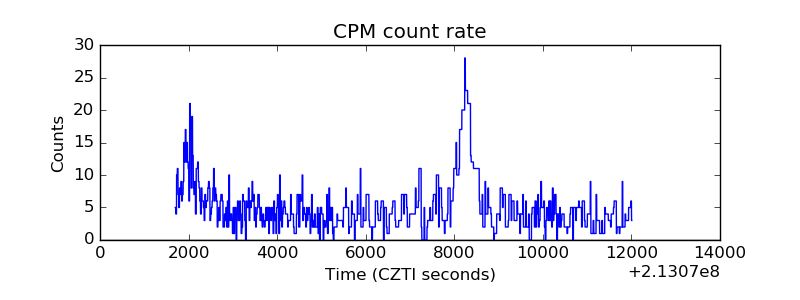 |
| CZT Counter | 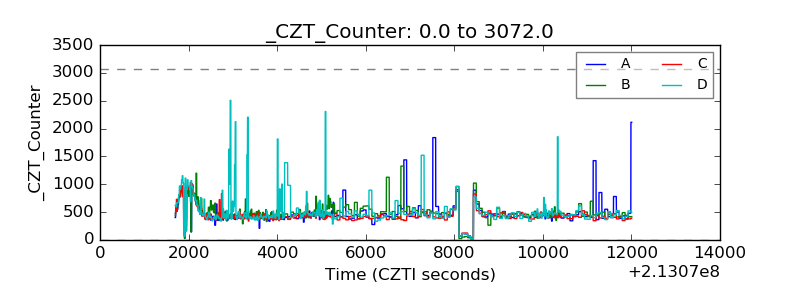 |
| +2.5 Volts monitor |  |
| +5 Volts monitor | 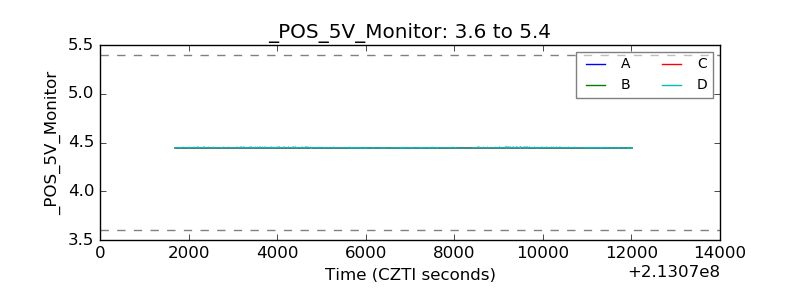 |
| _ROLL_ROT | 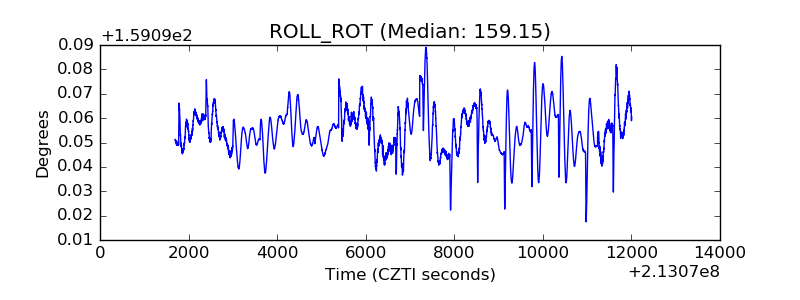 |
| _Roll_DEC | 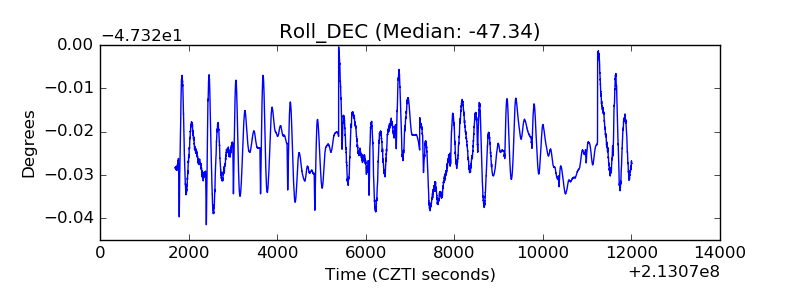 |
| _Roll_RA | 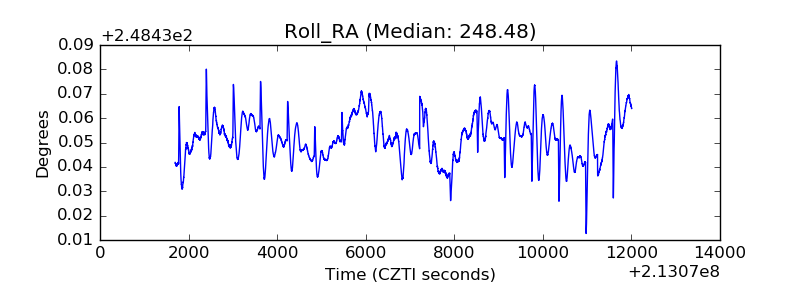 |
| Veto Counter | 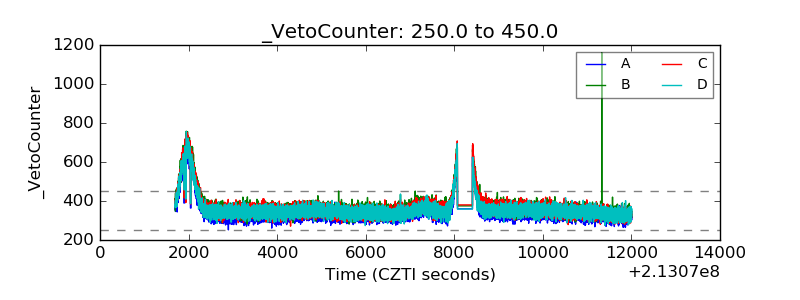 |