| Param | Original file | Final file |
|---|---|---|
| Filename | modeM0/AS1T01_138T01_9000000698_05480cztM0_level2.evt | modeM0/AS1T01_138T01_9000000698_05480cztM0_level2_quad_clean.evt |
| Size (bytes) | 1,055,102,400 | 179,107,200 |
| Size | 1006.2 MB | 170.8 MB |
| Events in quadrant A | 7,743,442 | 1,092,327 |
| Events in quadrant B | 7,867,291 | 1,104,660 |
| Events in quadrant C | 6,754,452 | 1,118,387 |
| Events in quadrant D | 8,559,508 | 1,059,559 |
| Mode M9 | |||
|---|---|---|---|
| Quadrant | BADHDUFLAG | Total packets | Discarded packets |
| A | 0 | 20 | 0 |
| B | 0 | 20 | 0 |
| C | 0 | 20 | 0 |
| D | 0 | 20 | 0 |
| Mode SS | |||
|---|---|---|---|
| Quadrant | BADHDUFLAG | Total packets | Discarded packets |
| A | 0 | 312 | 0 |
| B | 0 | 312 | 0 |
| C | 0 | 312 | 0 |
| D | 0 | 312 | 0 |
| Mode M0 | |||
|---|---|---|---|
| Quadrant | BADHDUFLAG | Total packets | Discarded packets |
| A | 0 | 33600 | 4 |
| B | 0 | 33083 | 3 |
| C | 0 | 31153 | 3 |
| D | 0 | 35694 | 3 |
| Quadrant | Total seconds | Saturated seconds | Saturation percentage |
|---|---|---|---|
| A | 15203 | 423 | 2.782346% |
| B | 15203 | 188 | 1.236598% |
| C | 15203 | 160 | 1.052424% |
| D | 15203 | 487 | 3.203315% |
Noise dominated data is calculated using 1-second bins in cleaned event files. If a bin has >2000 counts, and if more than 50% of those come from <1% of pixels, then it is considered to be noise-dominated and hence unusable.
| Quadrant | # 1 sec bins | Bins with >0 counts | Bins with >2000 counts | High rate bins dominated by noise | Noise dominated (total time) | Noise dominated (detector-on time) | Marked lightcurve |
|---|---|---|---|---|---|---|---|
| A | 17258 | 15206 | 131 | 131 | 0.76% | 0.86% | 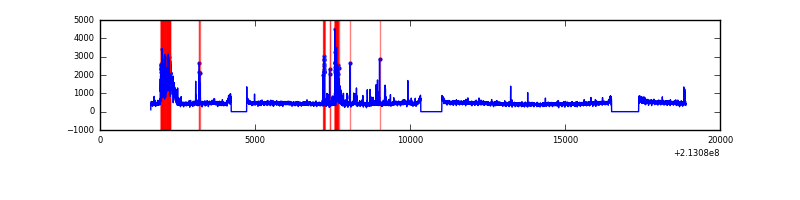 |
| B | 17258 | 15206 | 10 | 10 | 0.06% | 0.07% | 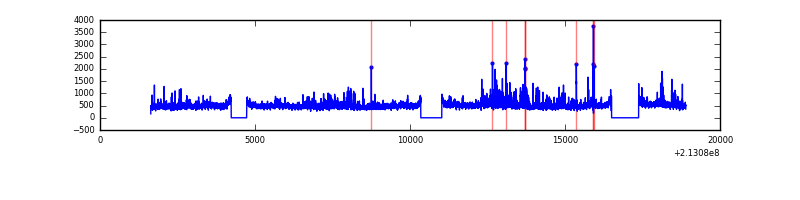 |
| C | 17258 | 15206 | 9 | 9 | 0.05% | 0.06% | 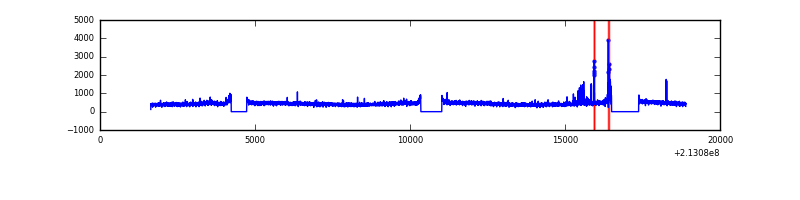 |
| D | 17258 | 15206 | 260 | 260 | 1.51% | 1.71% | 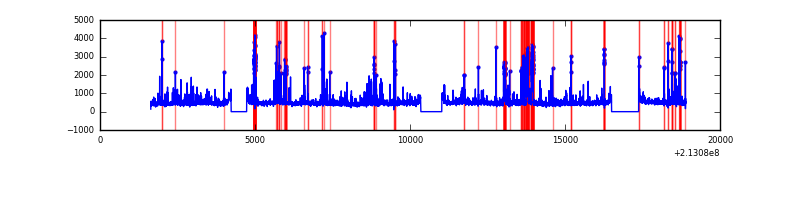 |
Top three noisy pixels from each quadrant. If the there are fewer than three noisy pixels in the level2.evt file, extra rows are filled as -1
| Pixel properties | Quadrant properties | ||||||
|---|---|---|---|---|---|---|---|
| Quadrant | DetID | PixID | Counts | Sigma | Mean | Median | Sigma |
| A | 15 | 174 | 869491 | 2442.28 | 1742 | 1702 | 355.3 |
| A | 0 | 50 | 155844 | 433.81 | 1742 | 1702 | 355.3 |
| A | 0 | 226 | 17466 | 44.37 | 1742 | 1702 | 355.3 |
| B | 15 | 204 | 649385 | 1921.29 | 1758 | 1714 | 337.1 |
| B | 11 | 51 | 140199 | 410.81 | 1758 | 1714 | 337.1 |
| B | 4 | 48 | 95954 | 279.56 | 1758 | 1714 | 337.1 |
| C | 9 | 247 | 133643 | 336.74 | 1693 | 1698 | 391.8 |
| C | 13 | 61 | 13638 | 30.47 | 1693 | 1698 | 391.8 |
| C | 1 | 16 | 10071 | 21.37 | 1693 | 1698 | 391.8 |
| D | 1 | 239 | 580872 | 1412.91 | 1683 | 1632 | 410.0 |
| D | 8 | 195 | 248620 | 602.46 | 1683 | 1632 | 410.0 |
| D | 2 | 33 | 214038 | 518.11 | 1683 | 1632 | 410.0 |
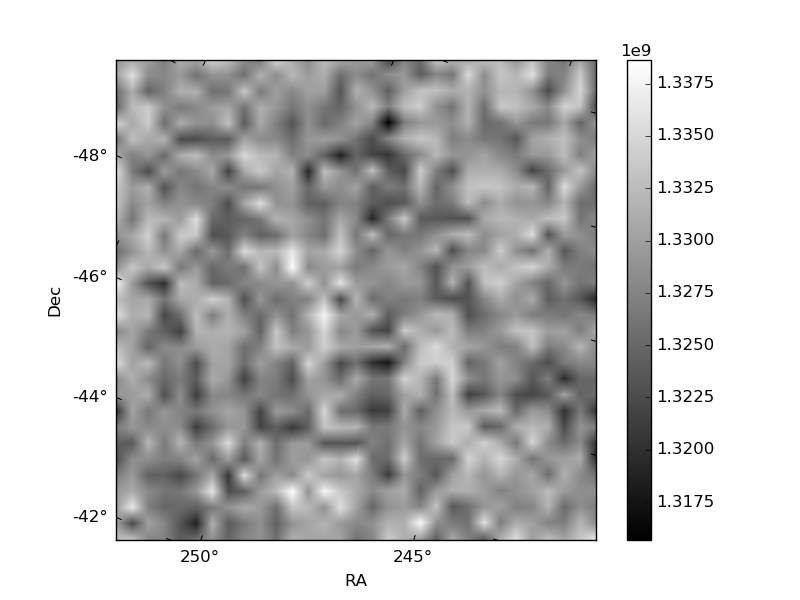
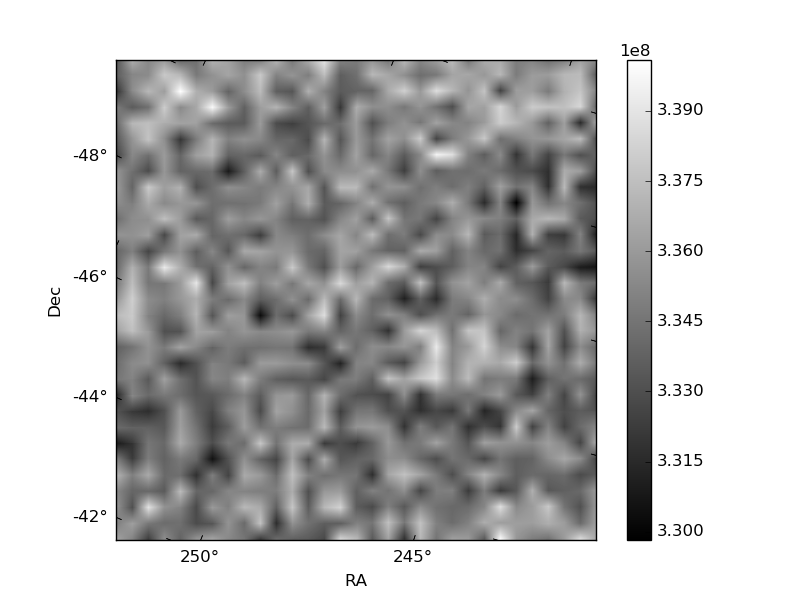
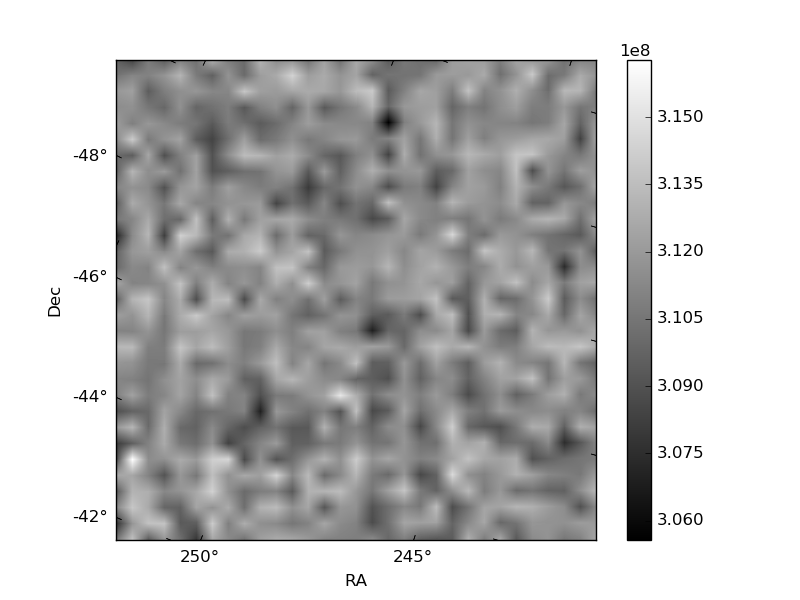
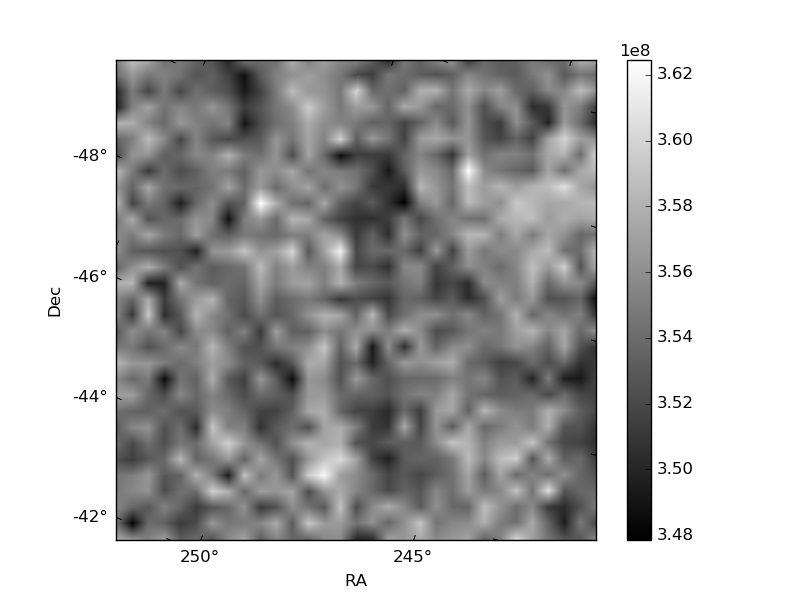
Histogram calculated using DETX and DETY for each event in the final _common_clean file
| Quadrant A | 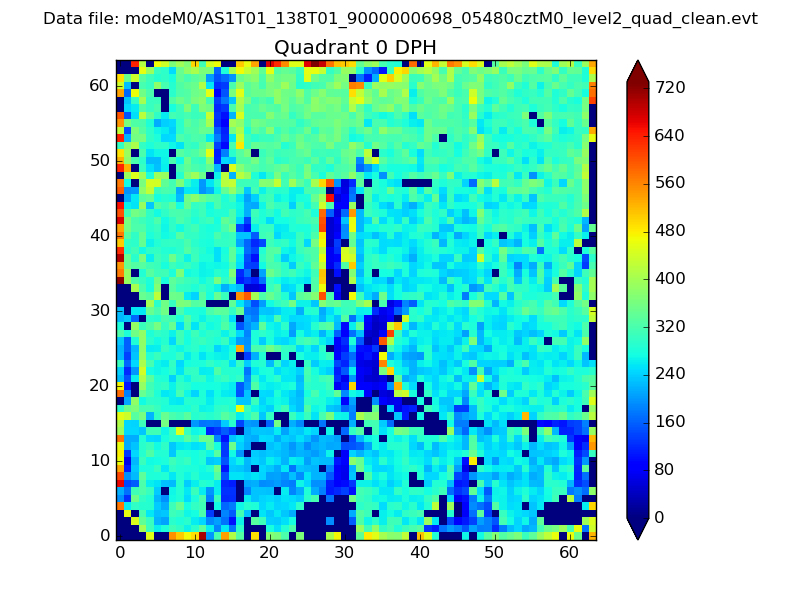 |
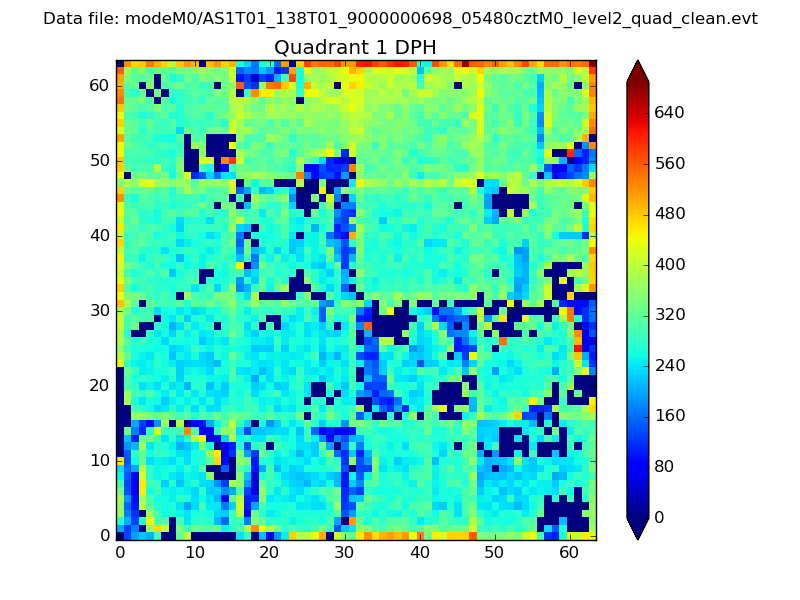 |
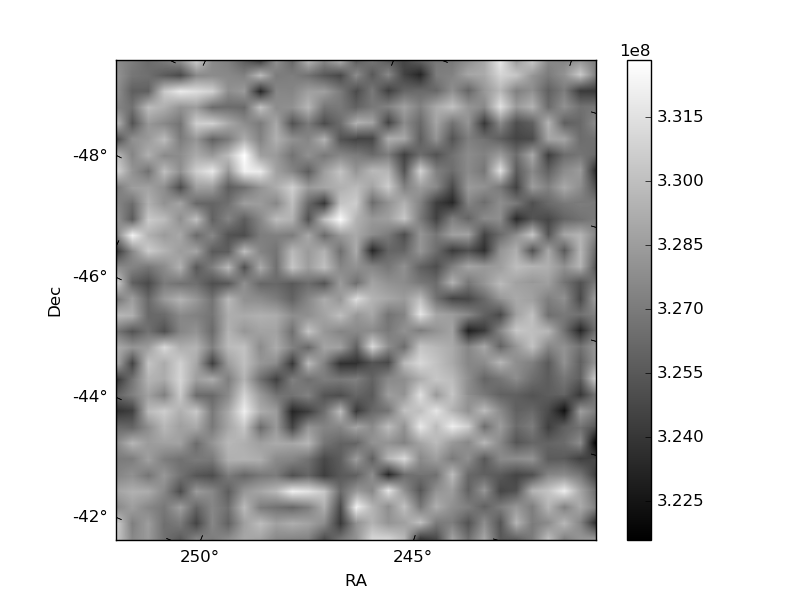
Quadrant B |
|---|---|---|---|
| Quadrant D | 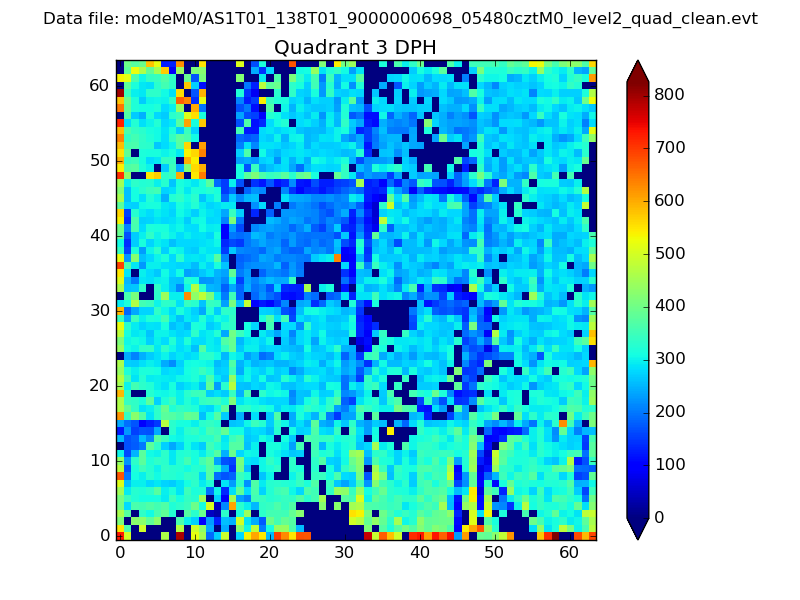 |
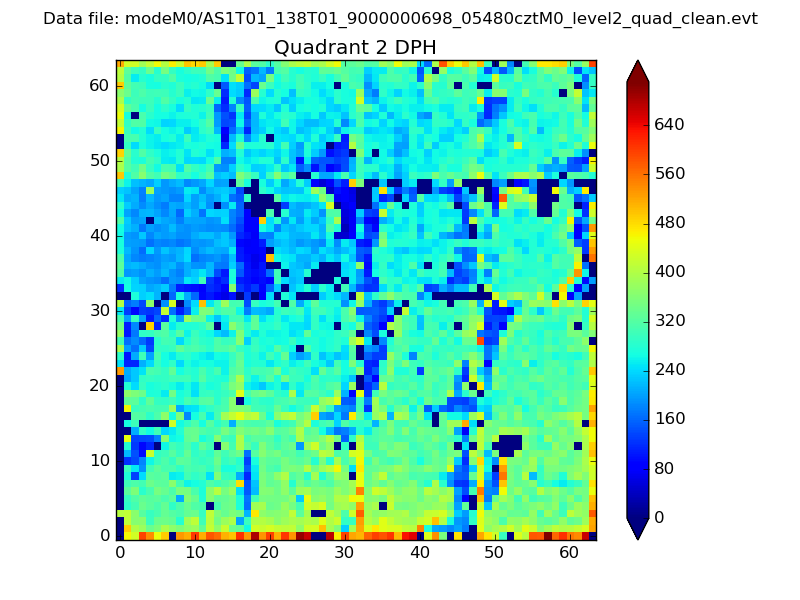 |
Quadrant C |
| Plot type | Count rate plots | Images |
|---|---|---|
| Comparison with Poisson distribution Blue bars denote a histogram of data divided into 1 sec bins. Red curve is a Poisson curve with rate = median count rate of data. |
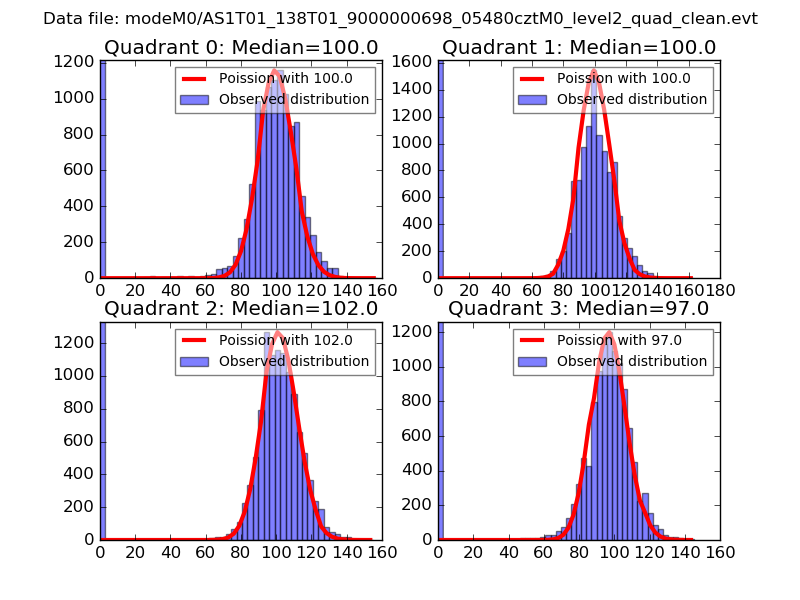 |
 |
| Quadrant-wise count rates Data is divided into 100 sec bins |
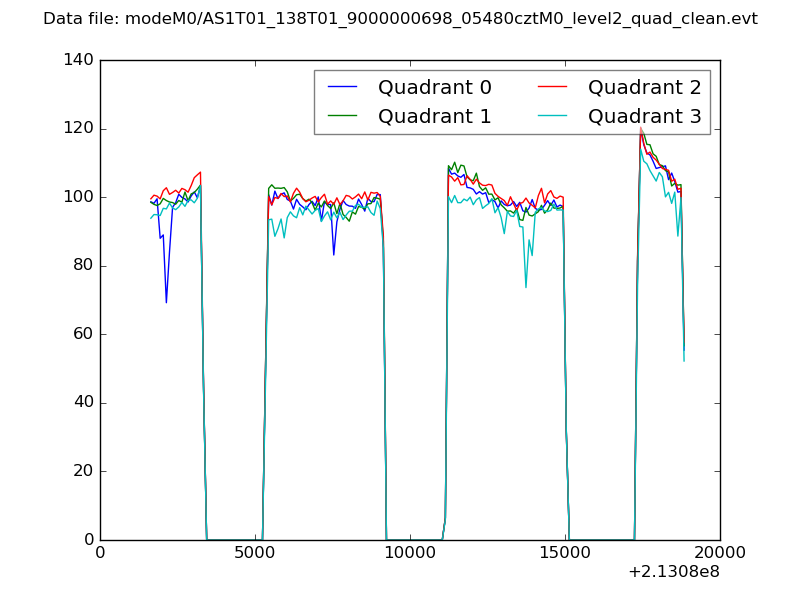 |
|
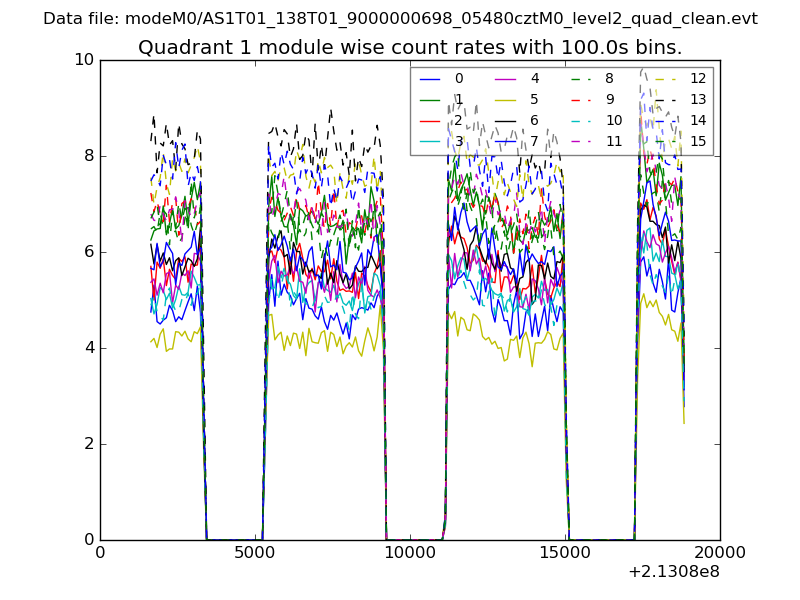
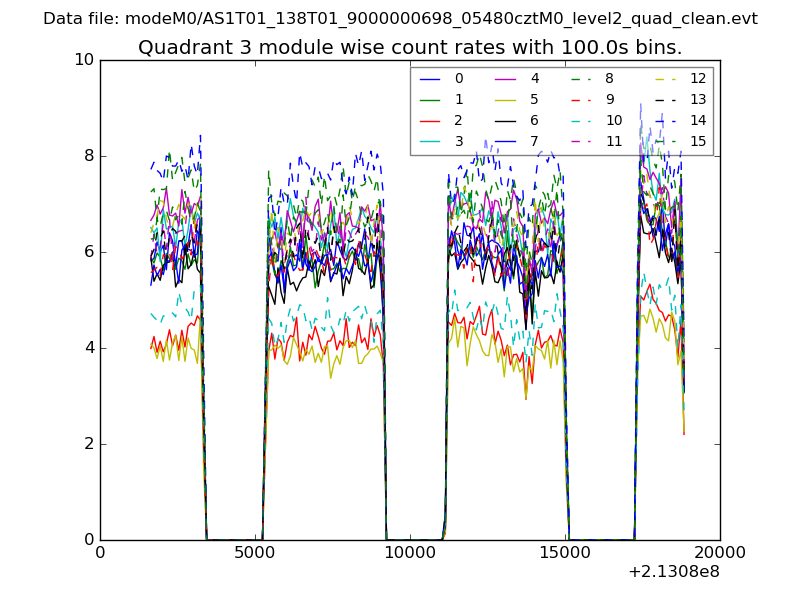
| Module-wise count rates for Quadrant A Data is divided into 100 sec bins |
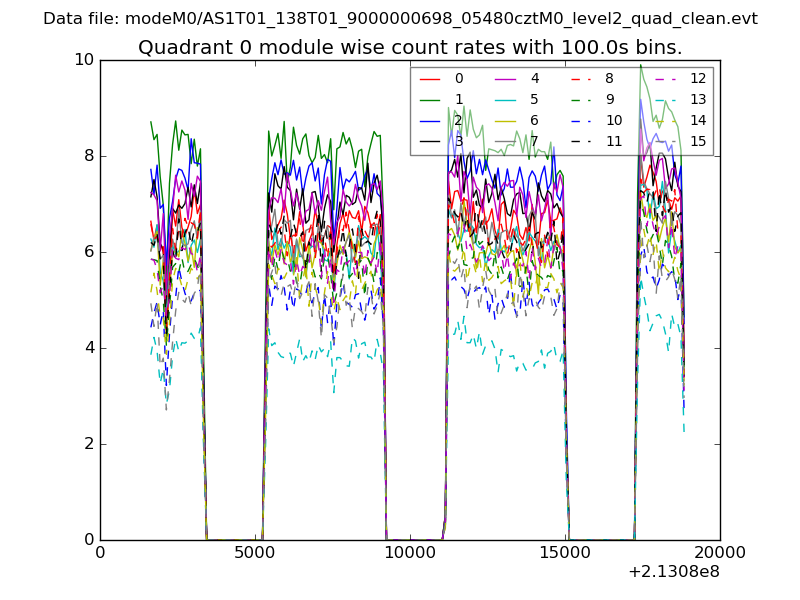 |
 |
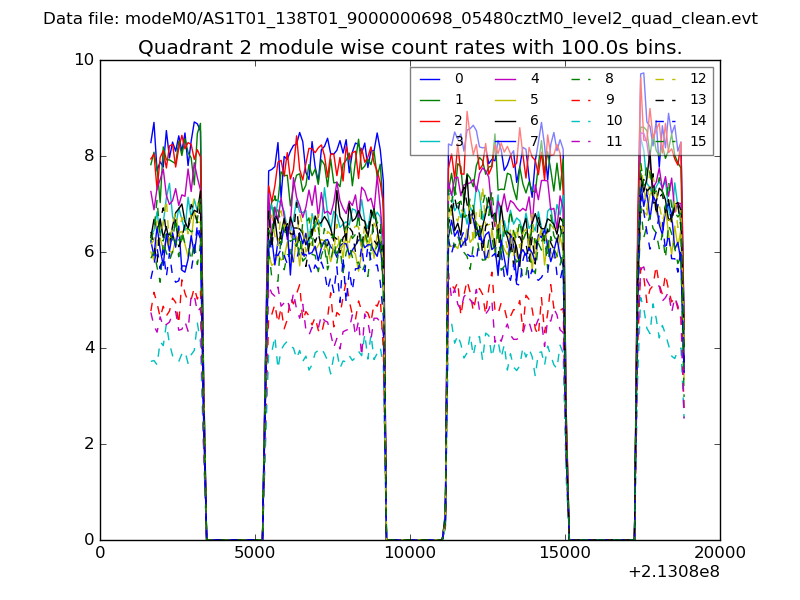
| Module-wise count rates for Quadrant B Data is divided into 100 sec bins |
 |
 |
| Module-wise count rates for Quadrant C Data is divided into 100 sec bins |
 |
 |
| Module-wise count rates for Quadrant D Data is divided into 100 sec bins |
 |
 |
| Parameter | Plot |
|---|---|
| CZT HV Monitor | 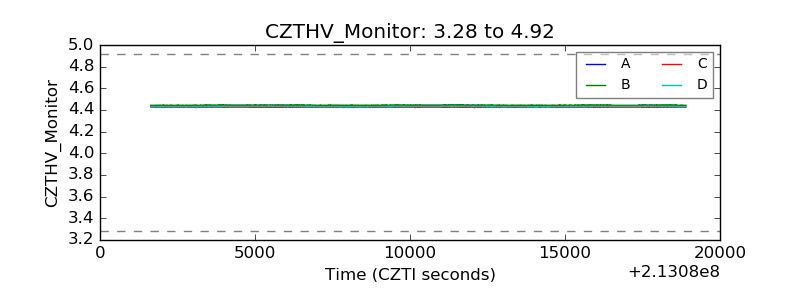 |
| D_VDD | 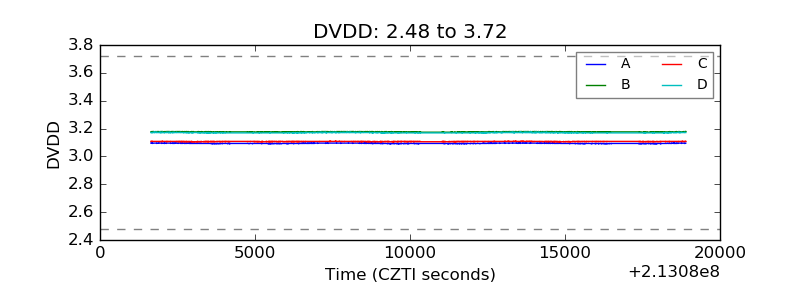 |
| Temperature 1 | 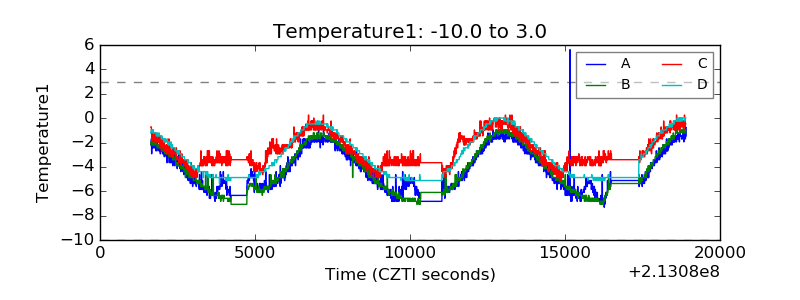 |
| Veto HV Monitor | 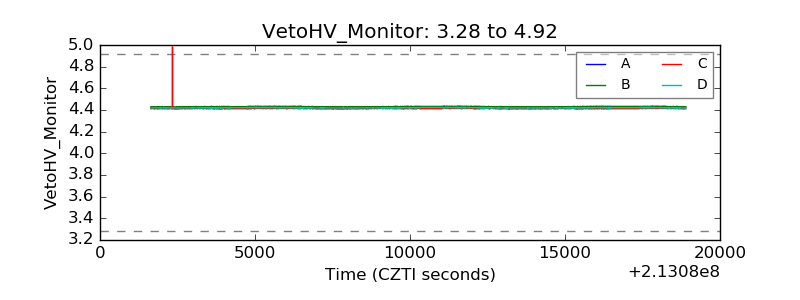 |
| Veto LLD | 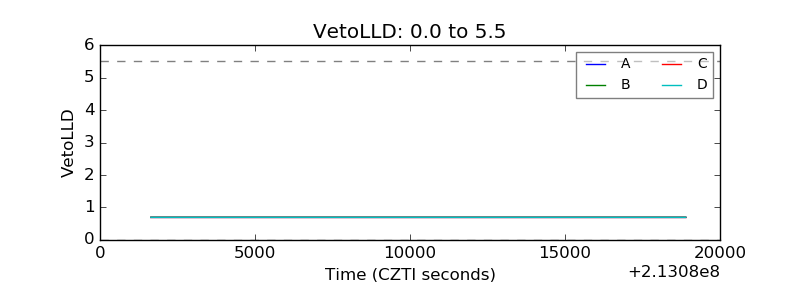 |
| Alpha Counter | 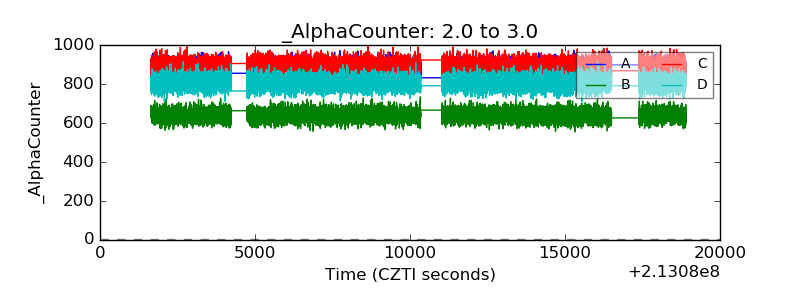 |
| _CPM_Rate | 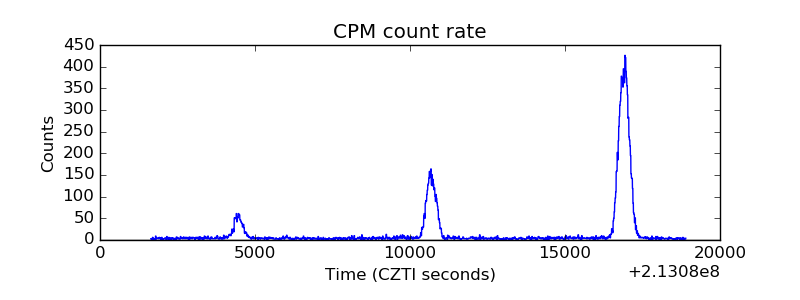 |
| CZT Counter | 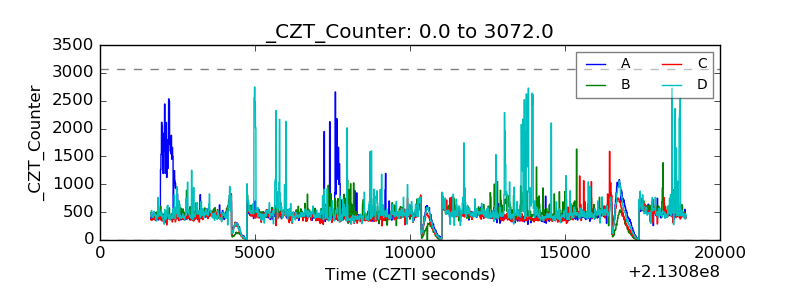 |
| +2.5 Volts monitor |  |
| +5 Volts monitor | 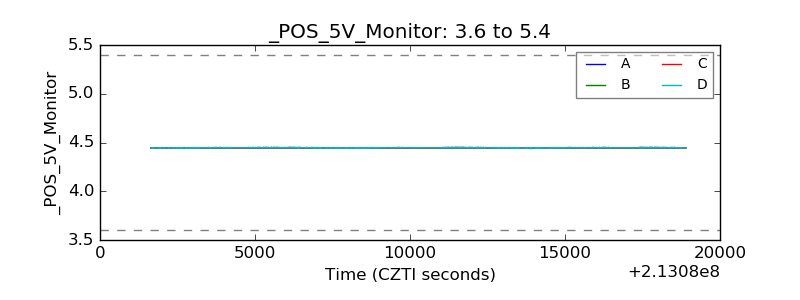 |
| _ROLL_ROT | 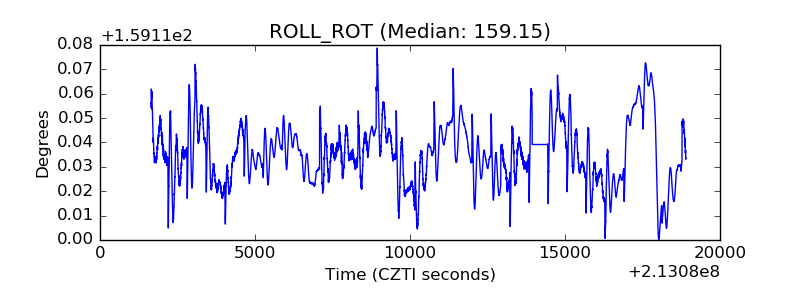 |
| _Roll_DEC |  |
| _Roll_RA | 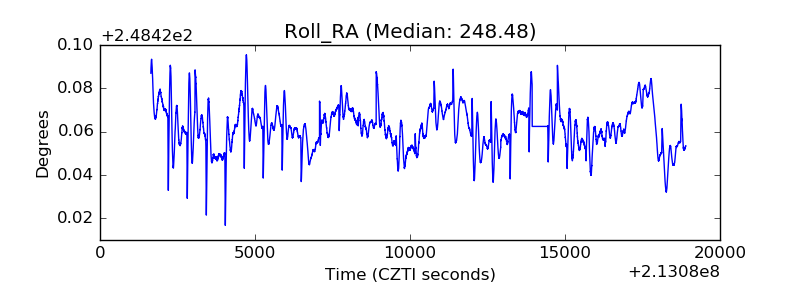 |
| Veto Counter | 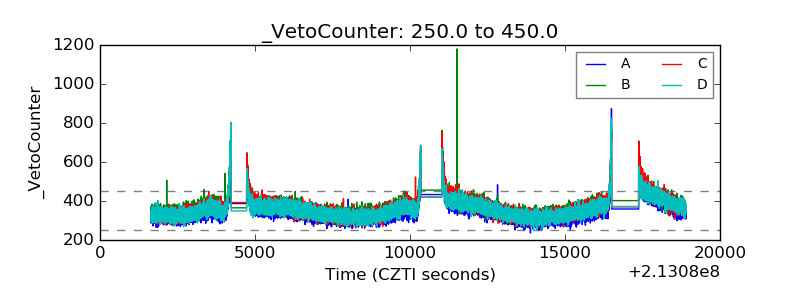 |