| Param | Original file | Final file |
|---|---|---|
| Filename | modeM0/AS1T01_138T01_9000000698_05481cztM0_level2.evt | modeM0/AS1T01_138T01_9000000698_05481cztM0_level2_quad_clean.evt |
| Size (bytes) | 206,239,680 | 47,805,120 |
| Size | 196.7 MB | 45.6 MB |
| Events in quadrant A | 1,552,744 | 307,003 |
| Events in quadrant B | 1,629,536 | 308,783 |
| Events in quadrant C | 1,312,852 | 311,927 |
| Events in quadrant D | 1,540,028 | 300,982 |
| Mode SS | |||
|---|---|---|---|
| Quadrant | BADHDUFLAG | Total packets | Discarded packets |
| A | 0 | 62 | 0 |
| B | 0 | 62 | 0 |
| C | 0 | 62 | 0 |
| D | 0 | 62 | 0 |
| Mode M0 | |||
|---|---|---|---|
| Quadrant | BADHDUFLAG | Total packets | Discarded packets |
| A | 0 | 6810 | 0 |
| B | 0 | 6842 | 0 |
| C | 0 | 6282 | 0 |
| D | 0 | 6851 | 0 |
| Quadrant | Total seconds | Saturated seconds | Saturation percentage |
|---|---|---|---|
| A | 3069 | 54 | 1.759531% |
| B | 3069 | 9 | 0.293255% |
| C | 3069 | 16 | 0.521342% |
| D | 3069 | 50 | 1.629195% |
Noise dominated data is calculated using 1-second bins in cleaned event files. If a bin has >2000 counts, and if more than 50% of those come from <1% of pixels, then it is considered to be noise-dominated and hence unusable.
| Quadrant | # 1 sec bins | Bins with >0 counts | Bins with >2000 counts | High rate bins dominated by noise | Noise dominated (total time) | Noise dominated (detector-on time) | Marked lightcurve |
|---|---|---|---|---|---|---|---|
| A | 3069 | 3069 | 46 | 46 | 1.50% | 1.50% | 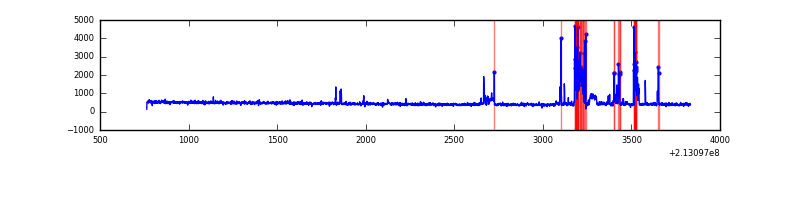 |
| B | 3069 | 3069 | 7 | 7 | 0.23% | 0.23% | 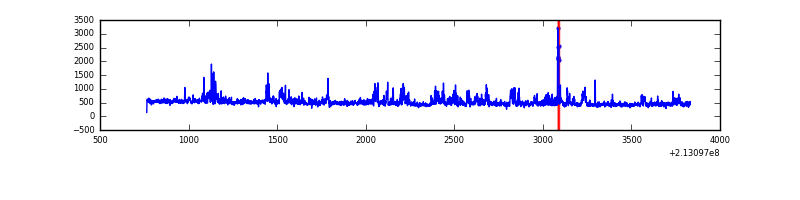 |
| C | 3069 | 3069 | 12 | 12 | 0.39% | 0.39% | 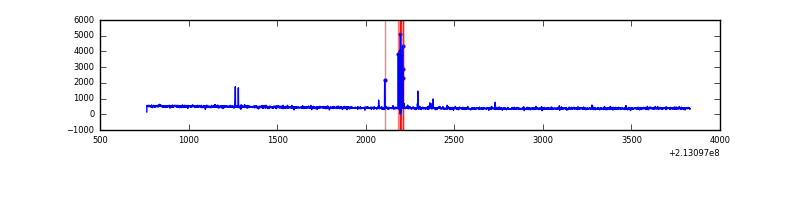 |
| D | 3069 | 3069 | 39 | 39 | 1.27% | 1.27% | 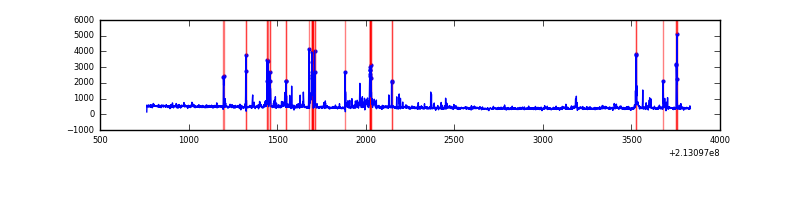 |
Top three noisy pixels from each quadrant. If the there are fewer than three noisy pixels in the level2.evt file, extra rows are filled as -1
| Pixel properties | Quadrant properties | ||||||
|---|---|---|---|---|---|---|---|
| Quadrant | DetID | PixID | Counts | Sigma | Mean | Median | Sigma |
| A | 0 | 50 | 165053 | 2353.71 | 334 | 326 | 70.0 |
| A | 15 | 174 | 95602 | 1361.35 | 334 | 326 | 70.0 |
| A | 13 | 6 | 4015 | 52.71 | 334 | 326 | 70.0 |
| B | 15 | 204 | 205164 | 3116.24 | 336 | 328 | 65.7 |
| B | 15 | 54 | 54613 | 825.86 | 336 | 328 | 65.7 |
| B | 11 | 51 | 16701 | 249.09 | 336 | 328 | 65.7 |
| C | 1 | 241 | 45964 | 606.66 | 319 | 321 | 75.2 |
| C | 9 | 247 | 12998 | 168.49 | 319 | 321 | 75.2 |
| C | 1 | 16 | 5087 | 63.35 | 319 | 321 | 75.2 |
| D | 2 | 33 | 157101 | 1956.38 | 323 | 312 | 80.1 |
| D | 10 | 15 | 47024 | 582.86 | 323 | 312 | 80.1 |
| D | 8 | 195 | 27041 | 333.52 | 323 | 312 | 80.1 |
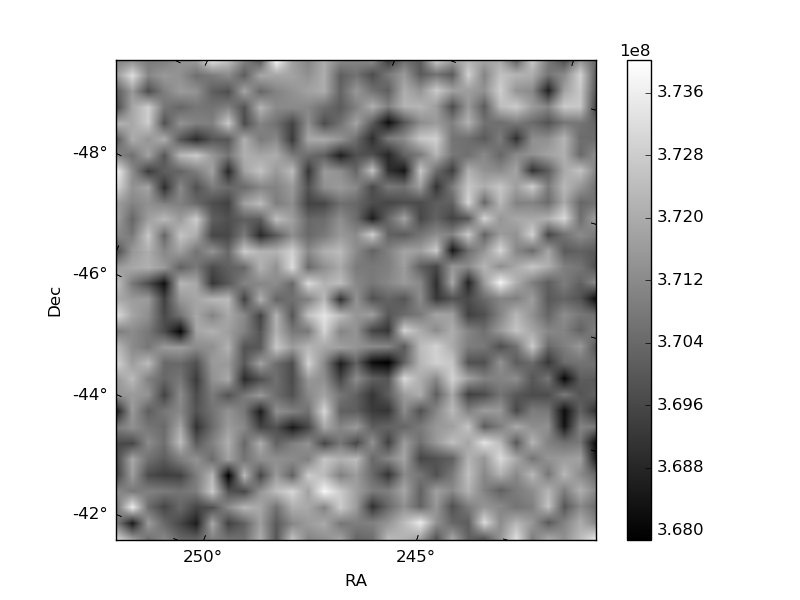
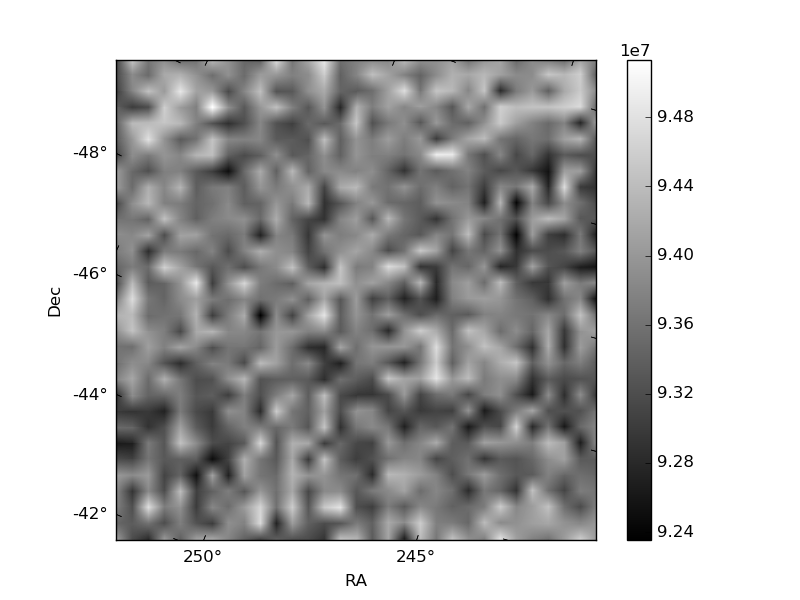
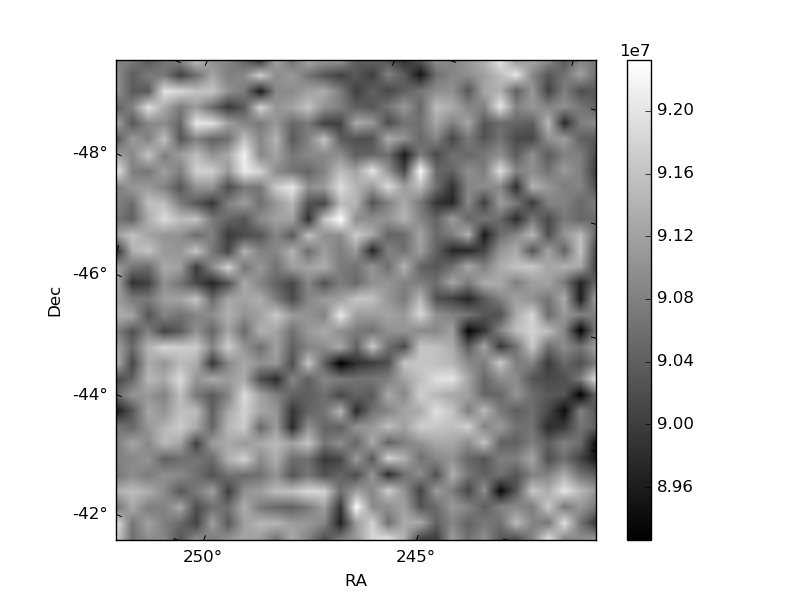
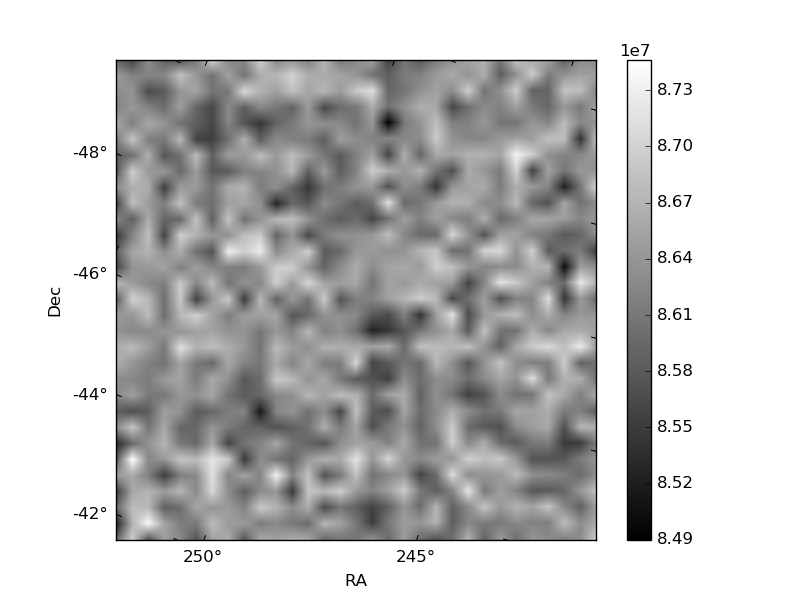
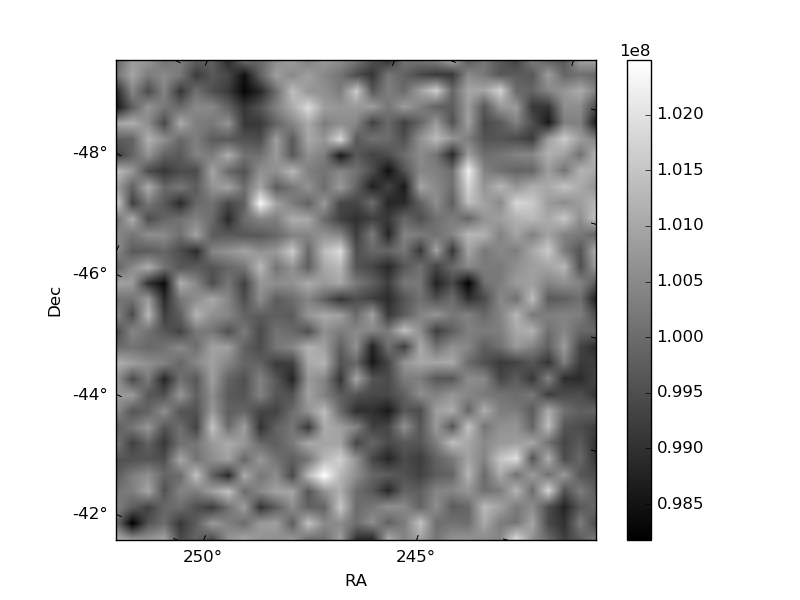
Histogram calculated using DETX and DETY for each event in the final _common_clean file
| Quadrant A | 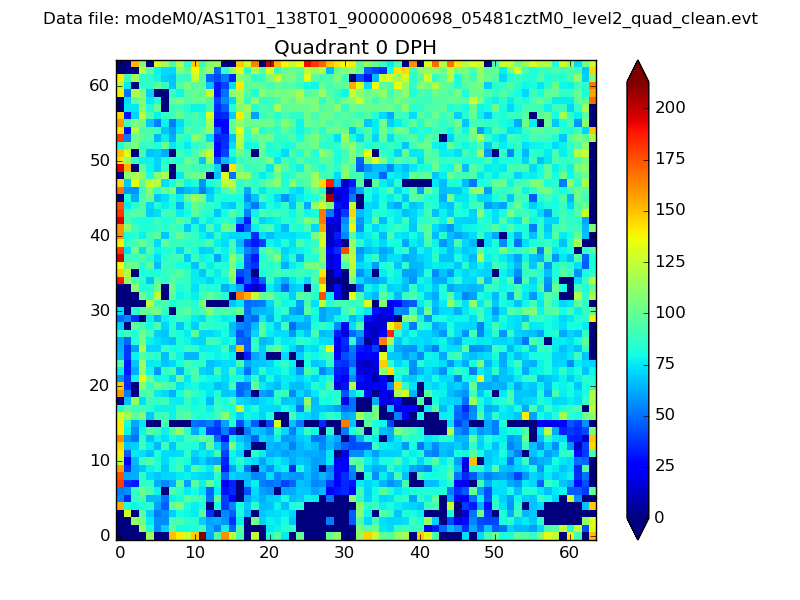 |
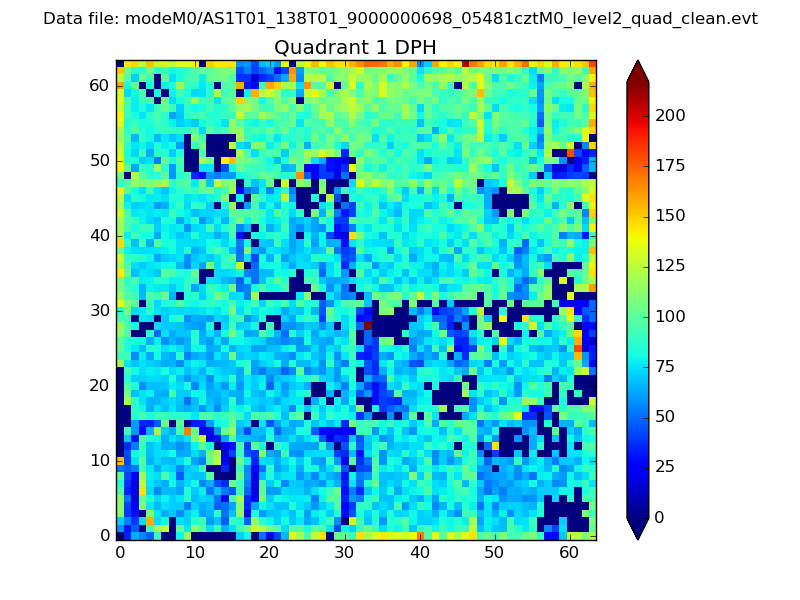 |
Quadrant B |
|---|---|---|---|
| Quadrant D | 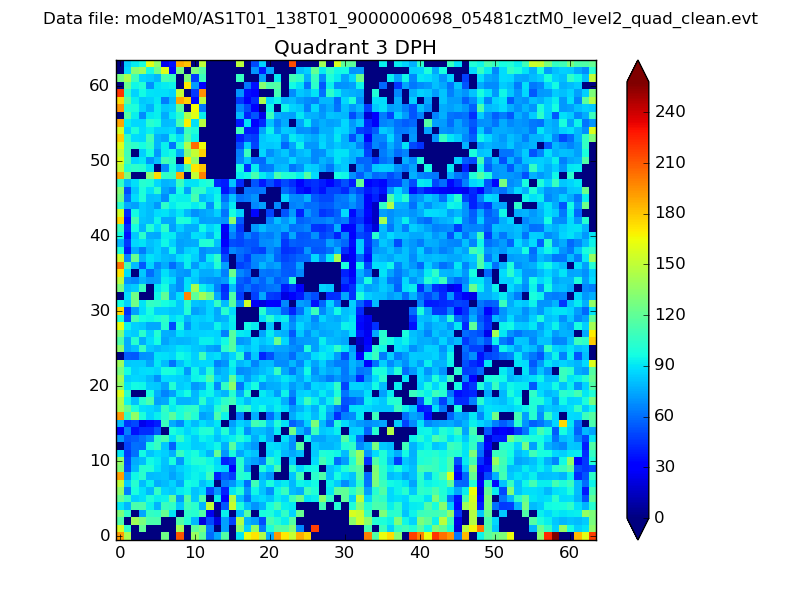 |
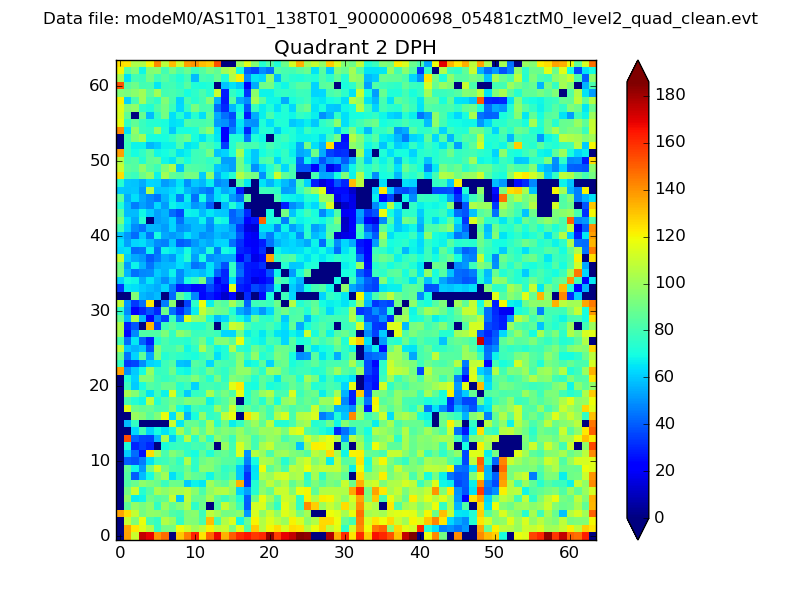 |
Quadrant C |
| Plot type | Count rate plots | Images |
|---|---|---|
| Comparison with Poisson distribution Blue bars denote a histogram of data divided into 1 sec bins. Red curve is a Poisson curve with rate = median count rate of data. |
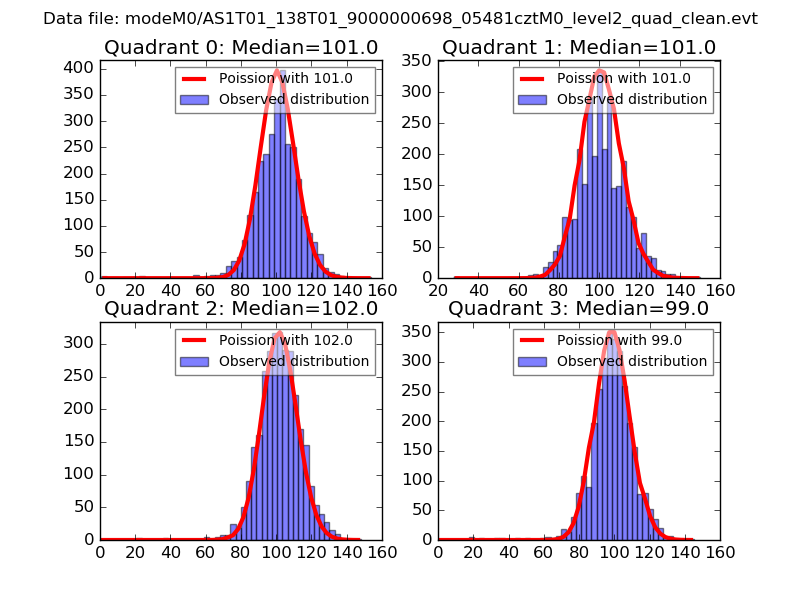 |
 |
| Quadrant-wise count rates Data is divided into 100 sec bins |
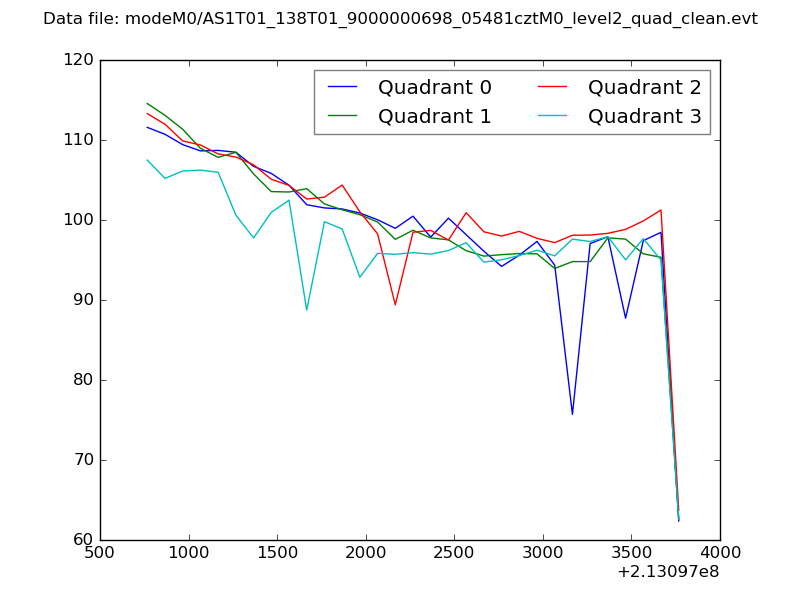 |
|
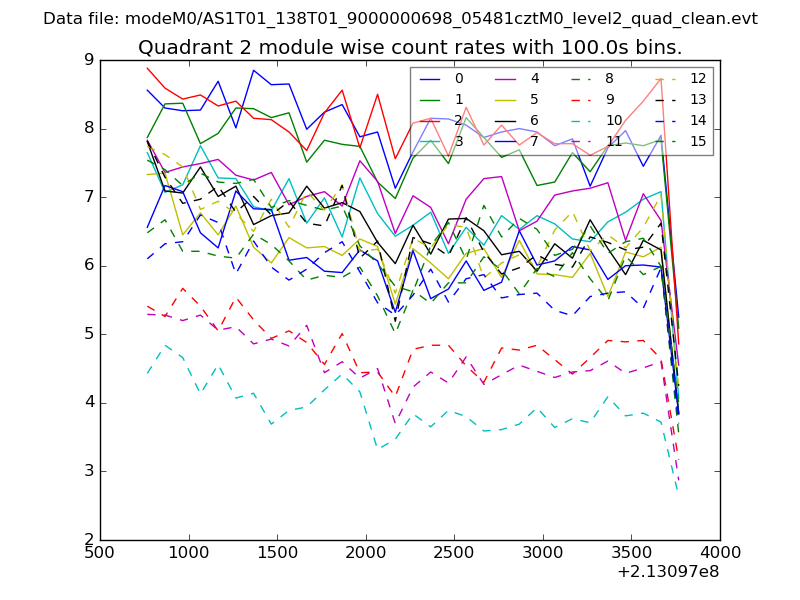
| Module-wise count rates for Quadrant A Data is divided into 100 sec bins |
 |
 |
| Module-wise count rates for Quadrant B Data is divided into 100 sec bins |
 |
 |
| Module-wise count rates for Quadrant C Data is divided into 100 sec bins |
 |
 |
| Module-wise count rates for Quadrant D Data is divided into 100 sec bins |
 |
 |
| Parameter | Plot |
|---|---|
| CZT HV Monitor |  |
| D_VDD | 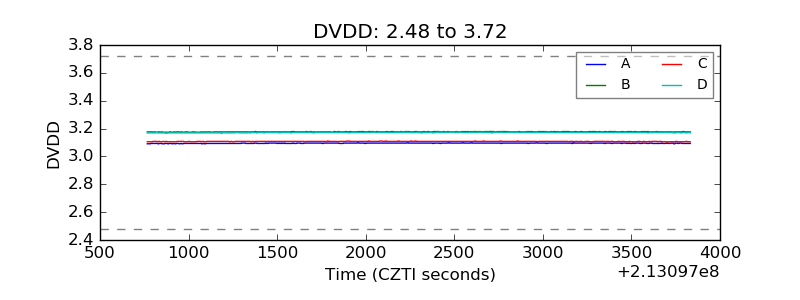 |
| Temperature 1 | 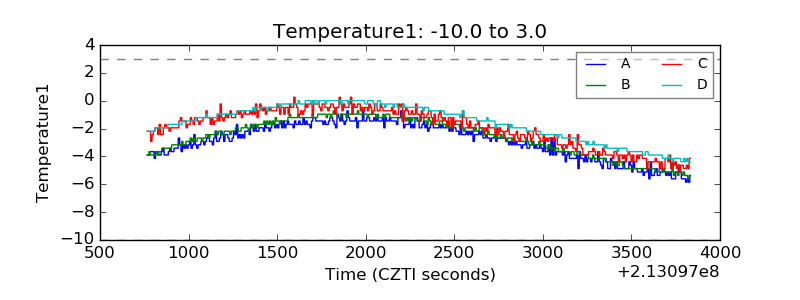 |
| Veto HV Monitor | 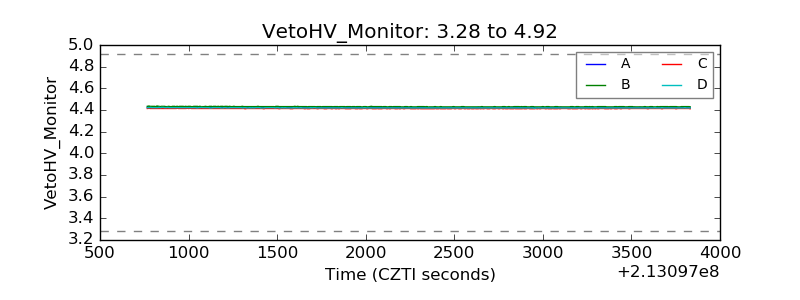 |
| Veto LLD | 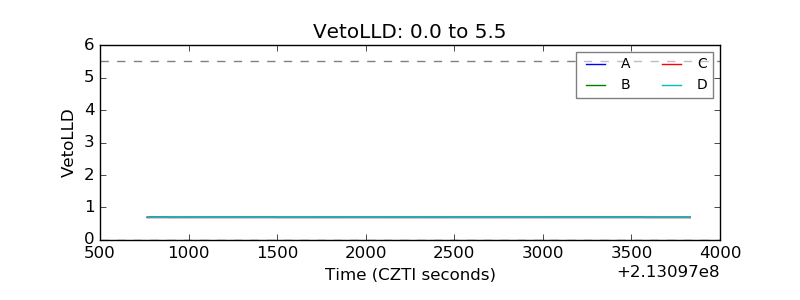 |
| Alpha Counter | 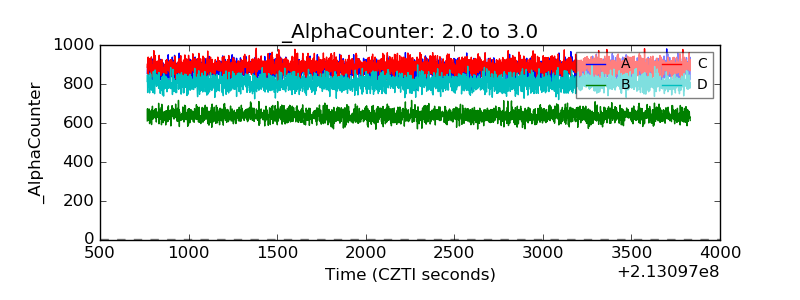 |
| _CPM_Rate | 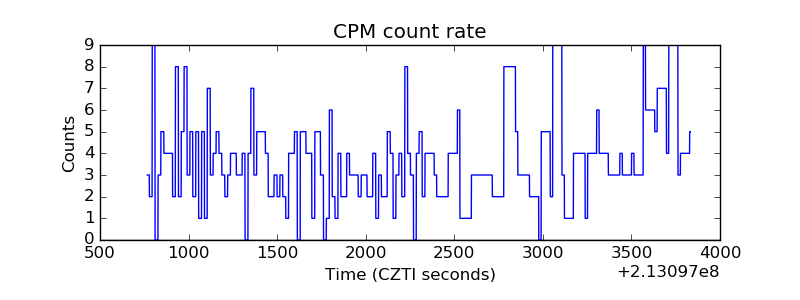 |
| CZT Counter | 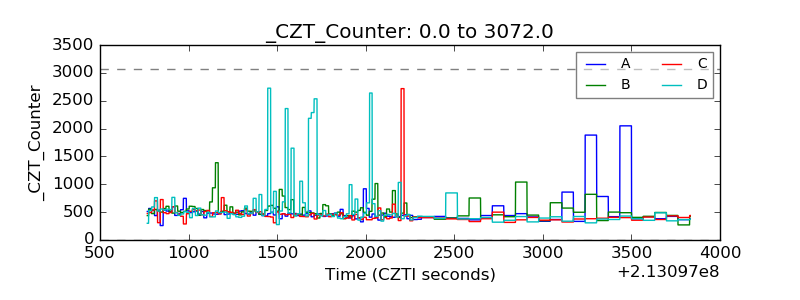 |
| +2.5 Volts monitor |  |
| +5 Volts monitor |  |
| _ROLL_ROT | 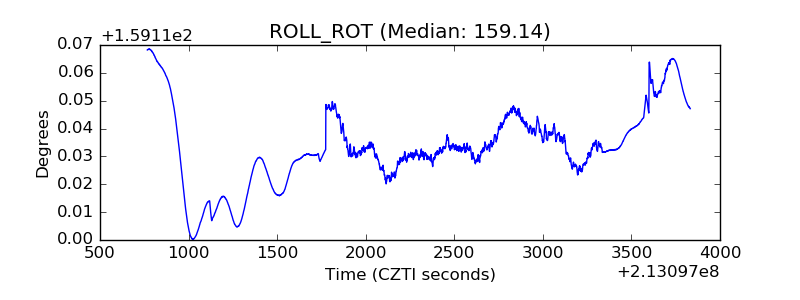 |
| _Roll_DEC | 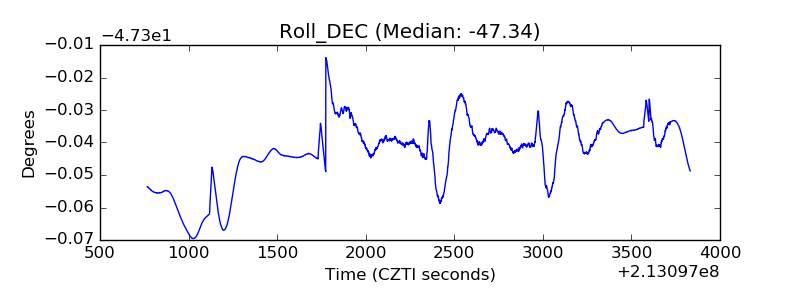 |
| _Roll_RA | 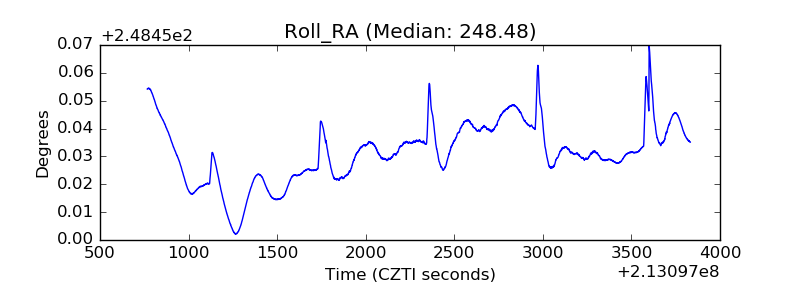 |
| Veto Counter | 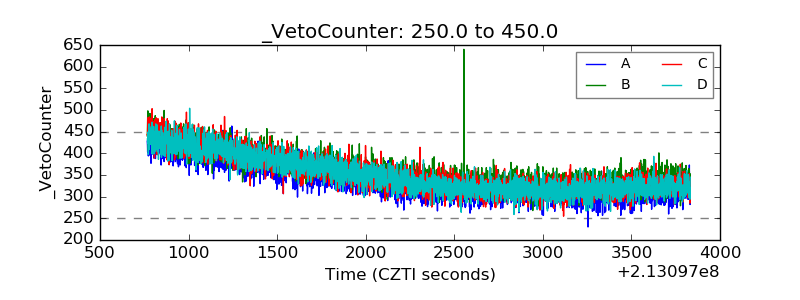 |