| Param | Original file | Final file |
|---|---|---|
| Filename | modeM0/AS1A02_063T01_9000000702cztM0_level2.fits | modeM0/AS1A02_063T01_9000000702cztM0_level2_quad_clean.evt |
| Size (bytes) | 366,704,640 | 394,738,560 |
| Size | 349.7 MB | 376.5 MB |
| Events in quadrant A | 2,205,152 | 2,420,064 |
| Events in quadrant B | 2,102,444 | 2,419,117 |
| Events in quadrant C | 2,108,129 | 2,198,806 |
| Events in quadrant D | 1,857,046 | 2,087,025 |
| Mode M0 | |||
|---|---|---|---|
| Quadrant | BADHDUFLAG | Total packets | Discarded packets |
| A | 0 | 84418 | 0 |
| B | 0 | 91935 | 0 |
| C | 0 | 97895 | 0 |
| D | 0 | 90115 | 0 |
| Mode M9 | |||
|---|---|---|---|
| Quadrant | BADHDUFLAG | Total packets | Discarded packets |
| A | 0 | 43 | 0 |
| B | 0 | 42 | 0 |
| C | 0 | 41 | 0 |
| D | 0 | 44 | 0 |
| Mode SS | |||
|---|---|---|---|
| Quadrant | BADHDUFLAG | Total packets | Discarded packets |
| A | 0 | 842 | 0 |
| B | 0 | 835 | 0 |
| C | 0 | 844 | 0 |
| D | 0 | 836 | 0 |
| Quadrant | Total seconds | Saturated seconds | Saturation percentage |
|---|---|---|---|
| A | 41349 | 397 | 0.960120% |
| B | 41106 | 583 | 1.418284% |
| C | 41109 | 1675 | 4.074534% |
| D | 41190 | 576 | 1.398398% |
Noise dominated data is calculated using 1-second bins in cleaned event files. If a bin has >2000 counts, and if more than 50% of those come from <1% of pixels, then it is considered to be noise-dominated and hence unusable.
| Quadrant | # 1 sec bins | Bins with >0 counts | Bins with >2000 counts | High rate bins dominated by noise | Noise dominated (total time) | Noise dominated (detector-on time) | Marked lightcurve |
|---|---|---|---|---|---|---|---|
| A | 50637 | 43127 | 0 | 0 | 0.00% | 0.00% |  |
| B | 50637 | 42929 | 0 | 0 | 0.00% | 0.00% | 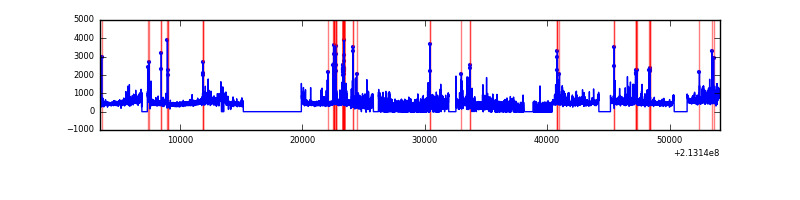 |
| C | 50637 | 42968 | 0 | 0 | 0.00% | 0.00% |  |
| D | 50637 | 43038 | 0 | 0 | 0.00% | 0.00% |  |
Top three noisy pixels from each quadrant. If the there are fewer than three noisy pixels in the level2.evt file, extra rows are filled as -1
| Pixel properties | Quadrant properties | ||||||
|---|---|---|---|---|---|---|---|
| Quadrant | DetID | PixID | Counts | Sigma | Mean | Median | Sigma |
| A | 14 | 188 | 2170 | 11.08 | 570 | 530 | 148.0 |
| A | 0 | 29 | 2131 | 10.81 | 570 | 530 | 148.0 |
| A | 14 | 204 | 1922 | 9.4 | 570 | 530 | 148.0 |
| B | 2 | 9 | 1870 | 11.7 | 555 | 525 | 115.0 |
| B | 14 | 254 | 1554 | 8.95 | 555 | 525 | 115.0 |
| B | 12 | 226 | 1499 | 8.47 | 555 | 525 | 115.0 |
| C | 1 | 80 | 1454 | 6.27 | 556 | 512 | 150.2 |
| C | 1 | 81 | 1447 | 6.22 | 556 | 512 | 150.2 |
| C | 12 | 241 | 1432 | 6.12 | 556 | 512 | 150.2 |
| D | 11 | 82 | 1425 | 6.67 | 528 | 479 | 141.9 |
| D | 3 | 14 | 1382 | 6.36 | 528 | 479 | 141.9 |
| D | 1 | 19 | 1380 | 6.35 | 528 | 479 | 141.9 |
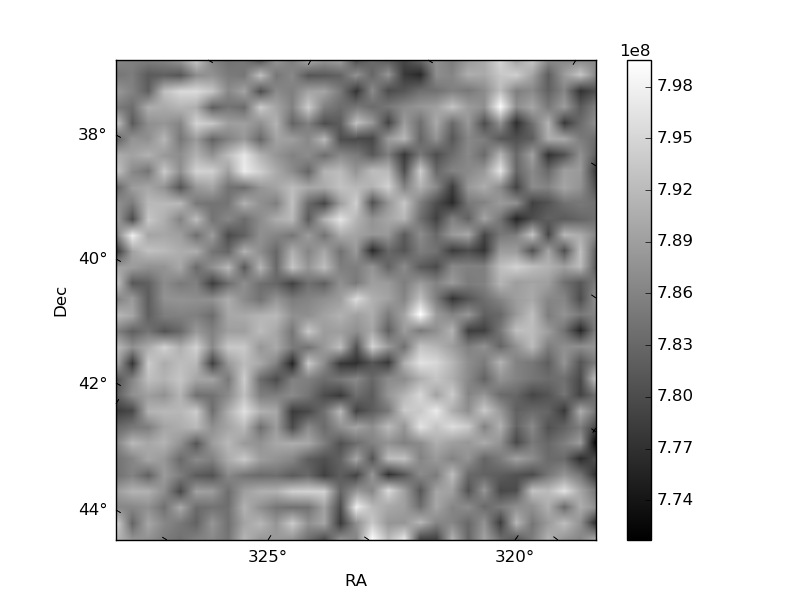
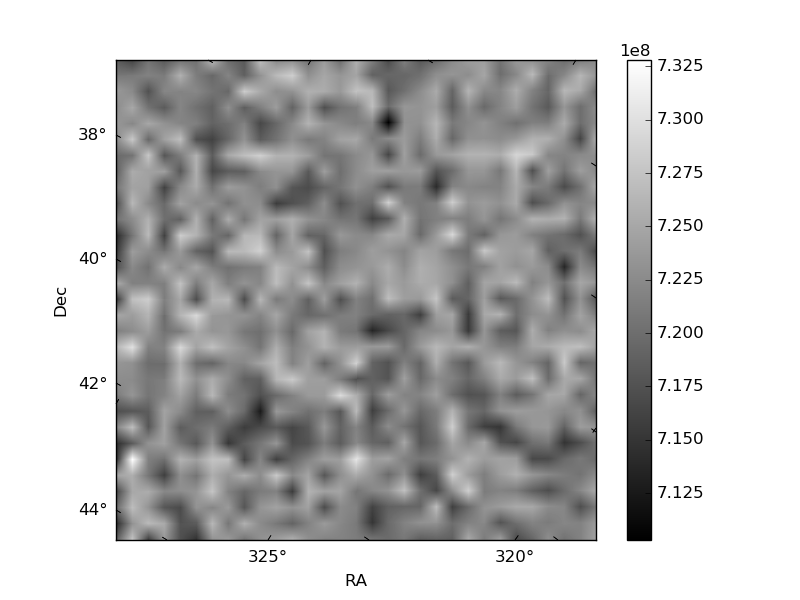
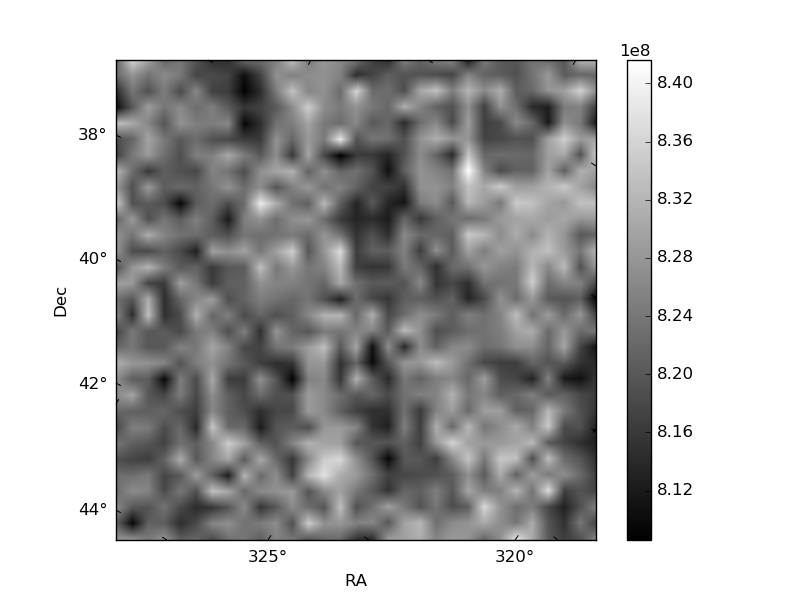
Histogram calculated using DETX and DETY for each event in the final _common_clean file
| Quadrant A | 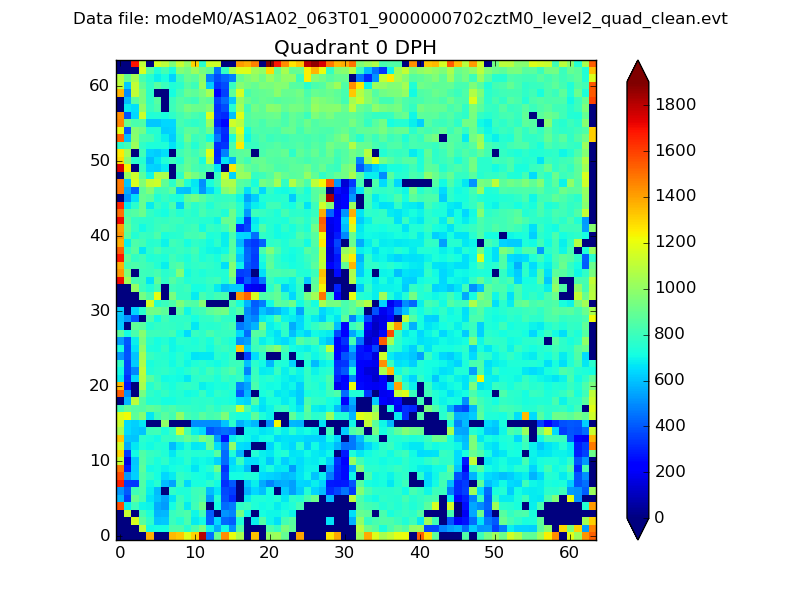 |
 |
Quadrant B |
|---|---|---|---|
| Quadrant D | 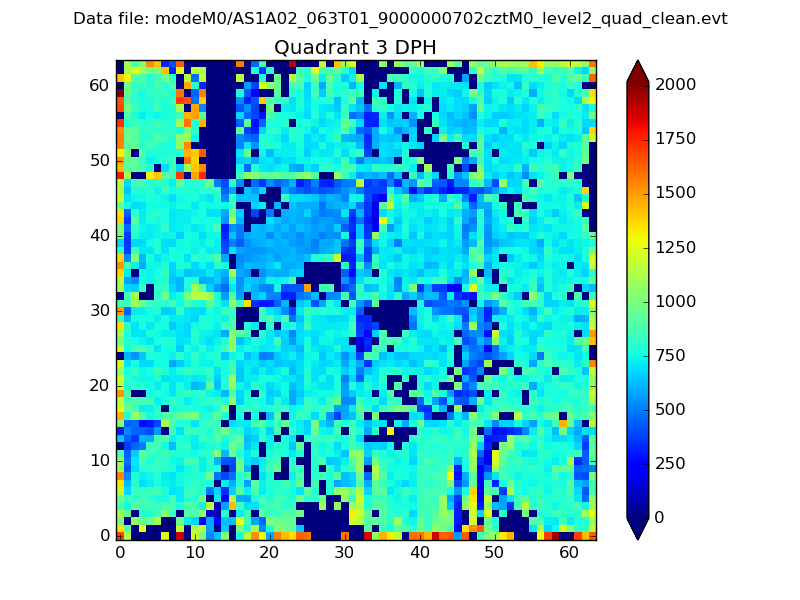 |
 |
Quadrant C |
| Plot type | Count rate plots | Images |
|---|---|---|
| Comparison with Poisson distribution Blue bars denote a histogram of data divided into 1 sec bins. Red curve is a Poisson curve with rate = median count rate of data. |
 |
 |
| Quadrant-wise count rates Data is divided into 100 sec bins |
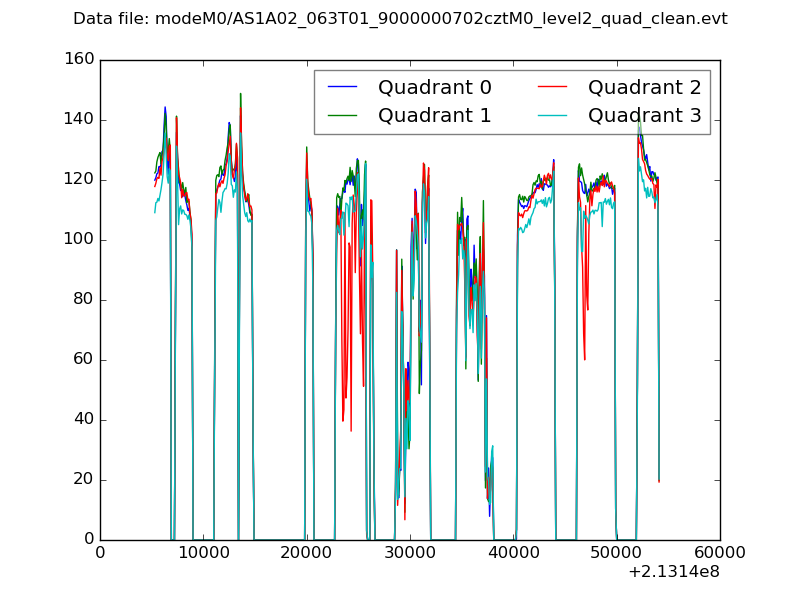 |
|
| Module-wise count rates for Quadrant A Data is divided into 100 sec bins |
 |
 |
| Module-wise count rates for Quadrant B Data is divided into 100 sec bins |
 |
 |
| Module-wise count rates for Quadrant C Data is divided into 100 sec bins |
 |
 |
| Module-wise count rates for Quadrant D Data is divided into 100 sec bins |
 |
 |
| Parameter | Plot |
|---|---|
| CZT HV Monitor |  |
| D_VDD | 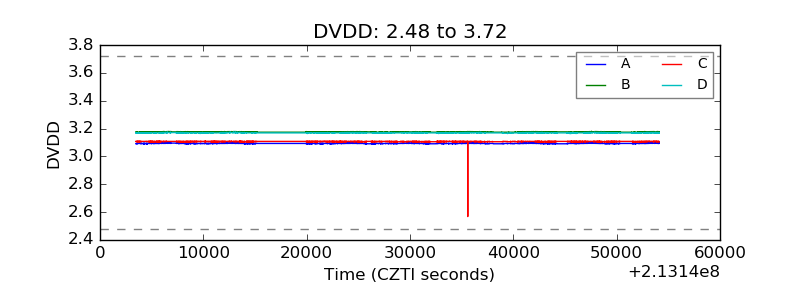 |
| Temperature 1 |  |
| Veto HV Monitor |  |
| Veto LLD |  |
| Alpha Counter |  |
| _CPM_Rate |  |
| CZT Counter |  |
| +2.5 Volts monitor |  |
| +5 Volts monitor |  |
| _ROLL_ROT |  |
| _Roll_DEC |  |
| _Roll_RA | 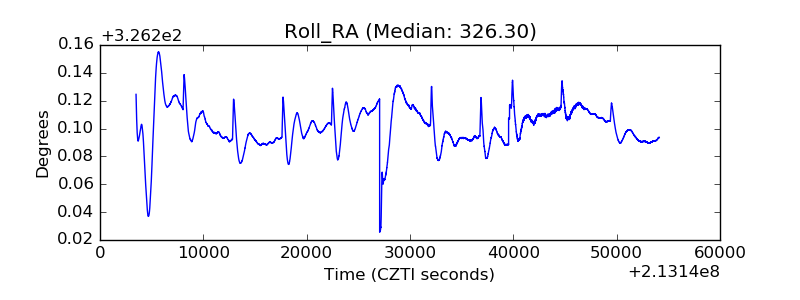 |
| Veto Counter |  |