| Param | Original file | Final file |
|---|---|---|
| Filename | modeM0/AS1A02_063T01_9000000702_05490cztM0_level2.evt | modeM0/AS1A02_063T01_9000000702_05490cztM0_level2_quad_clean.evt |
| Size (bytes) | 436,498,560 | 76,245,120 |
| Size | 416.3 MB | 72.7 MB |
| Events in quadrant A | 3,018,234 | 462,424 |
| Events in quadrant B | 3,404,542 | 466,258 |
| Events in quadrant C | 3,023,881 | 461,125 |
| Events in quadrant D | 3,302,057 | 436,806 |
| Mode M0 | |||
|---|---|---|---|
| Quadrant | BADHDUFLAG | Total packets | Discarded packets |
| A | 0 | 14173 | 15 |
| B | 0 | 15013 | 31 |
| C | 0 | 14195 | 10 |
| D | 0 | 14923 | 17 |
| Mode M9 | |||
|---|---|---|---|
| Quadrant | BADHDUFLAG | Total packets | Discarded packets |
| A | 0 | 2 | 0 |
| B | 0 | 2 | 0 |
| C | 0 | 2 | 0 |
| D | 0 | 2 | 0 |
| Mode SS | |||
|---|---|---|---|
| Quadrant | BADHDUFLAG | Total packets | Discarded packets |
| A | 0 | 138 | 0 |
| B | 0 | 138 | 0 |
| C | 0 | 138 | 0 |
| D | 0 | 138 | 0 |
| Quadrant | Total seconds | Saturated seconds | Saturation percentage |
|---|---|---|---|
| A | 6928 | 38 | 0.548499% |
| B | 6924 | 81 | 1.169844% |
| C | 6930 | 27 | 0.389610% |
| D | 6927 | 59 | 0.851740% |
Noise dominated data is calculated using 1-second bins in cleaned event files. If a bin has >2000 counts, and if more than 50% of those come from <1% of pixels, then it is considered to be noise-dominated and hence unusable.
| Quadrant | # 1 sec bins | Bins with >0 counts | Bins with >2000 counts | High rate bins dominated by noise | Noise dominated (total time) | Noise dominated (detector-on time) | Marked lightcurve |
|---|---|---|---|---|---|---|---|
| A | 7084 | 6936 | 0 | 0 | 0.00% | 0.00% | 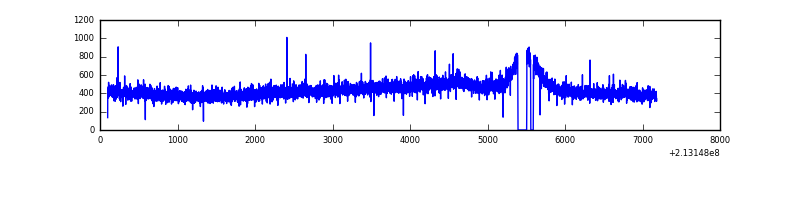 |
| B | 7084 | 6936 | 7 | 7 | 0.10% | 0.10% | 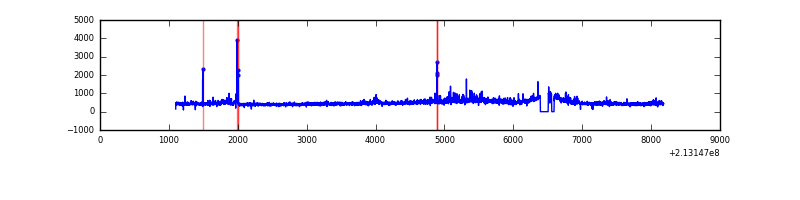 |
| C | 7084 | 6936 | 0 | 0 | 0.00% | 0.00% | 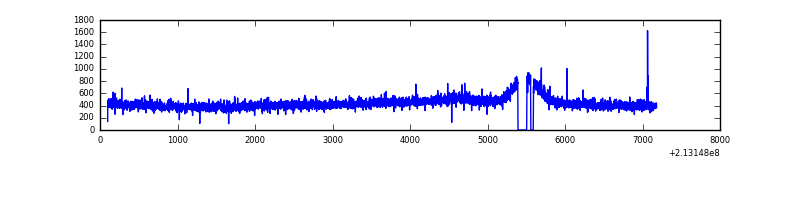 |
| D | 7084 | 6936 | 22 | 22 | 0.31% | 0.32% | 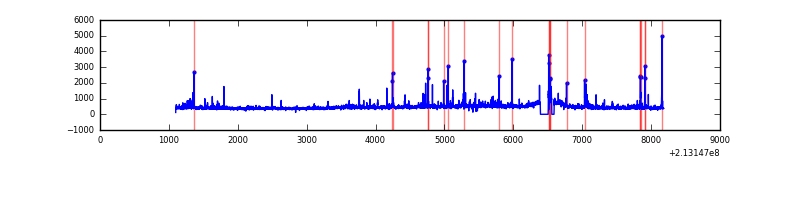 |
Top three noisy pixels from each quadrant. If the there are fewer than three noisy pixels in the level2.evt file, extra rows are filled as -1
| Pixel properties | Quadrant properties | ||||||
|---|---|---|---|---|---|---|---|
| Quadrant | DetID | PixID | Counts | Sigma | Mean | Median | Sigma |
| A | 12 | 194 | 7557 | 41.64 | 782 | 763 | 163.2 |
| A | 0 | 226 | 7540 | 41.54 | 782 | 763 | 163.2 |
| A | 13 | 6 | 7166 | 39.24 | 782 | 763 | 163.2 |
| B | 15 | 204 | 118438 | 759.31 | 797 | 776 | 155.0 |
| B | 10 | 16 | 66486 | 424.05 | 797 | 776 | 155.0 |
| B | 11 | 51 | 58183 | 370.46 | 797 | 776 | 155.0 |
| C | 9 | 247 | 10199 | 52.56 | 770 | 774 | 179.3 |
| C | 1 | 16 | 7152 | 35.57 | 770 | 774 | 179.3 |
| C | 13 | 61 | 6234 | 30.45 | 770 | 774 | 179.3 |
| D | 2 | 152 | 135192 | 715.02 | 761 | 737 | 188.0 |
| D | 8 | 195 | 68333 | 359.47 | 761 | 737 | 188.0 |
| D | 2 | 136 | 39924 | 208.39 | 761 | 737 | 188.0 |
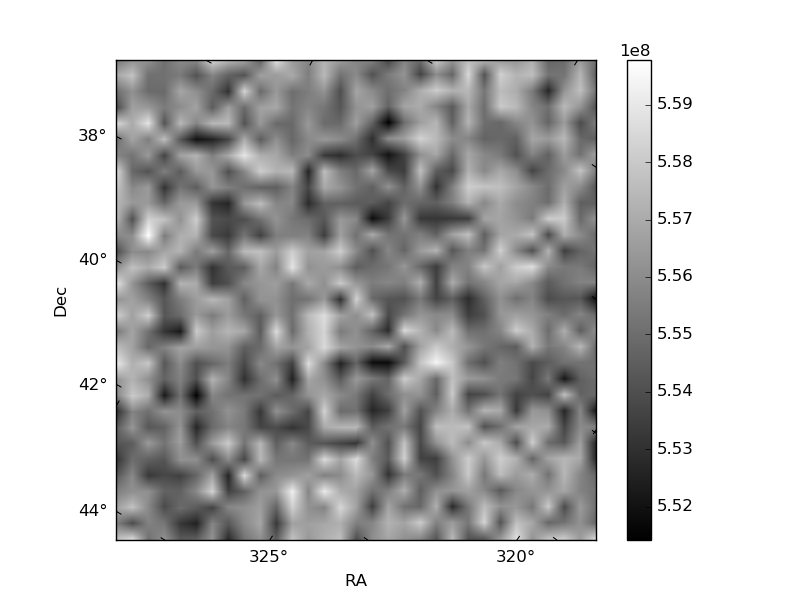
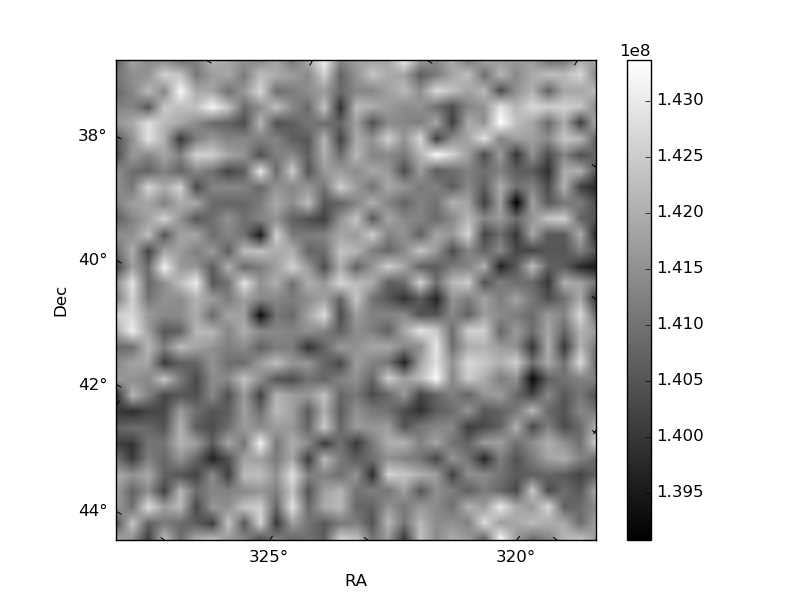
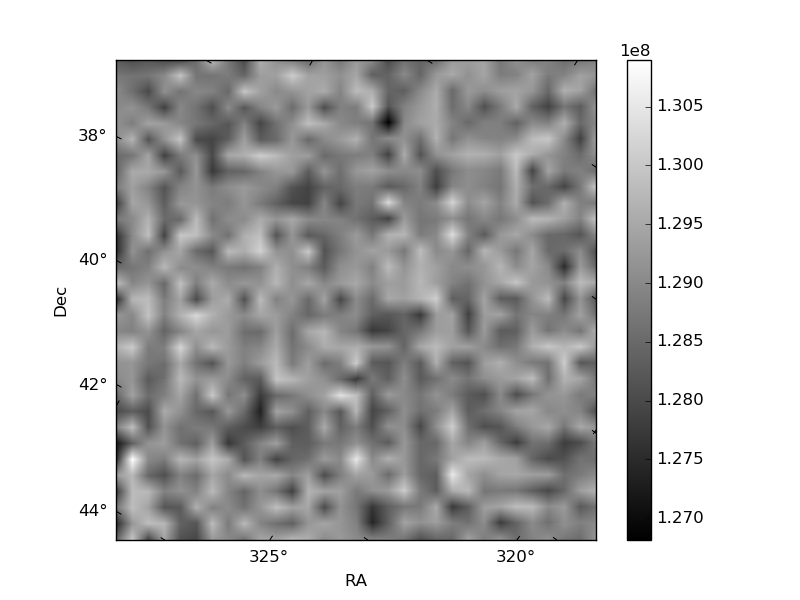
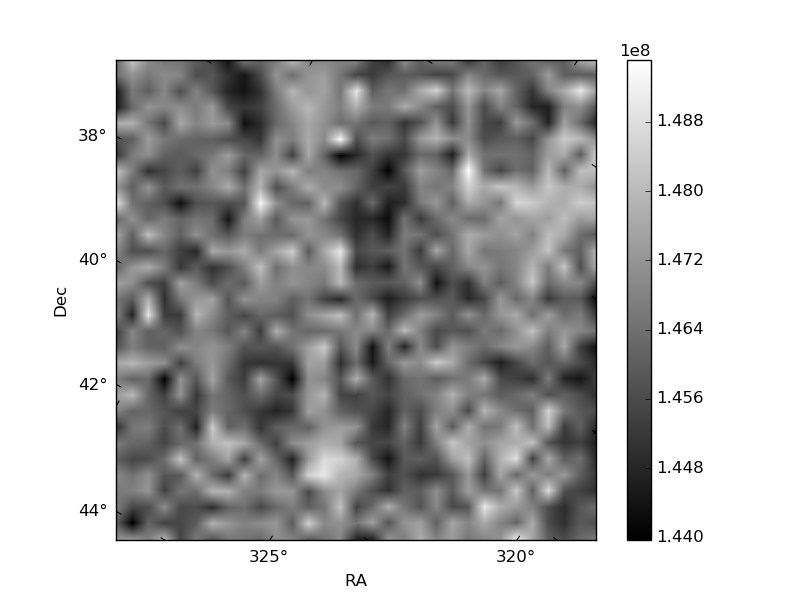
Histogram calculated using DETX and DETY for each event in the final _common_clean file
| Quadrant A | 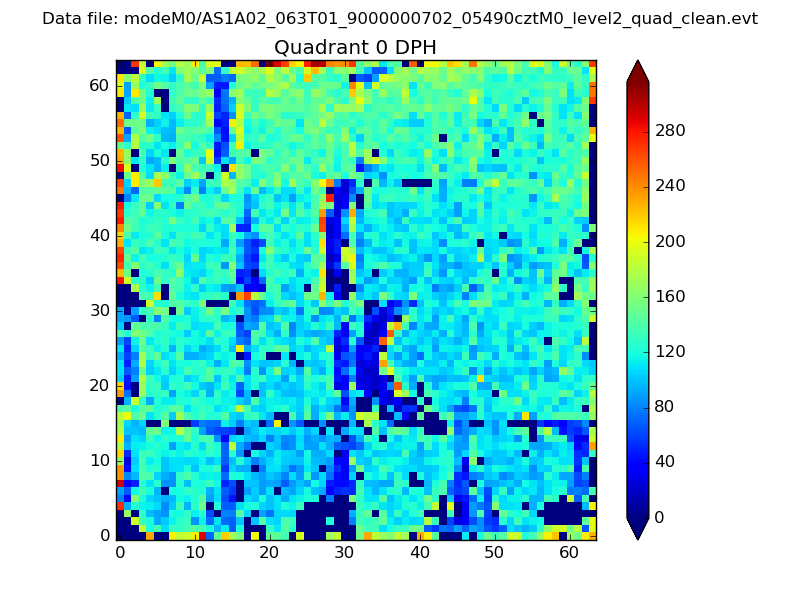 |
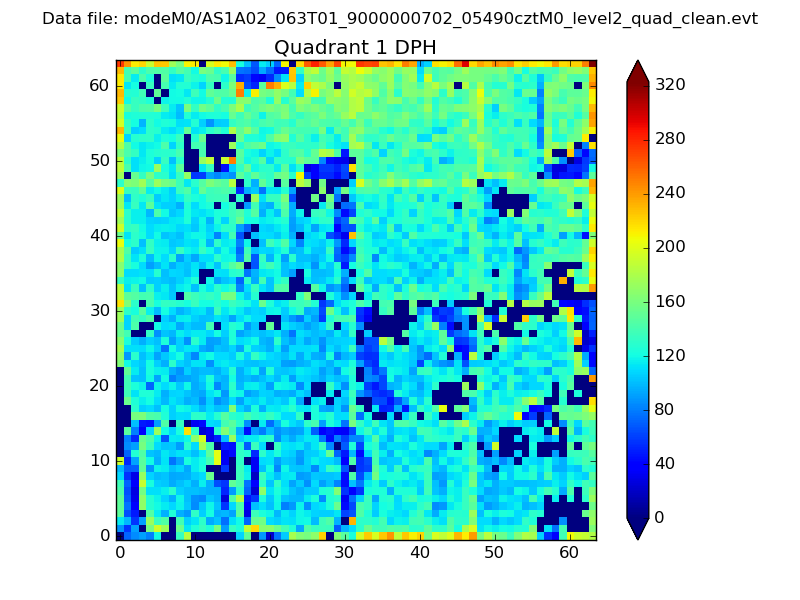 |
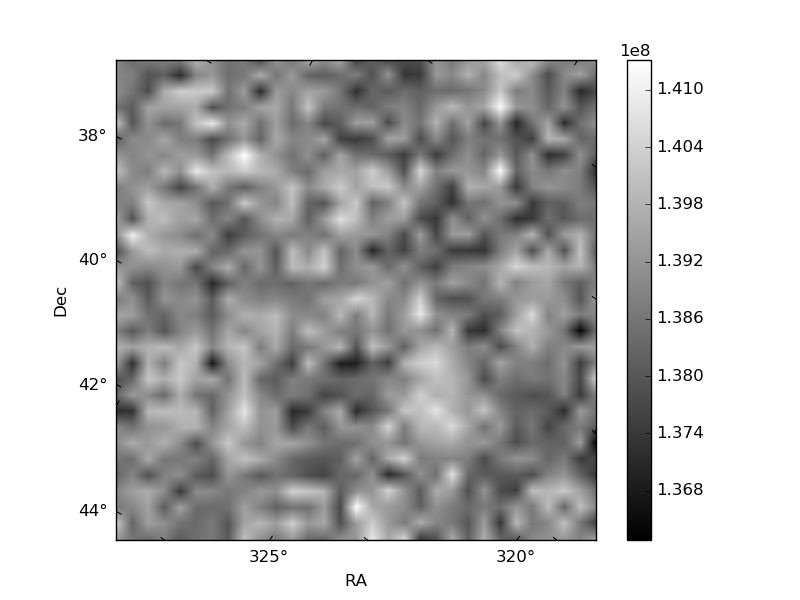
Quadrant B |
|---|---|---|---|
| Quadrant D | 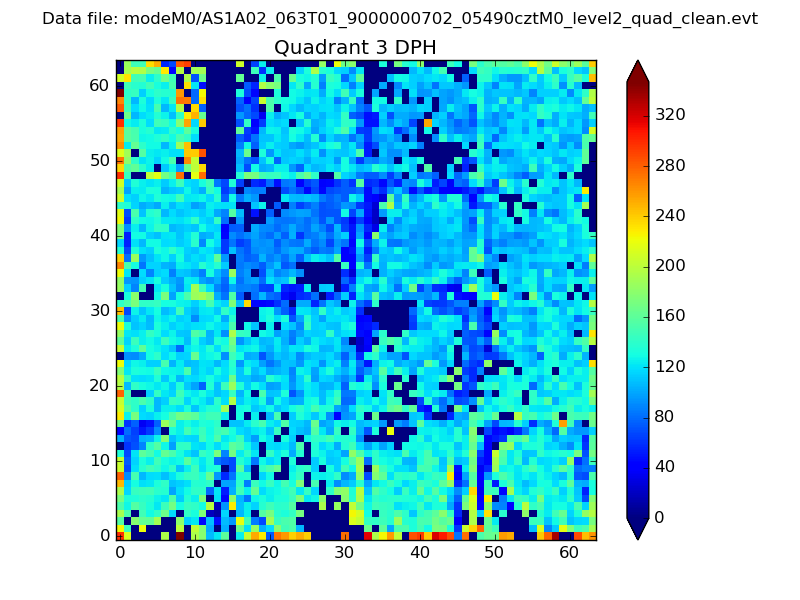 |
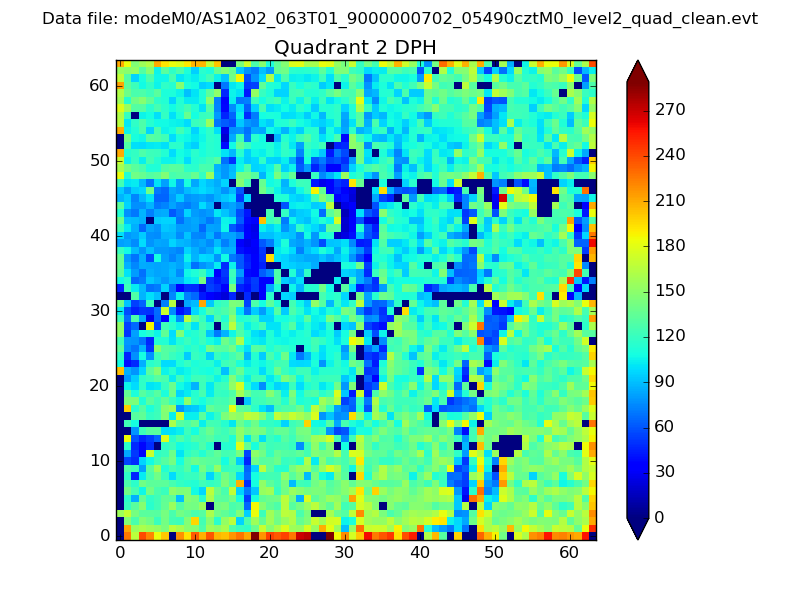 |
Quadrant C |
| Plot type | Count rate plots | Images |
|---|---|---|
| Comparison with Poisson distribution Blue bars denote a histogram of data divided into 1 sec bins. Red curve is a Poisson curve with rate = median count rate of data. |
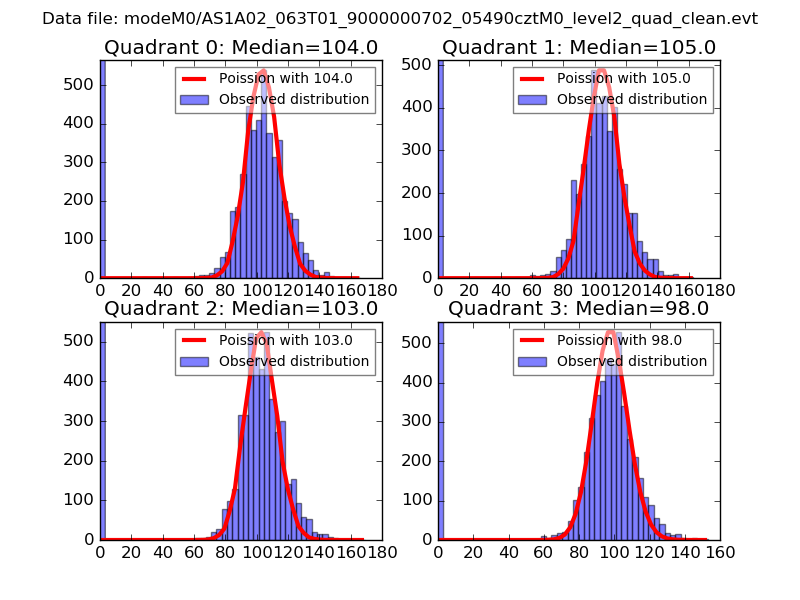 |
 |
| Quadrant-wise count rates Data is divided into 100 sec bins |
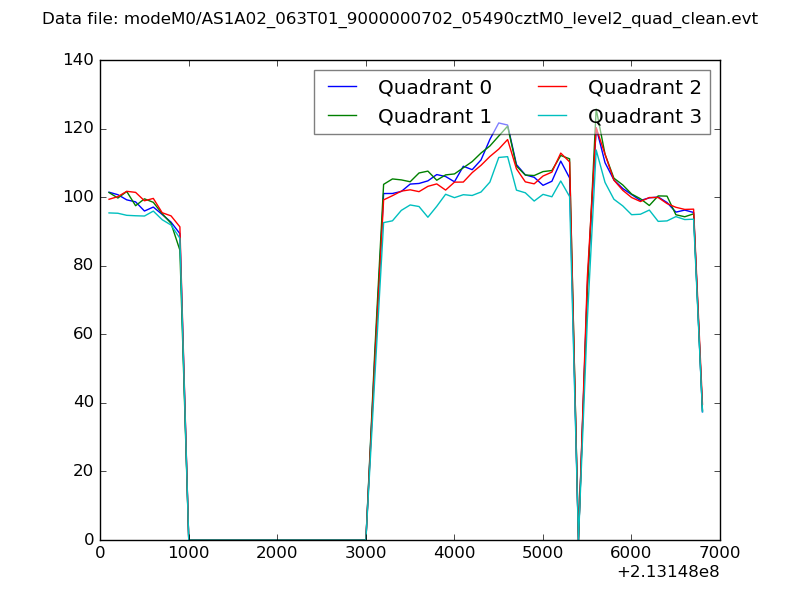 |
|
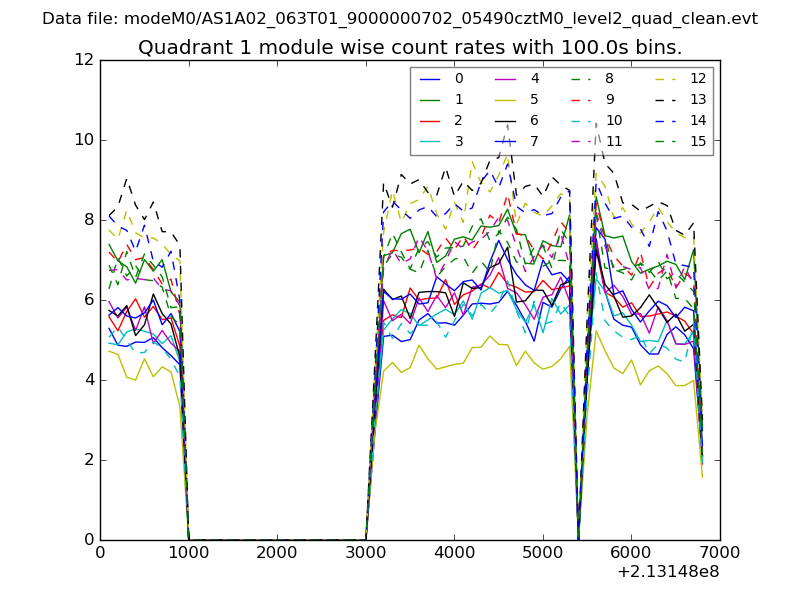
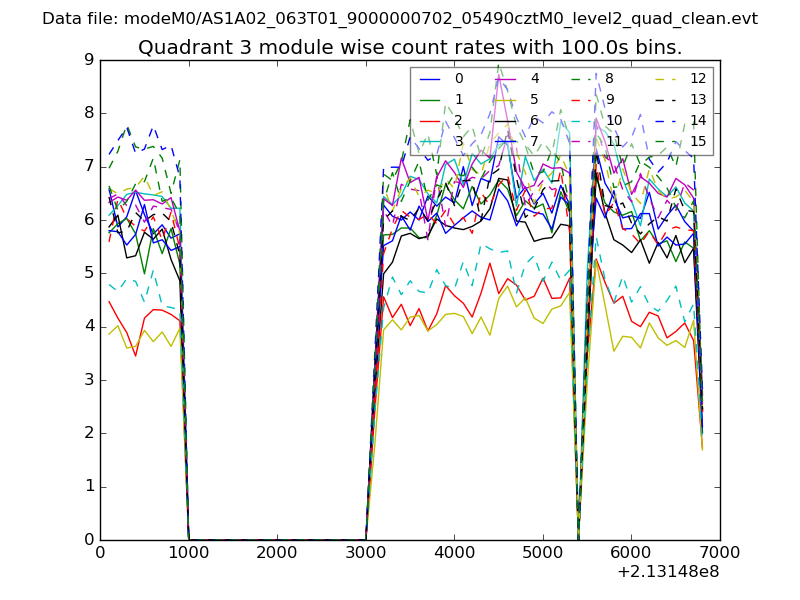
| Module-wise count rates for Quadrant A Data is divided into 100 sec bins |
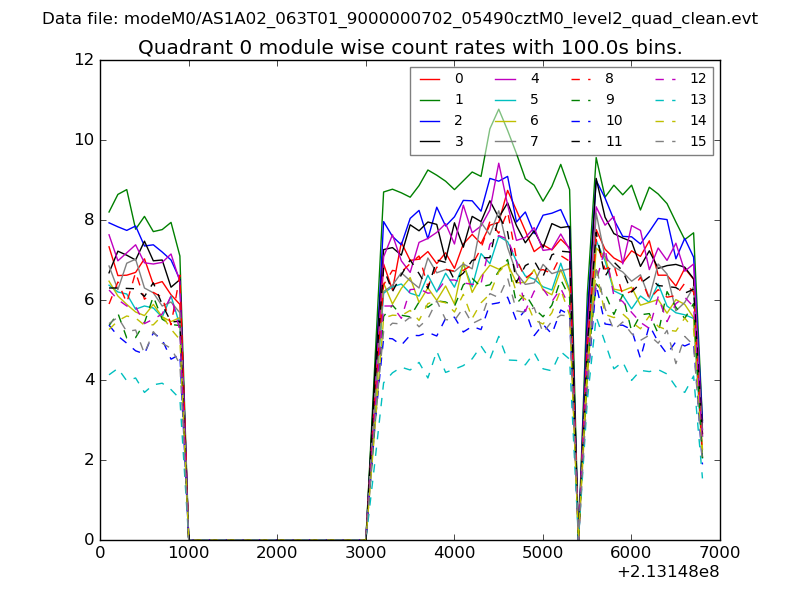 |
 |
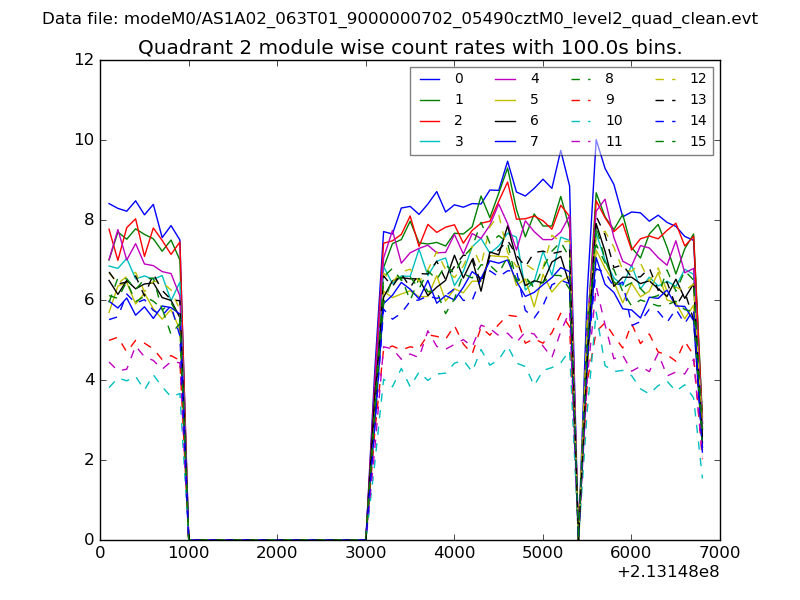
| Module-wise count rates for Quadrant B Data is divided into 100 sec bins |
 |
 |
| Module-wise count rates for Quadrant C Data is divided into 100 sec bins |
 |
 |
| Module-wise count rates for Quadrant D Data is divided into 100 sec bins |
 |
 |
| Parameter | Plot |
|---|---|
| CZT HV Monitor | 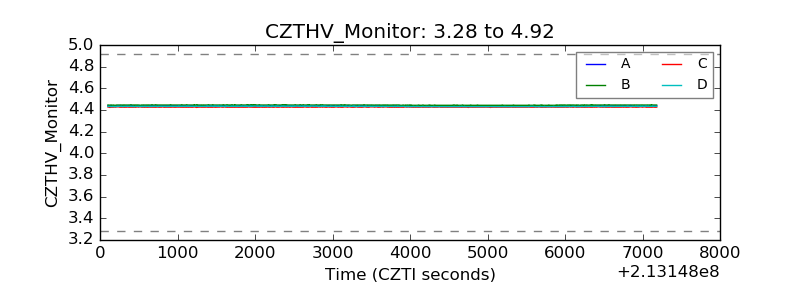 |
| D_VDD | 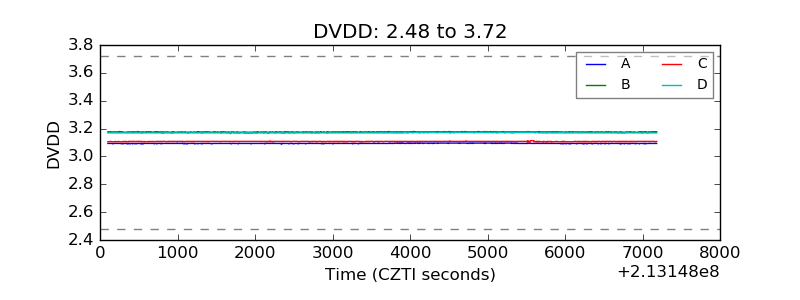 |
| Temperature 1 | 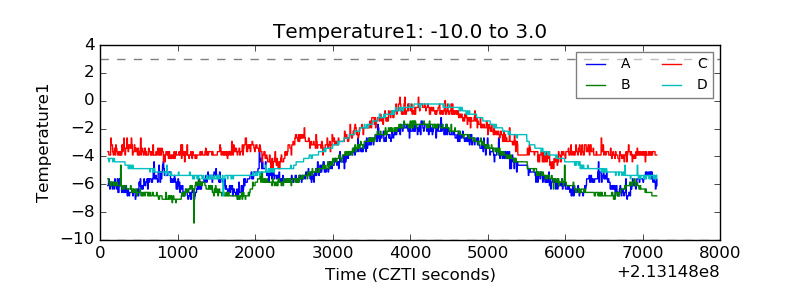 |
| Veto HV Monitor |  |
| Veto LLD | 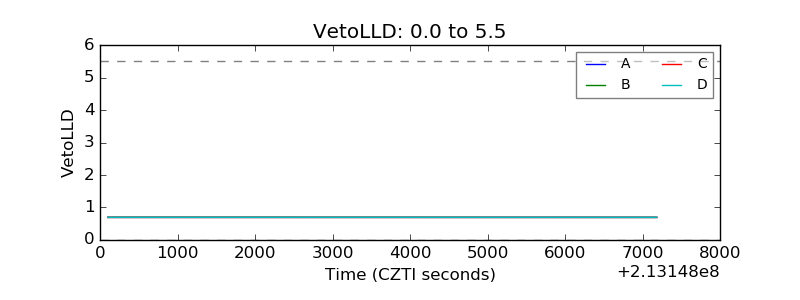 |
| Alpha Counter | 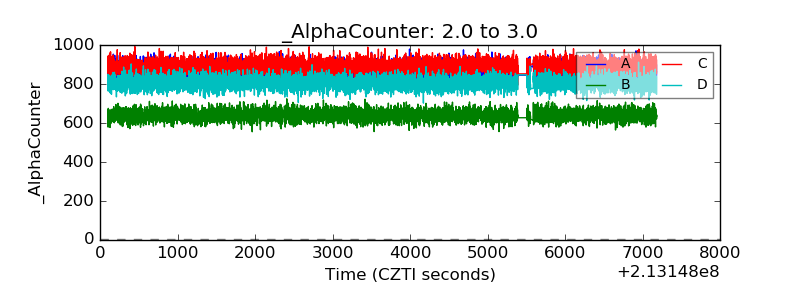 |
| _CPM_Rate | 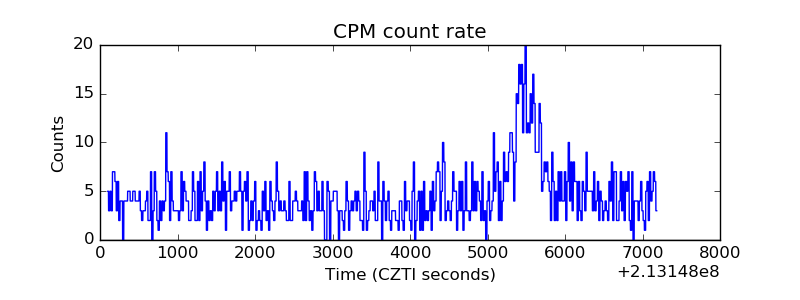 |
| CZT Counter | 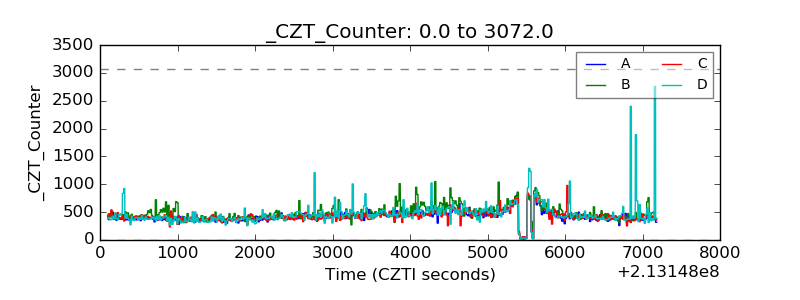 |
| +2.5 Volts monitor |  |
| +5 Volts monitor |  |
| _ROLL_ROT | 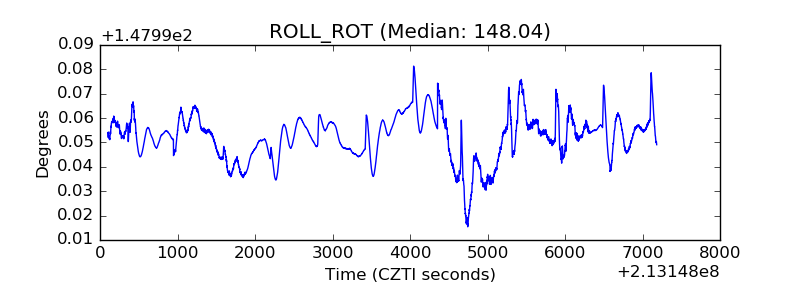 |
| _Roll_DEC | 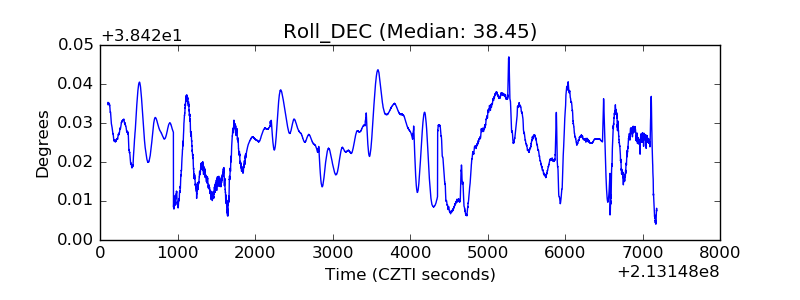 |
| _Roll_RA | 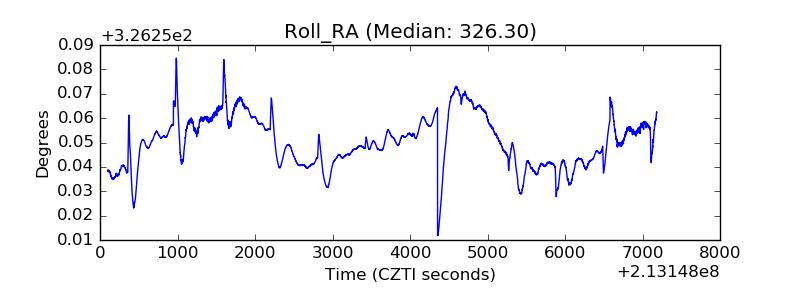 |
| Veto Counter | 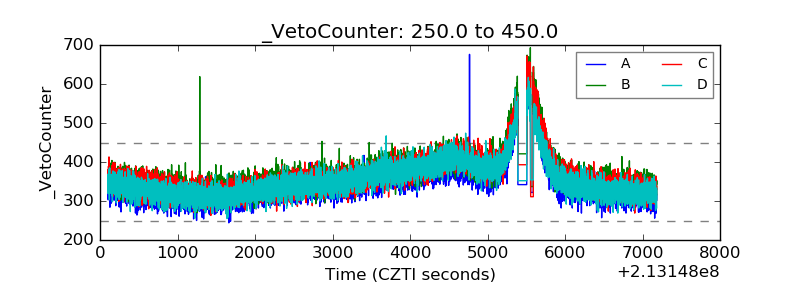 |