| Param | Original file | Final file |
|---|---|---|
| Filename | modeM0/AS1A02_063T01_9000000702_05494cztM0_level2.evt | modeM0/AS1A02_063T01_9000000702_05494cztM0_level2_quad_clean.evt |
| Size (bytes) | 1,010,044,800 | 141,367,680 |
| Size | 963.3 MB | 134.8 MB |
| Events in quadrant A | 6,298,890 | 860,361 |
| Events in quadrant B | 7,363,324 | 857,218 |
| Events in quadrant C | 9,161,292 | 785,449 |
| Events in quadrant D | 6,812,668 | 806,949 |
| Mode M0 | |||
|---|---|---|---|
| Quadrant | BADHDUFLAG | Total packets | Discarded packets |
| A | 0 | 37970 | 9120 |
| B | 0 | 41445 | 10492 |
| C | 0 | 47575 | 10551 |
| D | 0 | 40384 | 9949 |
| Mode M9 | |||
|---|---|---|---|
| Quadrant | BADHDUFLAG | Total packets | Discarded packets |
| A | 0 | 19 | 3 |
| B | 0 | 20 | 6 |
| C | 0 | 20 | 7 |
| D | 0 | 20 | 3 |
| Mode SS | |||
|---|---|---|---|
| Quadrant | BADHDUFLAG | Total packets | Discarded packets |
| A | 0 | 378 | 92 |
| B | 0 | 378 | 97 |
| C | 0 | 376 | 86 |
| D | 0 | 380 | 96 |
| Quadrant | Total seconds | Saturated seconds | Saturation percentage |
|---|---|---|---|
| A | 14184 | 173 | 1.219684% |
| B | 13946 | 264 | 1.893016% |
| C | 13929 | 978 | 7.021322% |
| D | 14037 | 244 | 1.738263% |
Noise dominated data is calculated using 1-second bins in cleaned event files. If a bin has >2000 counts, and if more than 50% of those come from <1% of pixels, then it is considered to be noise-dominated and hence unusable.
| Quadrant | # 1 sec bins | Bins with >0 counts | Bins with >2000 counts | High rate bins dominated by noise | Noise dominated (total time) | Noise dominated (detector-on time) | Marked lightcurve |
|---|---|---|---|---|---|---|---|
| A | 20491 | 15906 | 0 | 0 | 0.00% | 0.00% | 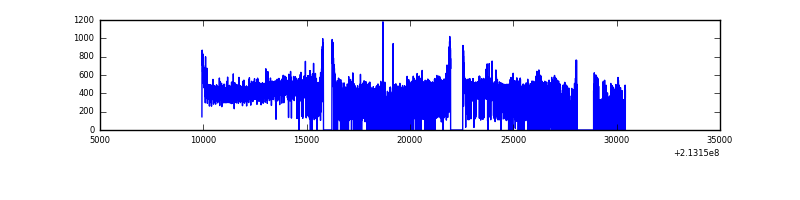 |
| B | 20495 | 15718 | 39 | 39 | 0.19% | 0.25% | 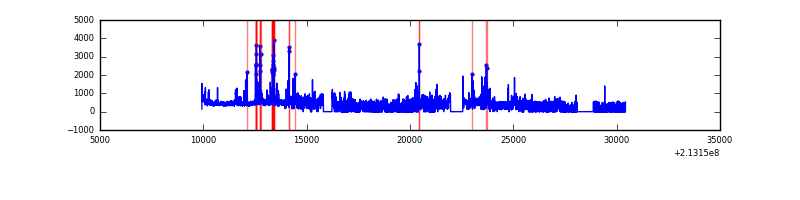 |
| C | 20495 | 15780 | 714 | 714 | 3.48% | 4.52% | 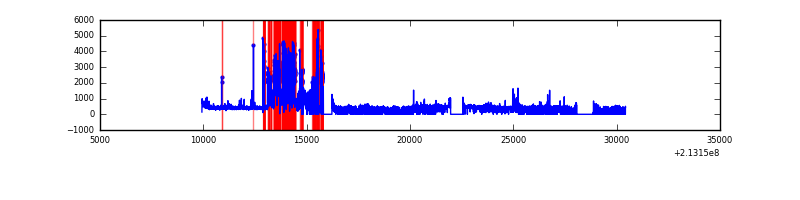 |
| D | 20495 | 15833 | 92 | 92 | 0.45% | 0.58% | 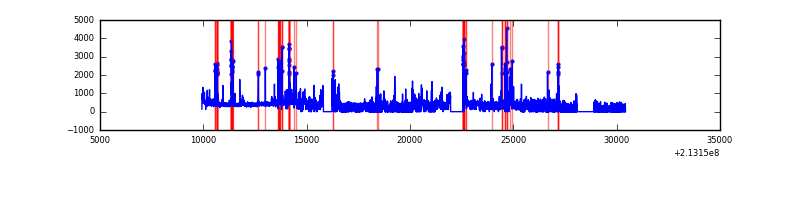 |
Top three noisy pixels from each quadrant. If the there are fewer than three noisy pixels in the level2.evt file, extra rows are filled as -1
| Pixel properties | Quadrant properties | ||||||
|---|---|---|---|---|---|---|---|
| Quadrant | DetID | PixID | Counts | Sigma | Mean | Median | Sigma |
| A | 15 | 234 | 41045 | 117.62 | 1625 | 1583 | 335.5 |
| A | 12 | 194 | 15787 | 42.33 | 1625 | 1583 | 335.5 |
| A | 0 | 226 | 15651 | 41.93 | 1625 | 1583 | 335.5 |
| B | 10 | 16 | 508561 | 1626.55 | 1617 | 1577 | 311.7 |
| B | 15 | 204 | 324980 | 1037.57 | 1617 | 1577 | 311.7 |
| B | 5 | 250 | 72823 | 228.58 | 1617 | 1577 | 311.7 |
| C | 9 | 247 | 3091137 | 8896.37 | 1498 | 1504 | 347.3 |
| C | 1 | 16 | 168921 | 482.06 | 1498 | 1504 | 347.3 |
| C | 1 | 241 | 35952 | 99.19 | 1498 | 1504 | 347.3 |
| D | 2 | 33 | 306432 | 803.71 | 1553 | 1506 | 379.4 |
| D | 8 | 195 | 142813 | 372.45 | 1553 | 1506 | 379.4 |
| D | 2 | 14 | 126169 | 328.58 | 1553 | 1506 | 379.4 |
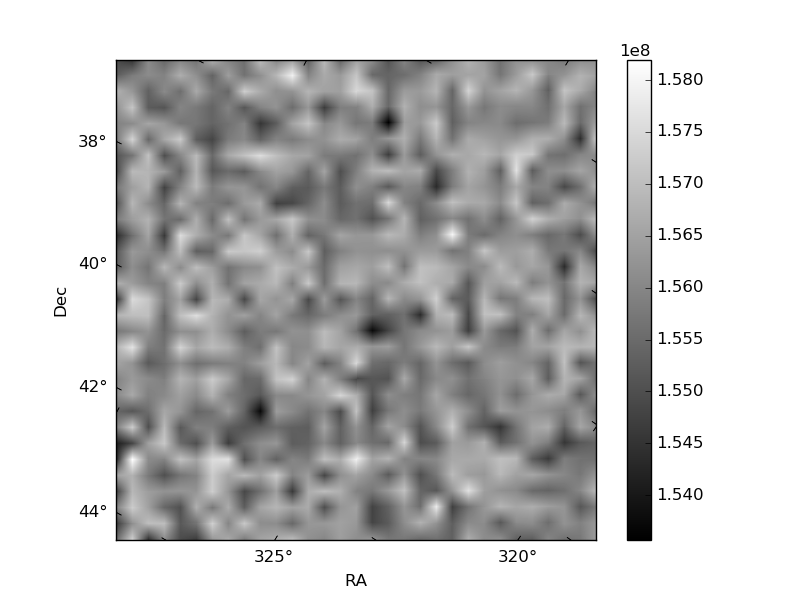
Histogram calculated using DETX and DETY for each event in the final _common_clean file
| Quadrant A | 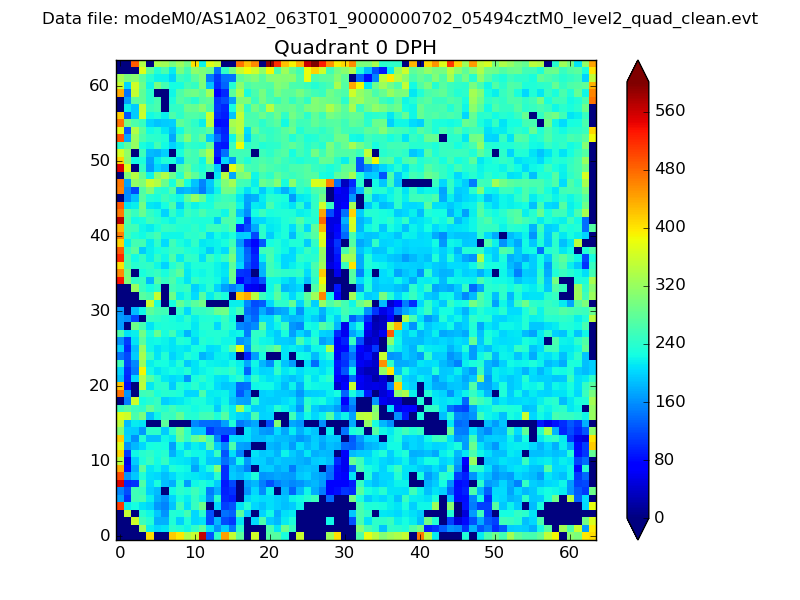 |
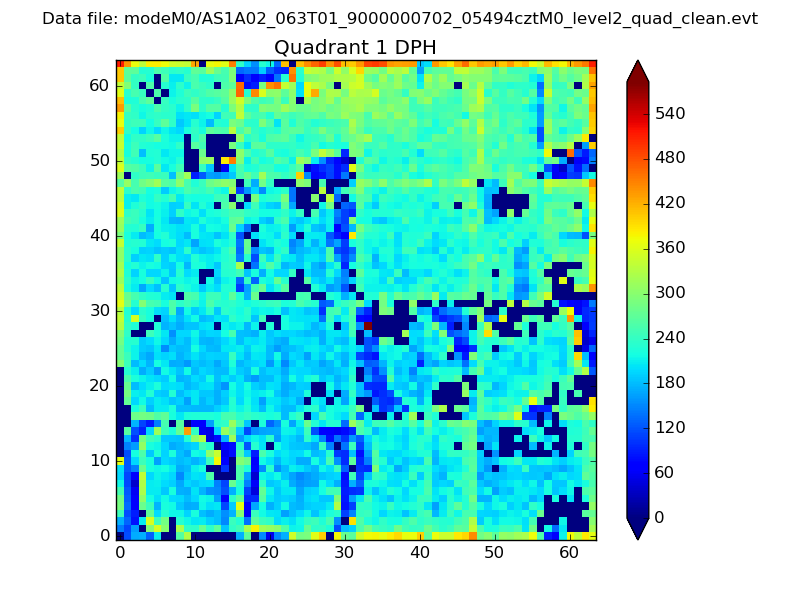 |
Quadrant B |
|---|---|---|---|
| Quadrant D | 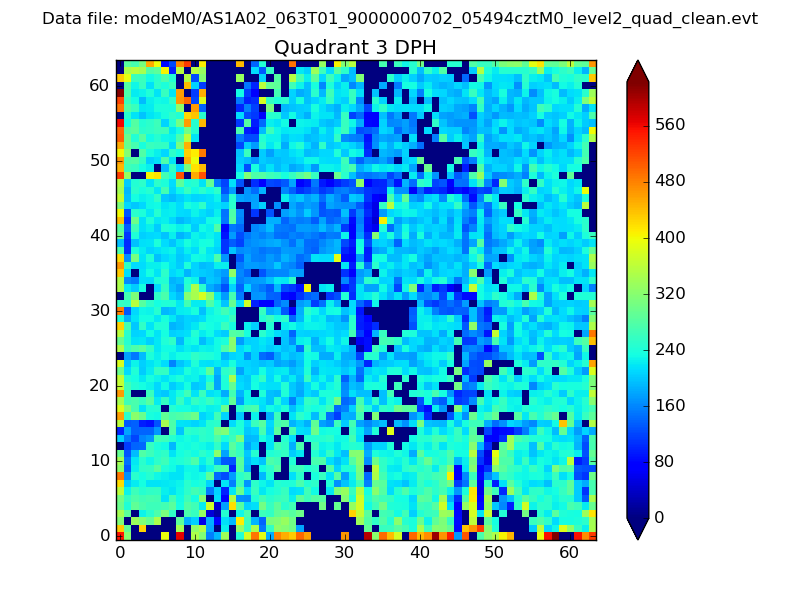 |
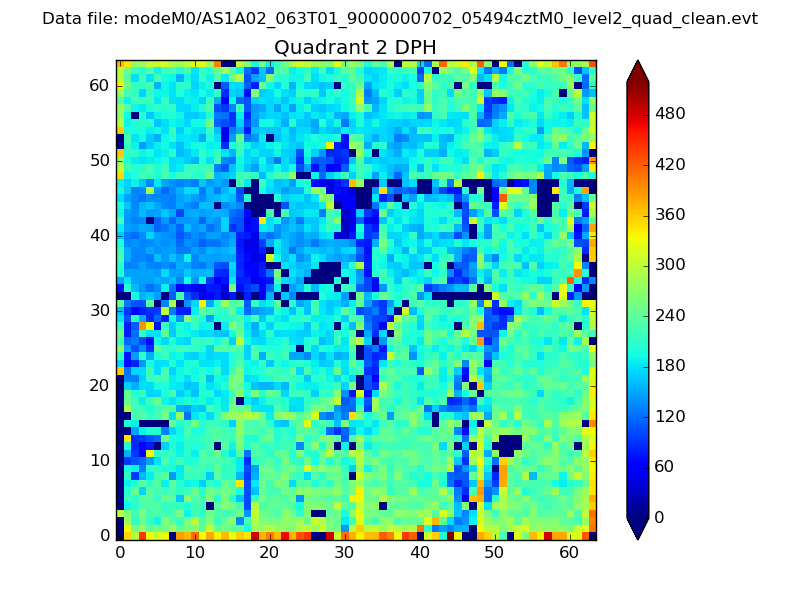 |
Quadrant C |
| Plot type | Count rate plots | Images |
|---|---|---|
| Comparison with Poisson distribution Blue bars denote a histogram of data divided into 1 sec bins. Red curve is a Poisson curve with rate = median count rate of data. |
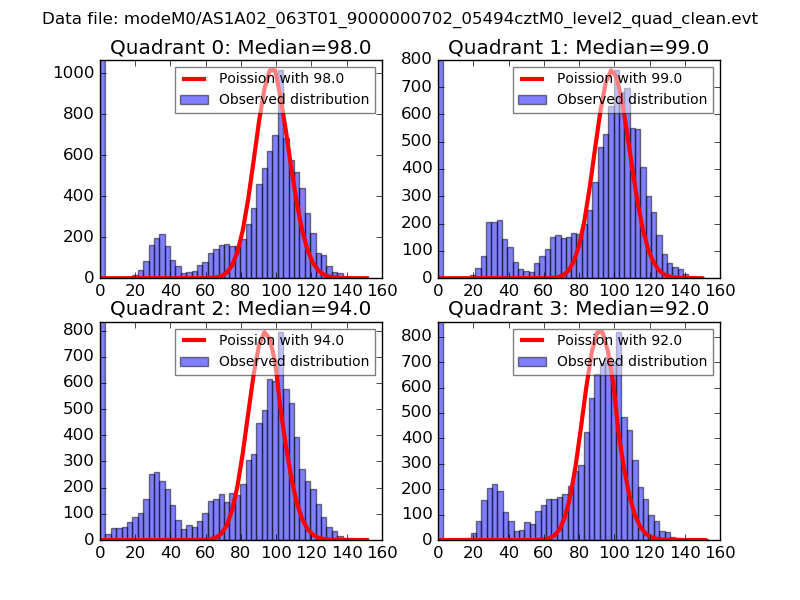 |
 |
| Quadrant-wise count rates Data is divided into 100 sec bins |
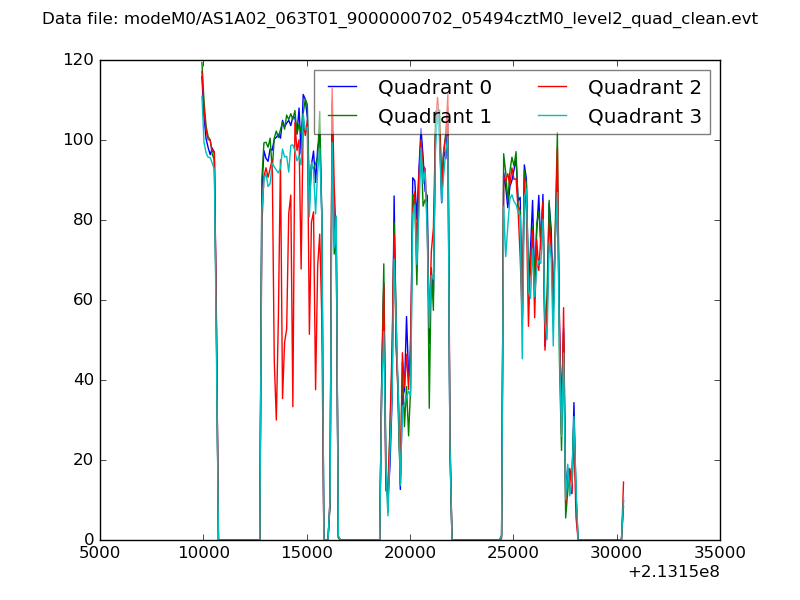 |
|
| Module-wise count rates for Quadrant A Data is divided into 100 sec bins |
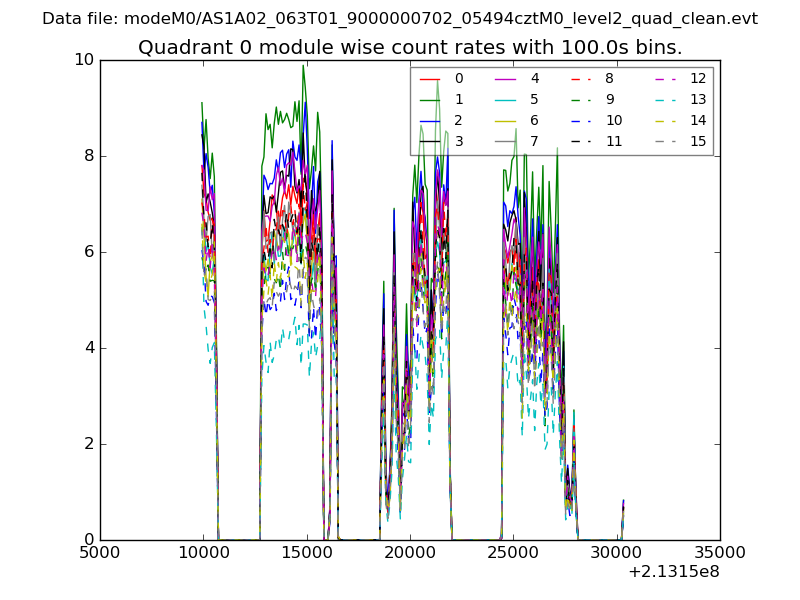 |
 |
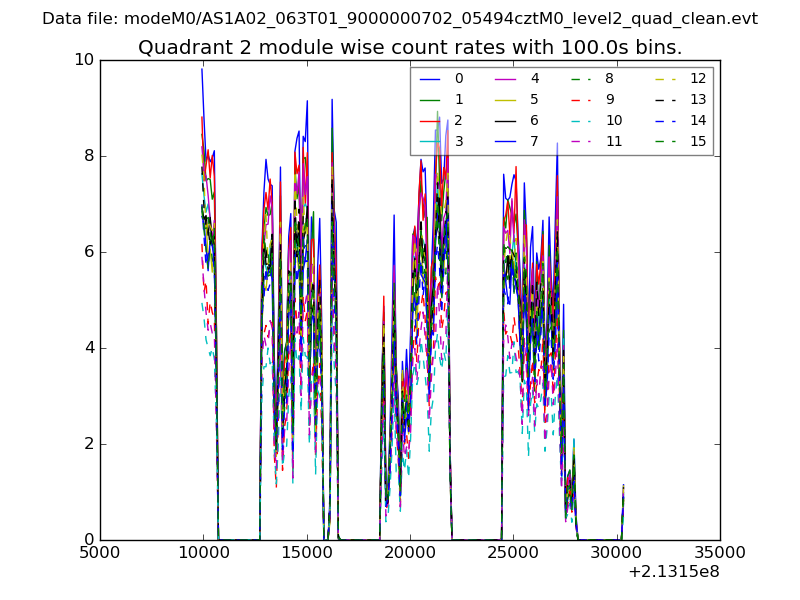
| Module-wise count rates for Quadrant B Data is divided into 100 sec bins |
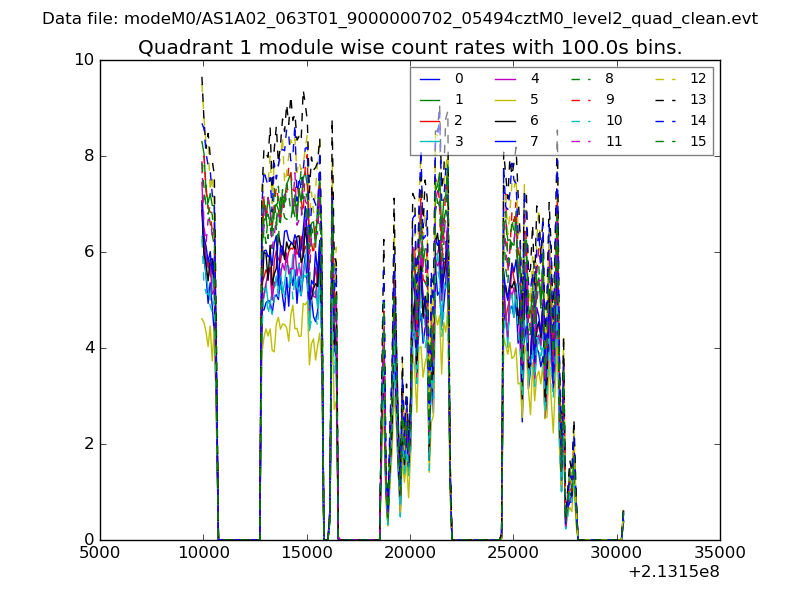 |
 |
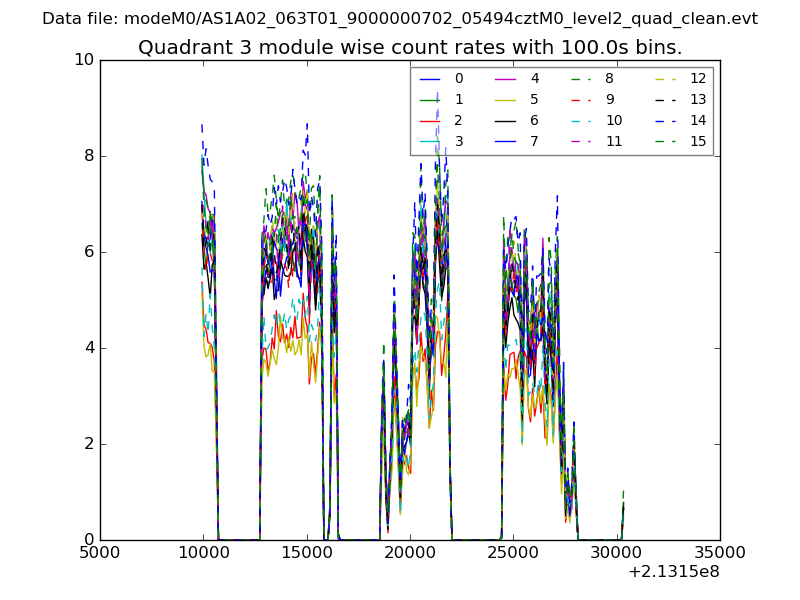
| Module-wise count rates for Quadrant C Data is divided into 100 sec bins |
 |
 |
| Module-wise count rates for Quadrant D Data is divided into 100 sec bins |
 |
 |
| Parameter | Plot |
|---|---|
| CZT HV Monitor | 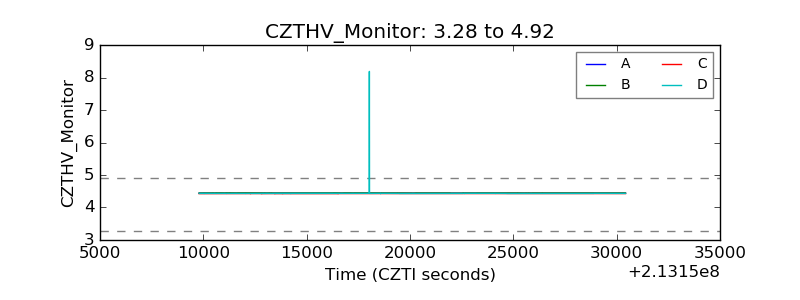 |
| D_VDD | 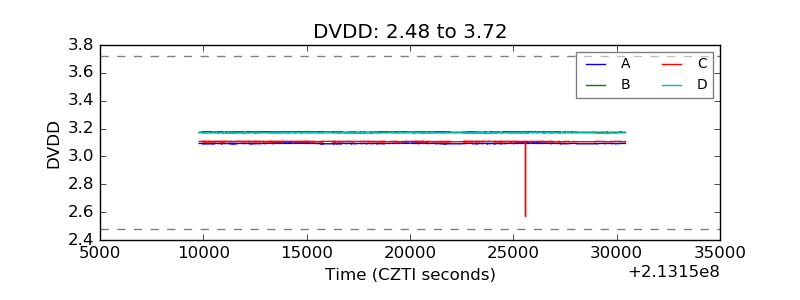 |
| Temperature 1 | 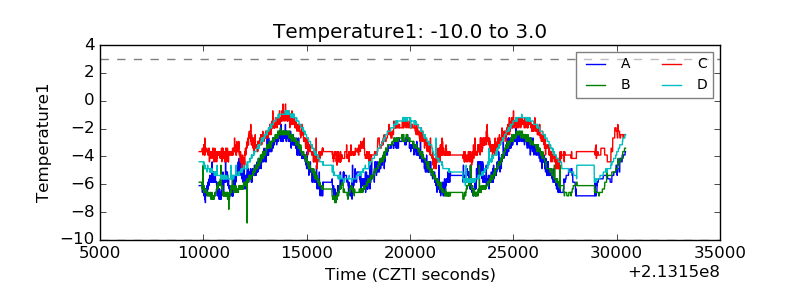 |
| Veto HV Monitor | 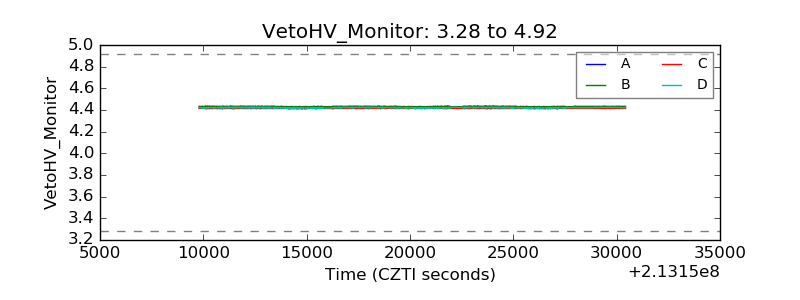 |
| Veto LLD | 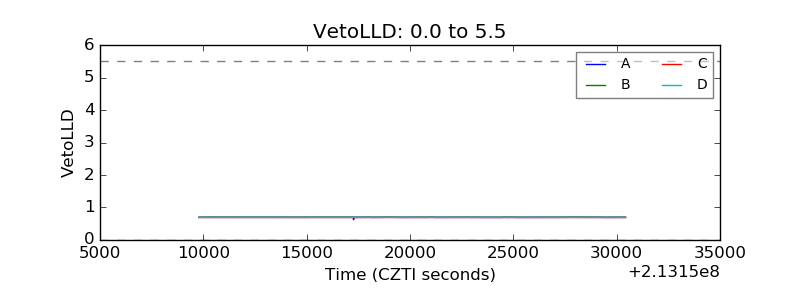 |
| Alpha Counter | 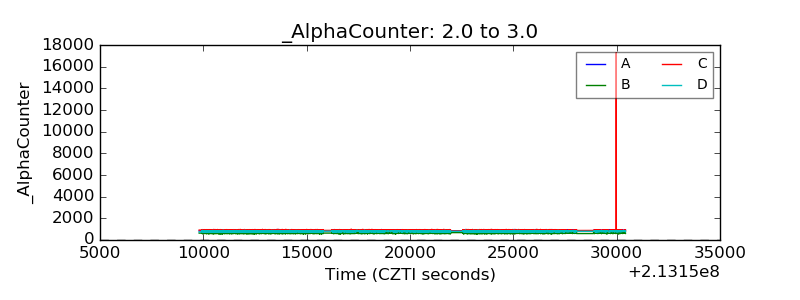 |
| _CPM_Rate | 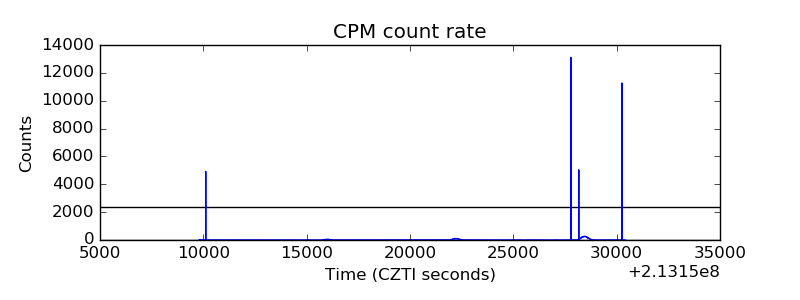 |
| CZT Counter | 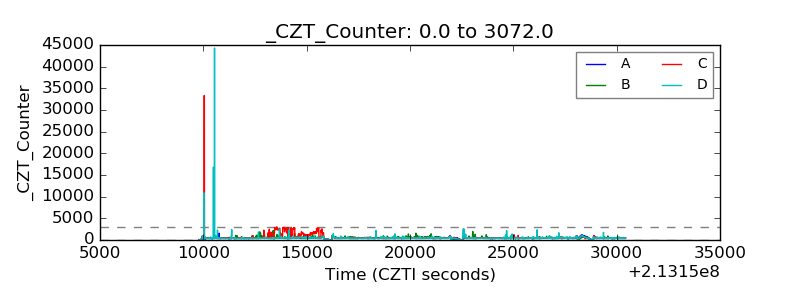 |
| +2.5 Volts monitor | 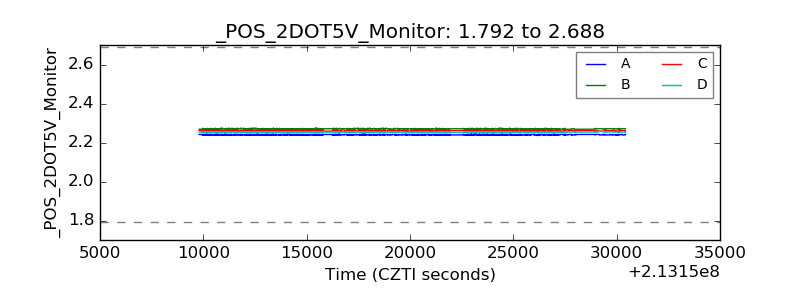 |
| +5 Volts monitor |  |
| _ROLL_ROT | 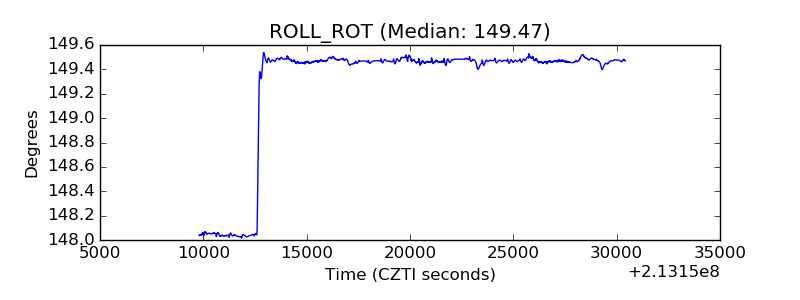 |
| _Roll_DEC | 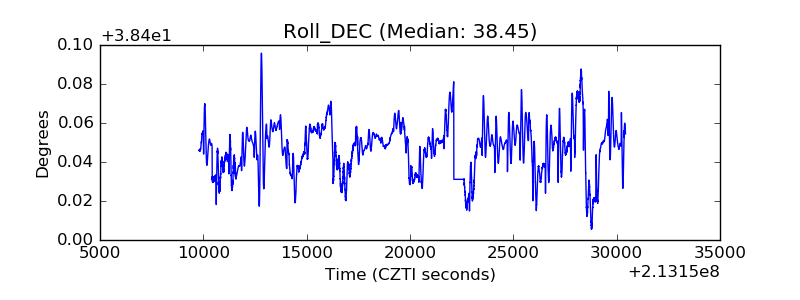 |
| _Roll_RA |  |
| Veto Counter | 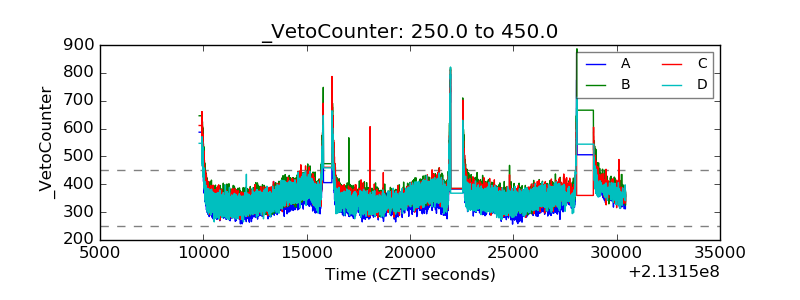 |