| Param | Original file | Final file |
|---|---|---|
| Filename | modeM0/AS1A02_063T01_9000000702_05495cztM0_level2.evt | modeM0/AS1A02_063T01_9000000702_05495cztM0_level2_quad_clean.evt |
| Size (bytes) | 1,648,728,000 | 242,026,560 |
| Size | 1.5 GB | 230.8 MB |
| Events in quadrant A | 10,337,912 | 1,474,038 |
| Events in quadrant B | 12,194,335 | 1,487,921 |
| Events in quadrant C | 14,550,278 | 1,395,554 |
| Events in quadrant D | 11,291,383 | 1,385,014 |
| Mode M0 | |||
|---|---|---|---|
| Quadrant | BADHDUFLAG | Total packets | Discarded packets |
| A | 0 | 46844 | 13 |
| B | 0 | 51081 | 6 |
| C | 0 | 59135 | 18 |
| D | 0 | 49903 | 17 |
| Mode M9 | |||
|---|---|---|---|
| Quadrant | BADHDUFLAG | Total packets | Discarded packets |
| A | 0 | 27 | 0 |
| B | 0 | 27 | 0 |
| C | 0 | 27 | 0 |
| D | 0 | 27 | 0 |
| Mode SS | |||
|---|---|---|---|
| Quadrant | BADHDUFLAG | Total packets | Discarded packets |
| A | 0 | 470 | 0 |
| B | 0 | 470 | 0 |
| C | 0 | 470 | 0 |
| D | 0 | 470 | 0 |
| Quadrant | Total seconds | Saturated seconds | Saturation percentage |
|---|---|---|---|
| A | 23053 | 272 | 1.179890% |
| B | 23056 | 389 | 1.687196% |
| C | 23050 | 1400 | 6.073753% |
| D | 23051 | 396 | 1.717930% |
Noise dominated data is calculated using 1-second bins in cleaned event files. If a bin has >2000 counts, and if more than 50% of those come from <1% of pixels, then it is considered to be noise-dominated and hence unusable.
| Quadrant | # 1 sec bins | Bins with >0 counts | Bins with >2000 counts | High rate bins dominated by noise | Noise dominated (total time) | Noise dominated (detector-on time) | Marked lightcurve |
|---|---|---|---|---|---|---|---|
| A | 25797 | 23061 | 0 | 0 | 0.00% | 0.00% |  |
| B | 25797 | 23061 | 58 | 58 | 0.22% | 0.25% | 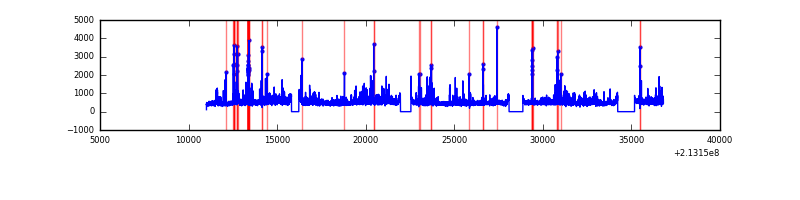 |
| C | 25797 | 23061 | 964 | 964 | 3.74% | 4.18% | 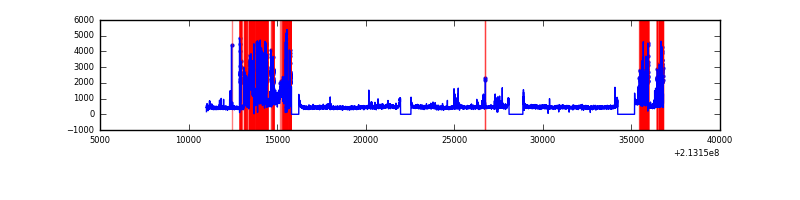 |
| D | 25797 | 23060 | 145 | 145 | 0.56% | 0.63% |  |
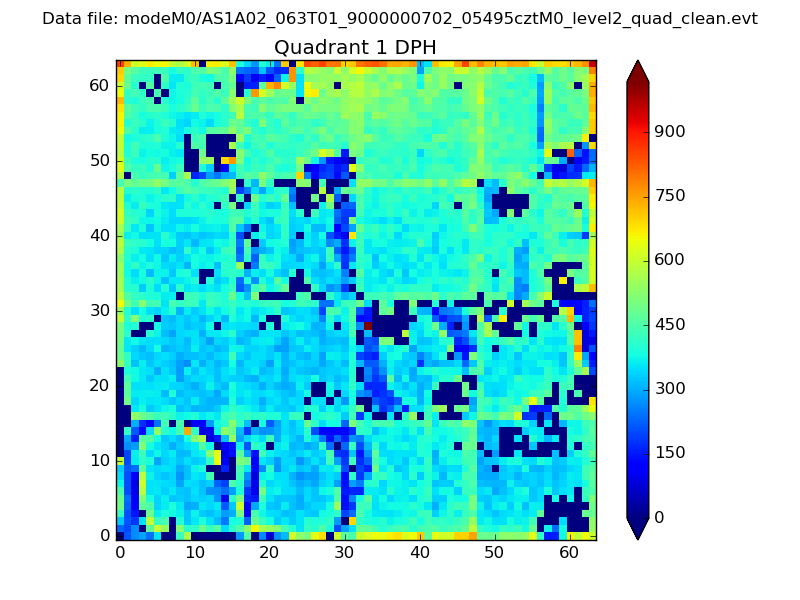
Top three noisy pixels from each quadrant. If the there are fewer than three noisy pixels in the level2.evt file, extra rows are filled as -1
| Pixel properties | Quadrant properties | ||||||
|---|---|---|---|---|---|---|---|
| Quadrant | DetID | PixID | Counts | Sigma | Mean | Median | Sigma |
| A | 15 | 234 | 98438 | 175.91 | 2658 | 2592 | 544.9 |
| A | 12 | 194 | 26030 | 43.02 | 2658 | 2592 | 544.9 |
| A | 0 | 226 | 25836 | 42.66 | 2658 | 2592 | 544.9 |
| B | 10 | 16 | 686513 | 1334.66 | 2684 | 2617 | 512.4 |
| B | 15 | 204 | 640003 | 1243.89 | 2684 | 2617 | 512.4 |
| B | 5 | 250 | 126384 | 241.54 | 2684 | 2617 | 512.4 |
| C | 9 | 247 | 4227035 | 7270.91 | 2511 | 2523 | 581.0 |
| C | 1 | 16 | 382620 | 654.19 | 2511 | 2523 | 581.0 |
| C | 1 | 241 | 118583 | 199.75 | 2511 | 2523 | 581.0 |
| D | 2 | 33 | 453840 | 714.45 | 2569 | 2489 | 631.7 |
| D | 8 | 195 | 293990 | 461.42 | 2569 | 2489 | 631.7 |
| D | 2 | 152 | 258284 | 404.9 | 2569 | 2489 | 631.7 |
Histogram calculated using DETX and DETY for each event in the final _common_clean file
| Quadrant A | 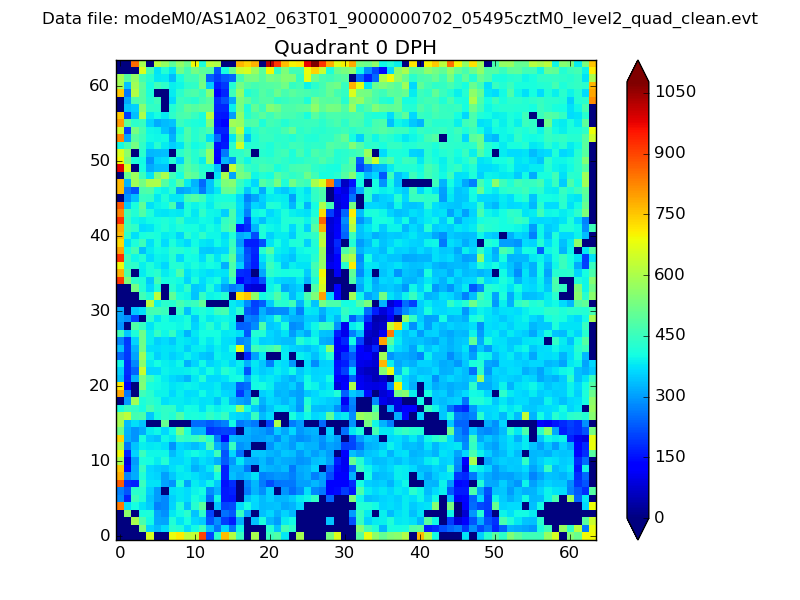 |
 |
Quadrant B |
|---|---|---|---|
| Quadrant D | 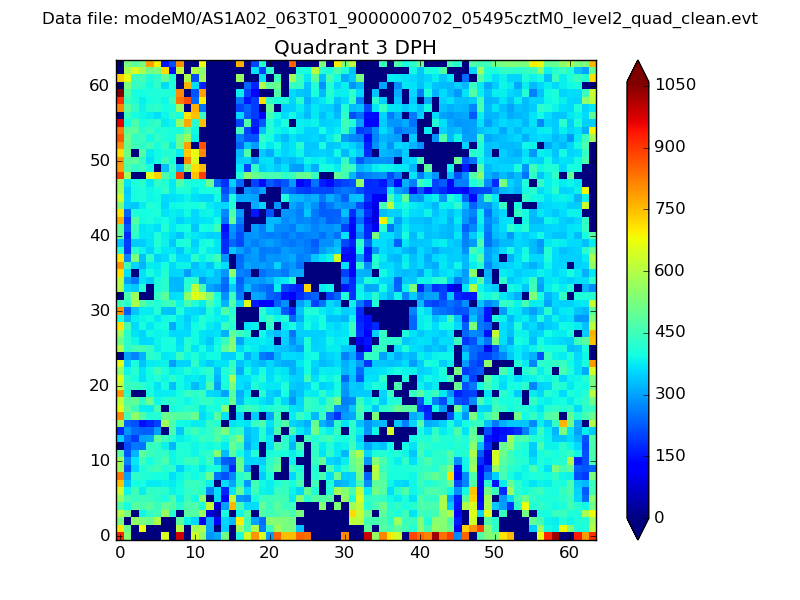 |
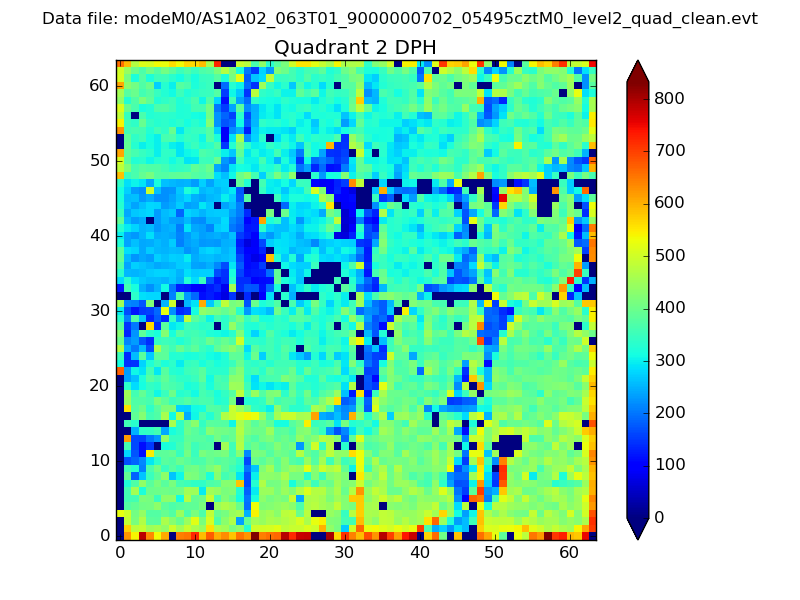 |
Quadrant C |
| Plot type | Count rate plots | Images |
|---|---|---|
| Comparison with Poisson distribution Blue bars denote a histogram of data divided into 1 sec bins. Red curve is a Poisson curve with rate = median count rate of data. |
 |
 |
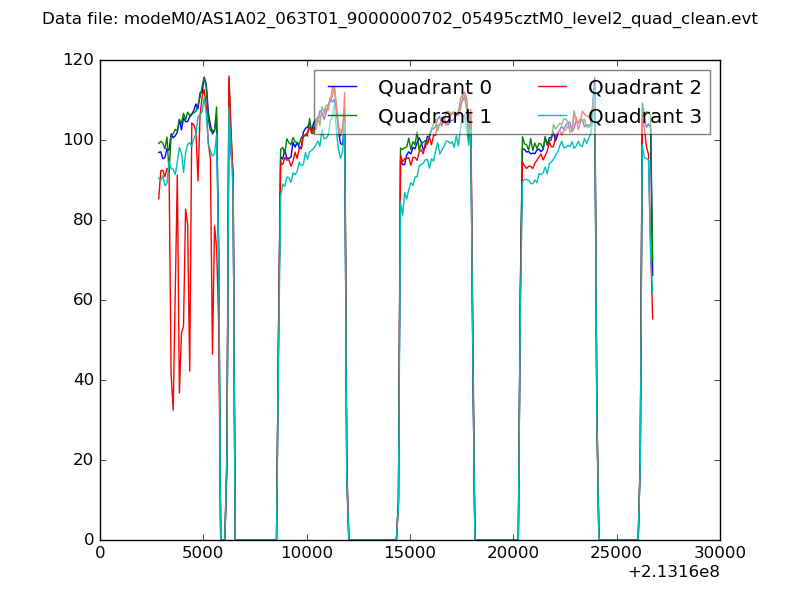
| Quadrant-wise count rates Data is divided into 100 sec bins |
 |
|
| Module-wise count rates for Quadrant A Data is divided into 100 sec bins |
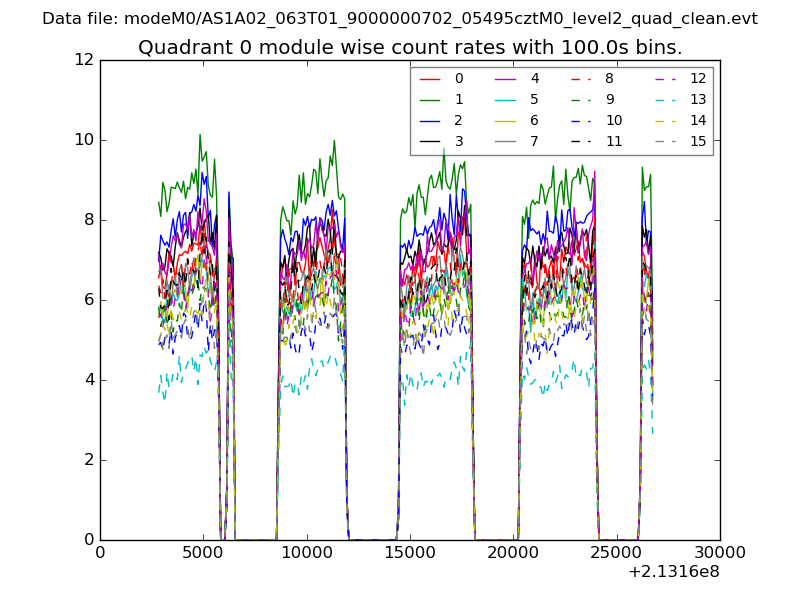 |
 |
| Module-wise count rates for Quadrant B Data is divided into 100 sec bins |
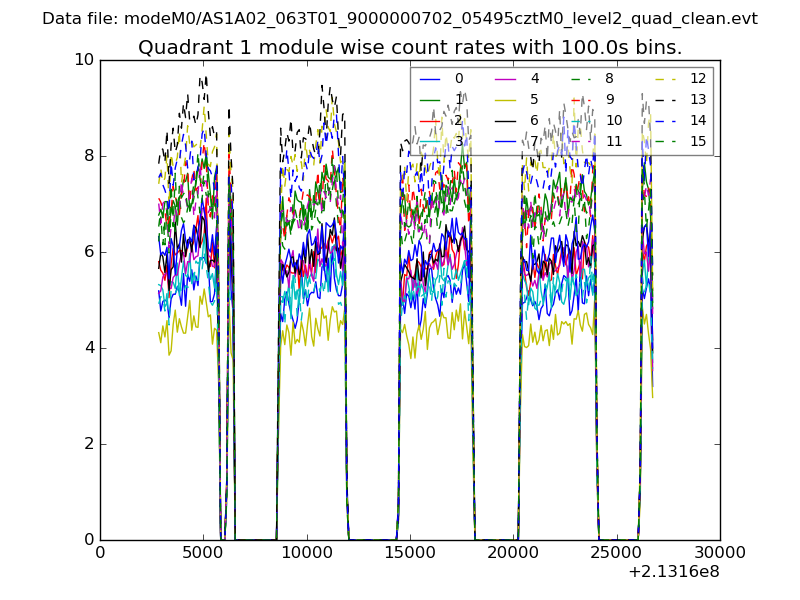 |
 |
| Module-wise count rates for Quadrant C Data is divided into 100 sec bins |
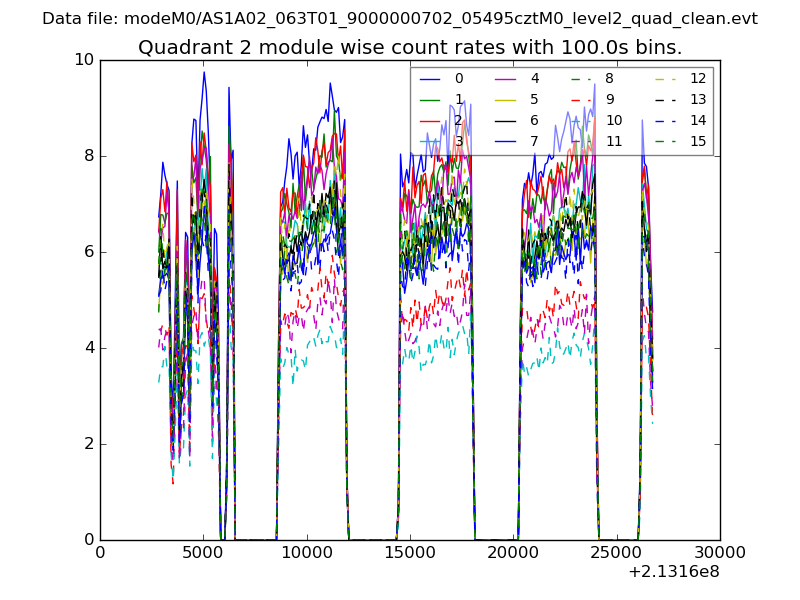 |
 |
| Module-wise count rates for Quadrant D Data is divided into 100 sec bins |
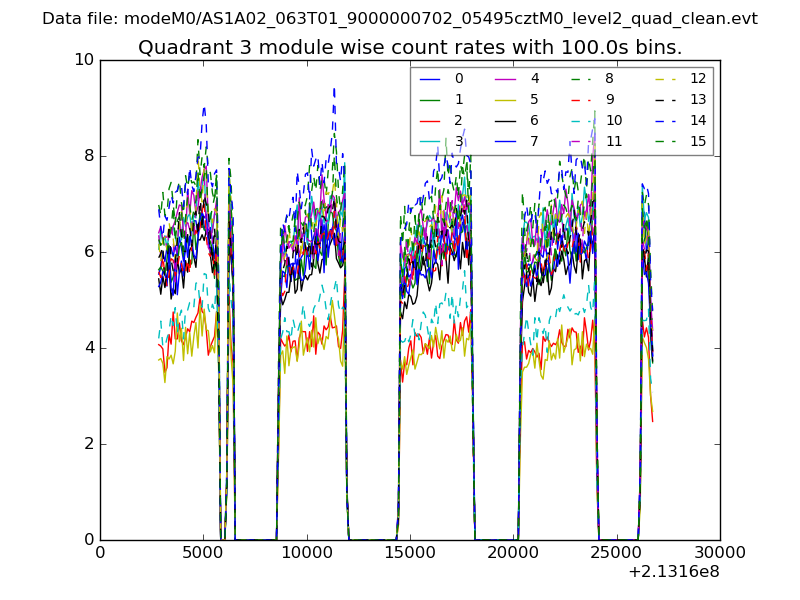 |
 |
| Parameter | Plot |
|---|---|
| CZT HV Monitor | 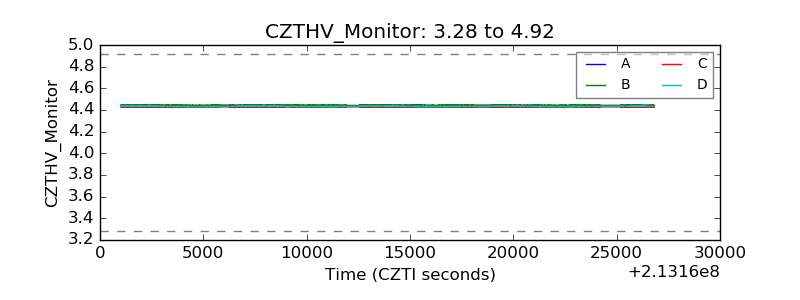 |
| D_VDD | 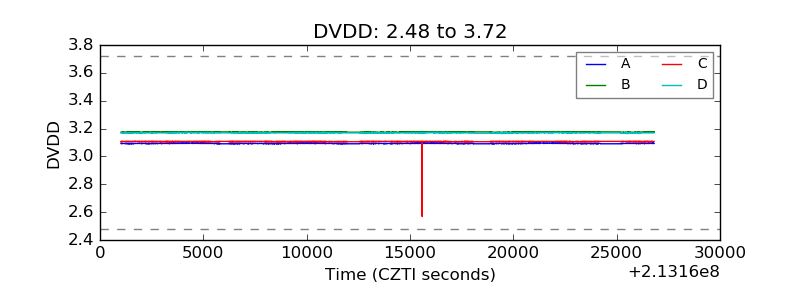 |
| Temperature 1 | 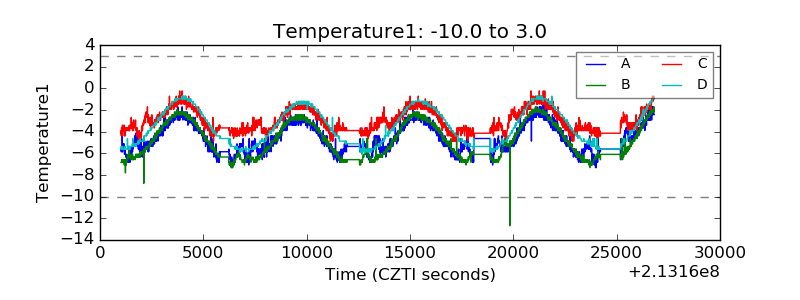 |
| Veto HV Monitor | 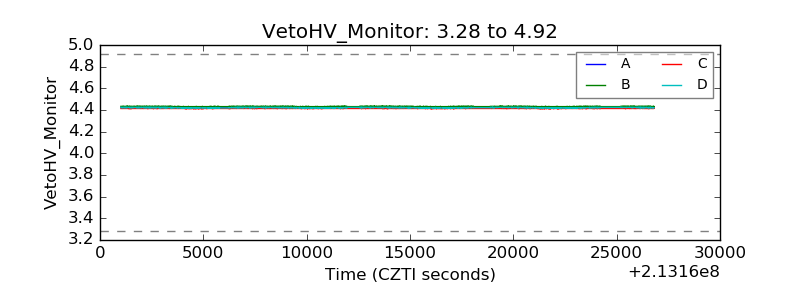 |
| Veto LLD | 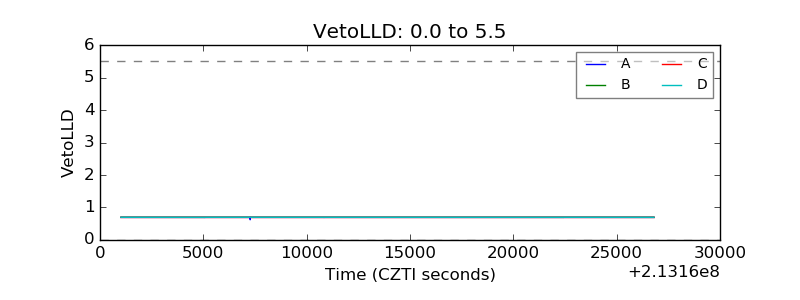 |
| Alpha Counter | 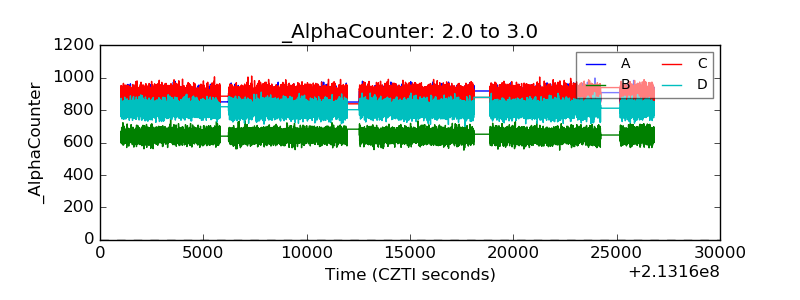 |
| _CPM_Rate | 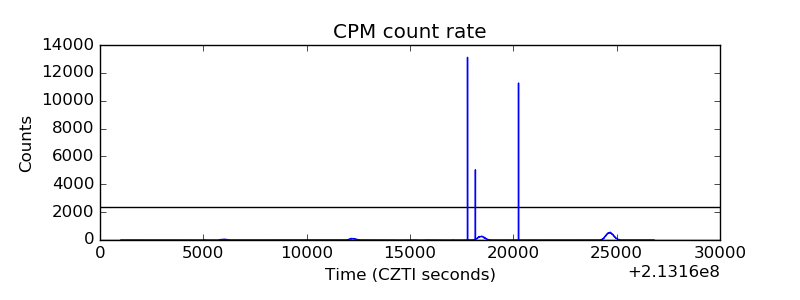 |
| CZT Counter | 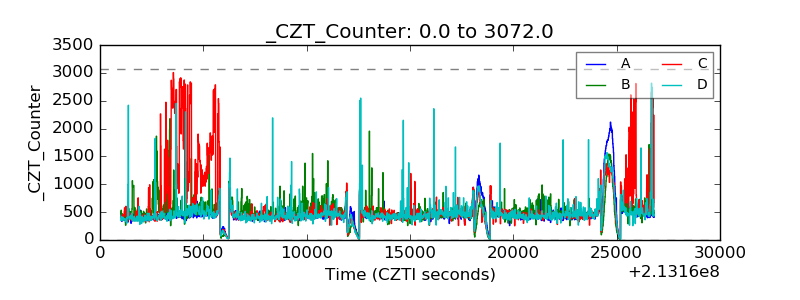 |
| +2.5 Volts monitor |  |
| +5 Volts monitor |  |
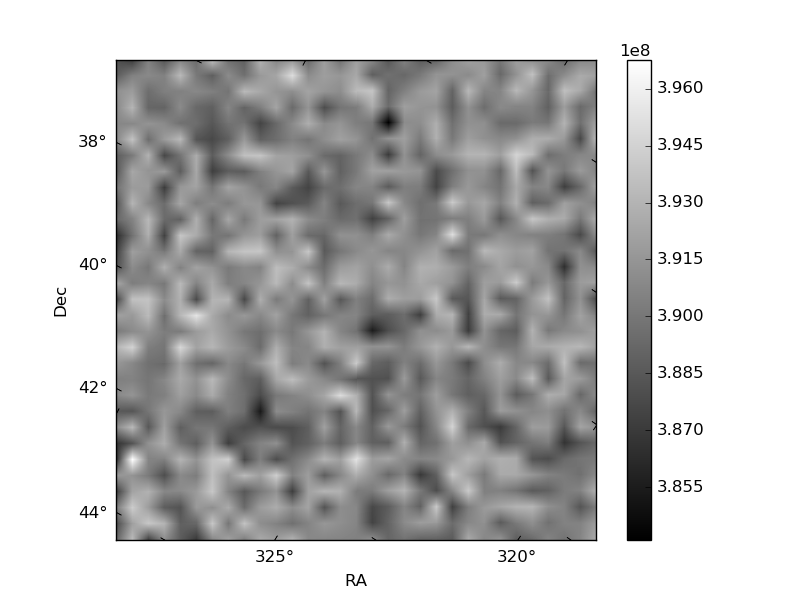
| _ROLL_ROT | 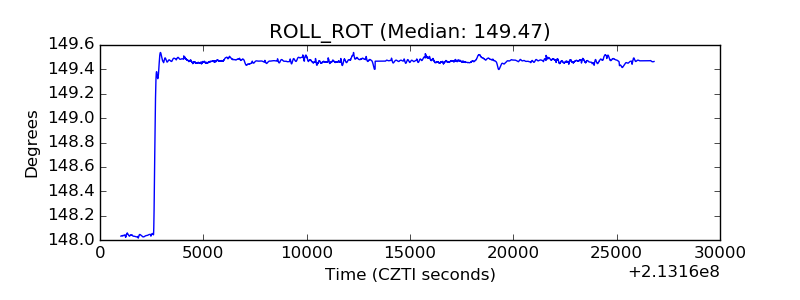 |
| _Roll_DEC | 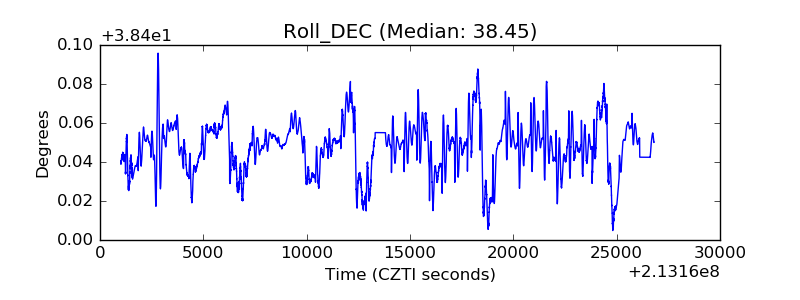 |
| _Roll_RA | 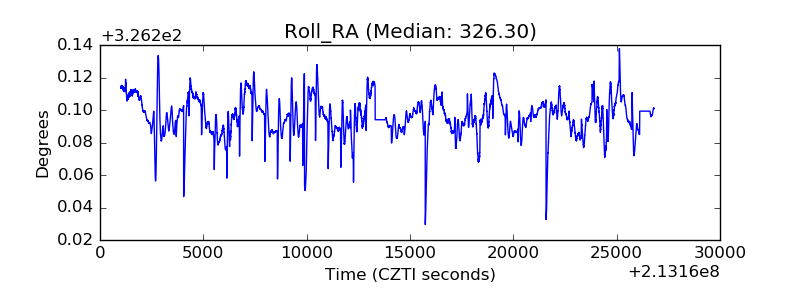 |
| Veto Counter | 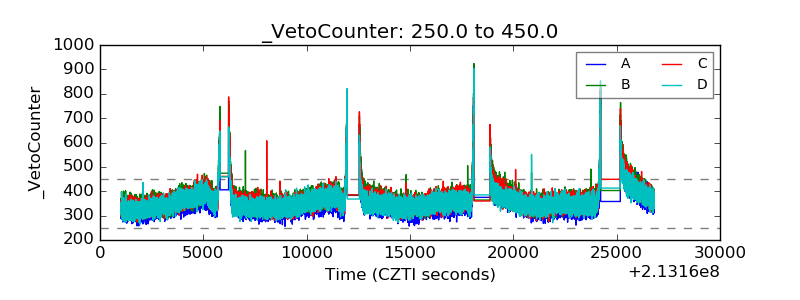 |