| Param | Original file | Final file |
|---|---|---|
| Filename | modeM0/AS1A02_063T01_9000000702_05498cztM0_level2.evt | modeM0/AS1A02_063T01_9000000702_05498cztM0_level2_quad_clean.evt |
| Size (bytes) | 142,280,640 | 30,988,800 |
| Size | 135.7 MB | 29.6 MB |
| Events in quadrant A | 851,595 | 206,020 |
| Events in quadrant B | 1,426,664 | 204,303 |
| Events in quadrant C | 952,517 | 199,052 |
| Events in quadrant D | 947,455 | 191,042 |
| Mode M0 | |||
|---|---|---|---|
| Quadrant | BADHDUFLAG | Total packets | Discarded packets |
| A | 0 | 3799 | 0 |
| B | 0 | 5546 | 0 |
| C | 0 | 4008 | 0 |
| D | 0 | 4039 | 0 |
| Mode SS | |||
|---|---|---|---|
| Quadrant | BADHDUFLAG | Total packets | Discarded packets |
| A | 0 | 38 | 0 |
| B | 0 | 38 | 0 |
| C | 0 | 38 | 0 |
| D | 0 | 38 | 0 |
| Quadrant | Total seconds | Saturated seconds | Saturation percentage |
|---|---|---|---|
| A | 1884 | 3 | 0.159236% |
| B | 1884 | 7 | 0.371550% |
| C | 1884 | 11 | 0.583864% |
| D | 1884 | 8 | 0.424628% |
Noise dominated data is calculated using 1-second bins in cleaned event files. If a bin has >2000 counts, and if more than 50% of those come from <1% of pixels, then it is considered to be noise-dominated and hence unusable.
| Quadrant | # 1 sec bins | Bins with >0 counts | Bins with >2000 counts | High rate bins dominated by noise | Noise dominated (total time) | Noise dominated (detector-on time) | Marked lightcurve |
|---|---|---|---|---|---|---|---|
| A | 1884 | 1884 | 0 | 0 | 0.00% | 0.00% | 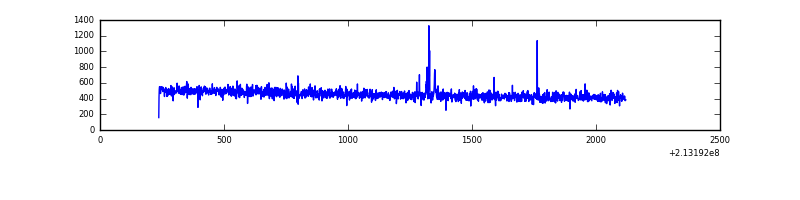 |
| B | 1884 | 1884 | 3 | 3 | 0.16% | 0.16% | 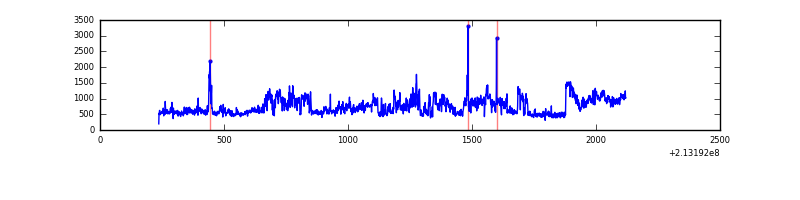 |
| C | 1884 | 1884 | 8 | 8 | 0.42% | 0.42% | 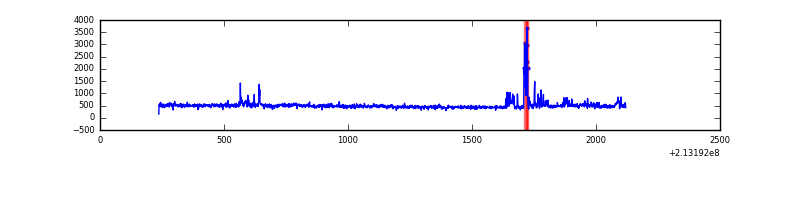 |
| D | 1884 | 1884 | 6 | 6 | 0.32% | 0.32% | 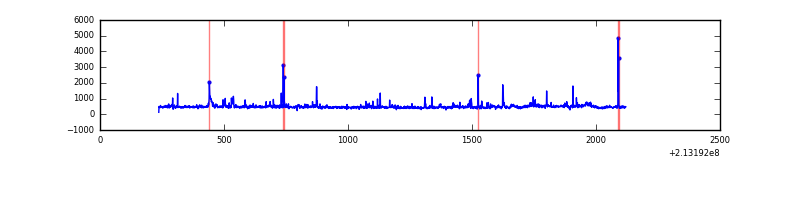 |
Top three noisy pixels from each quadrant. If the there are fewer than three noisy pixels in the level2.evt file, extra rows are filled as -1
| Pixel properties | Quadrant properties | ||||||
|---|---|---|---|---|---|---|---|
| Quadrant | DetID | PixID | Counts | Sigma | Mean | Median | Sigma |
| A | 10 | 17 | 7575 | 160.48 | 218 | 214 | 45.9 |
| A | 0 | 226 | 2189 | 43.06 | 218 | 214 | 45.9 |
| A | 12 | 194 | 2174 | 42.73 | 218 | 214 | 45.9 |
| B | 15 | 255 | 451293 | 10524.11 | 216 | 211 | 42.9 |
| B | 15 | 204 | 80596 | 1875.45 | 216 | 211 | 42.9 |
| B | 15 | 54 | 18679 | 430.87 | 216 | 211 | 42.9 |
| C | 1 | 241 | 44811 | 906.16 | 209 | 210 | 49.2 |
| C | 1 | 16 | 44226 | 894.27 | 209 | 210 | 49.2 |
| C | 9 | 247 | 27549 | 555.44 | 209 | 210 | 49.2 |
| D | 2 | 152 | 48028 | 904.33 | 211 | 204 | 52.9 |
| D | 8 | 195 | 45125 | 849.44 | 211 | 204 | 52.9 |
| D | 2 | 33 | 25914 | 486.16 | 211 | 204 | 52.9 |
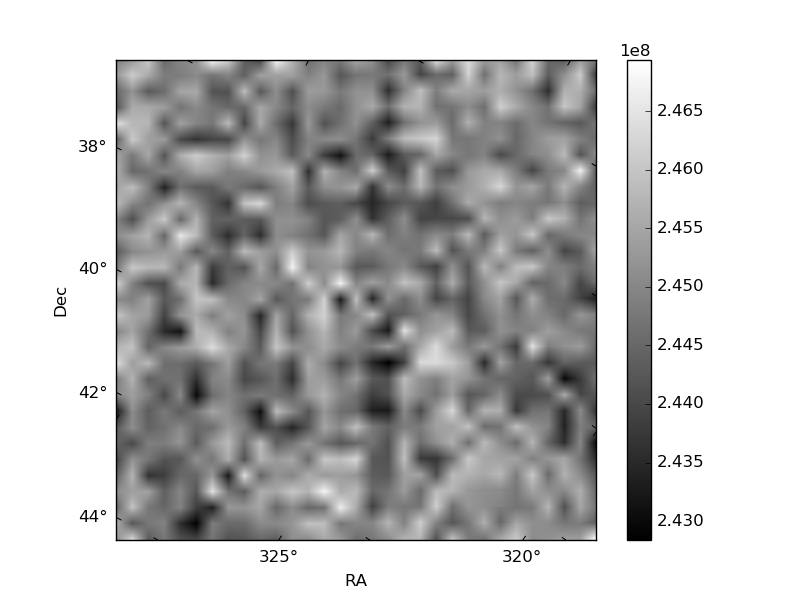
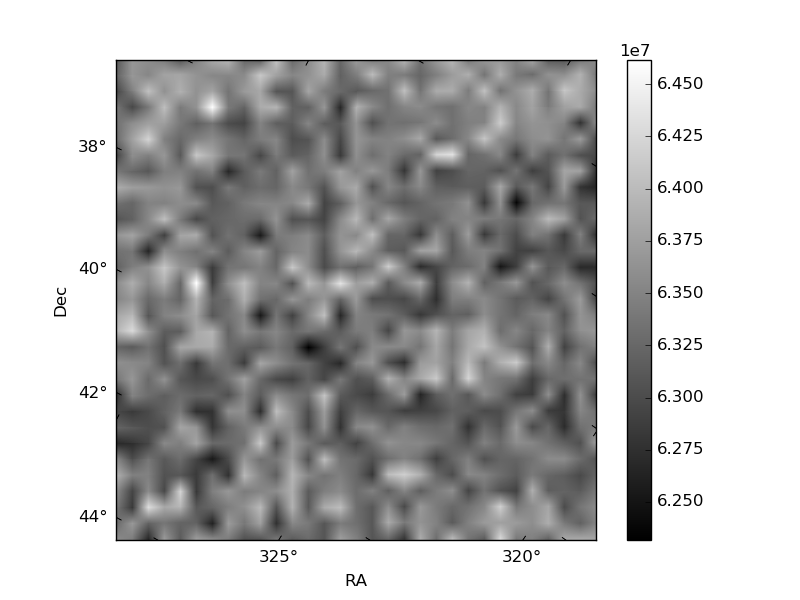
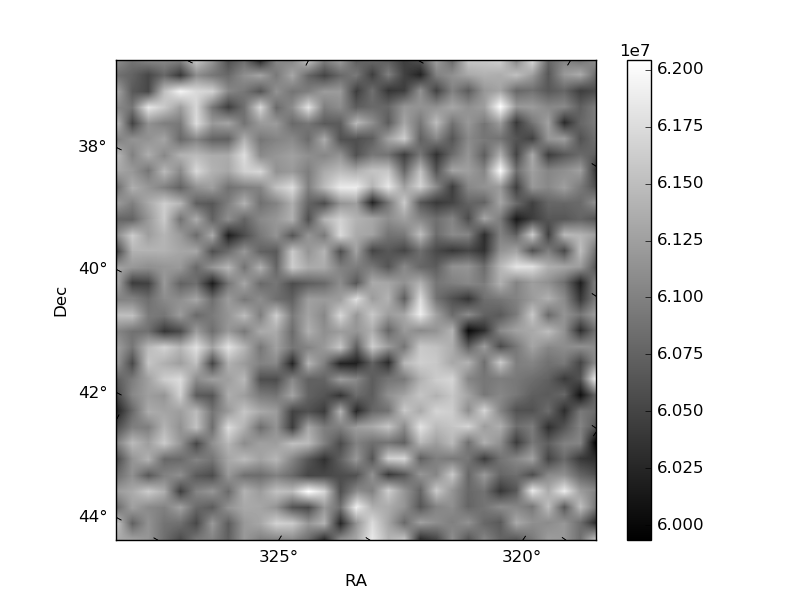
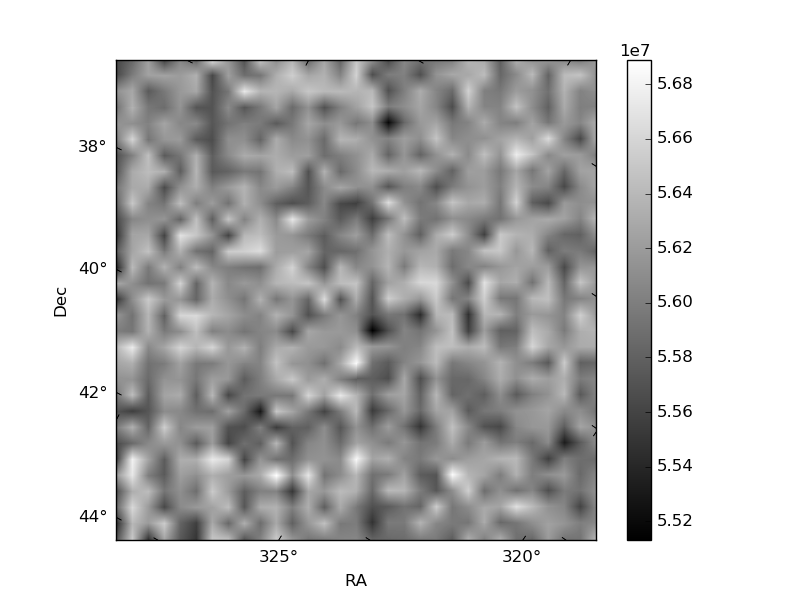
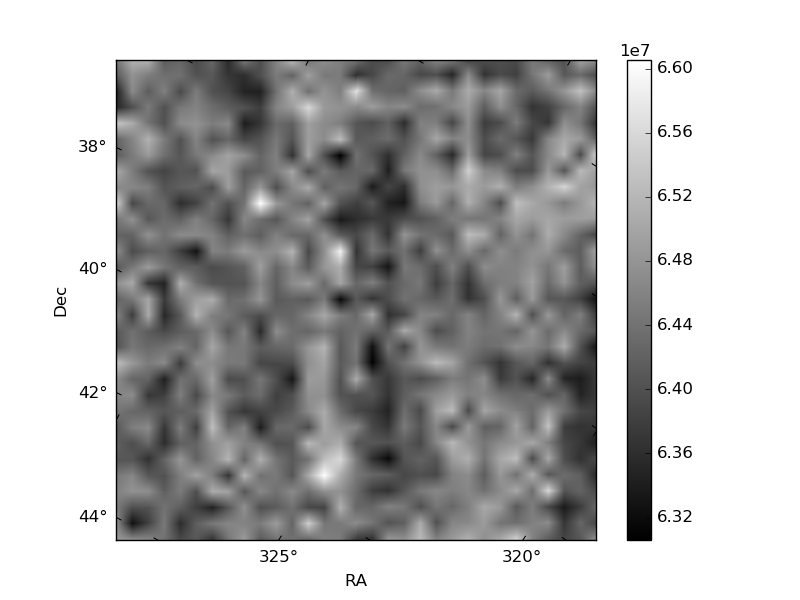
Histogram calculated using DETX and DETY for each event in the final _common_clean file
| Quadrant A | 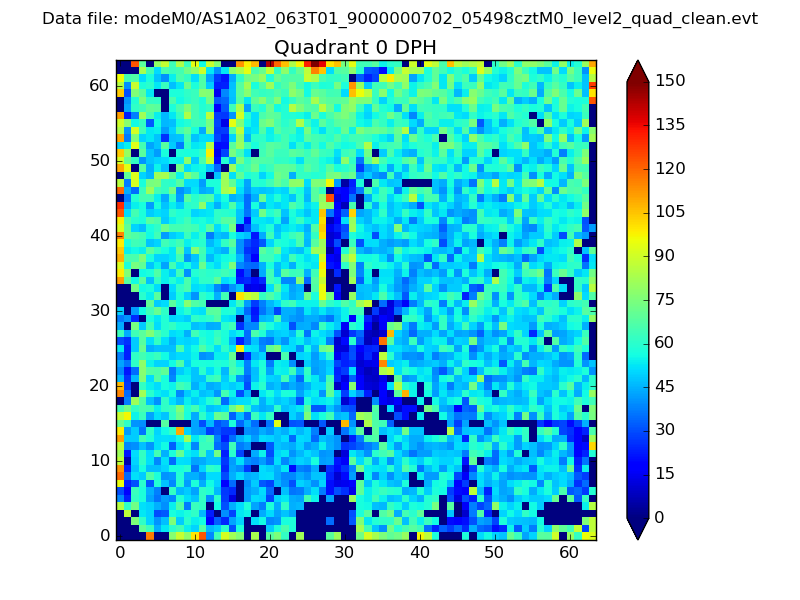 |
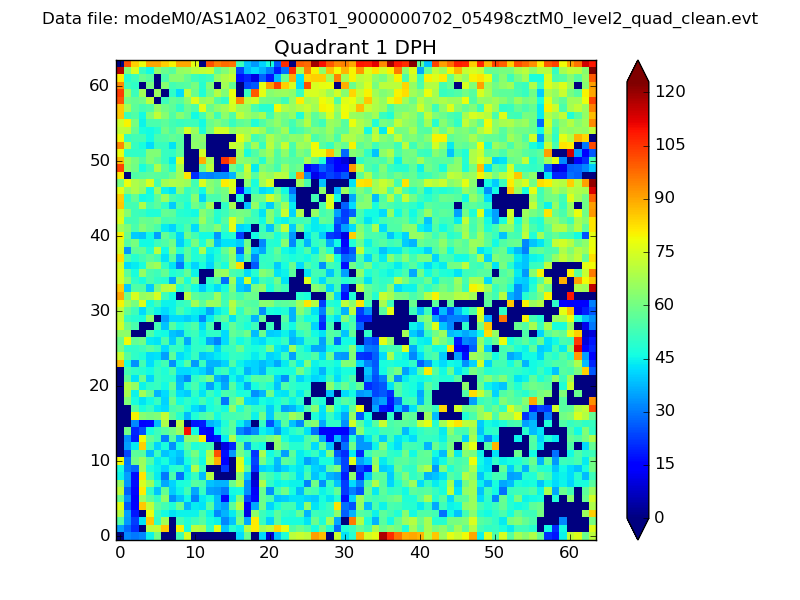 |
Quadrant B |
|---|---|---|---|
| Quadrant D | 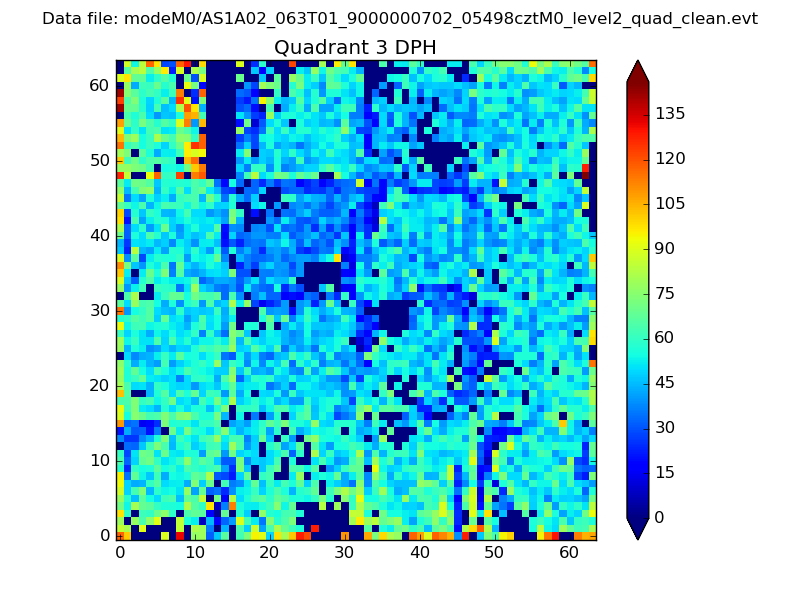 |
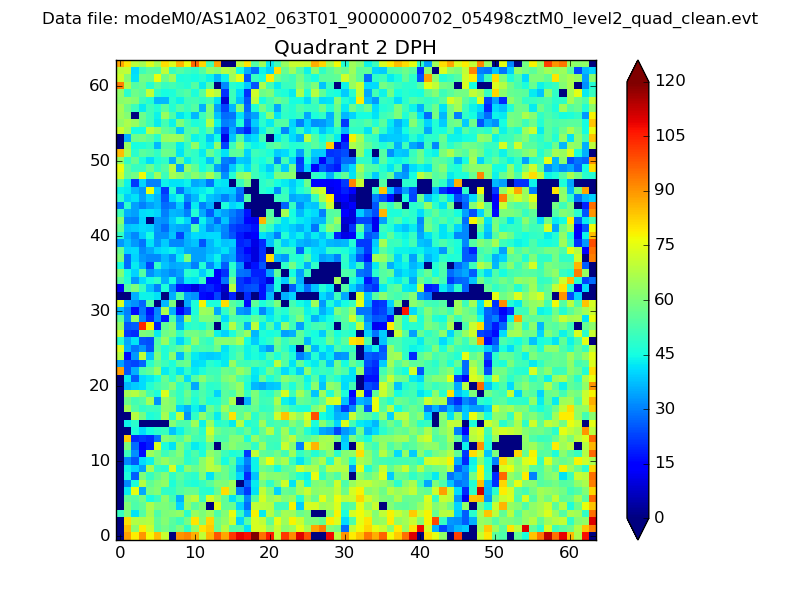 |
Quadrant C |
| Plot type | Count rate plots | Images |
|---|---|---|
| Comparison with Poisson distribution Blue bars denote a histogram of data divided into 1 sec bins. Red curve is a Poisson curve with rate = median count rate of data. |
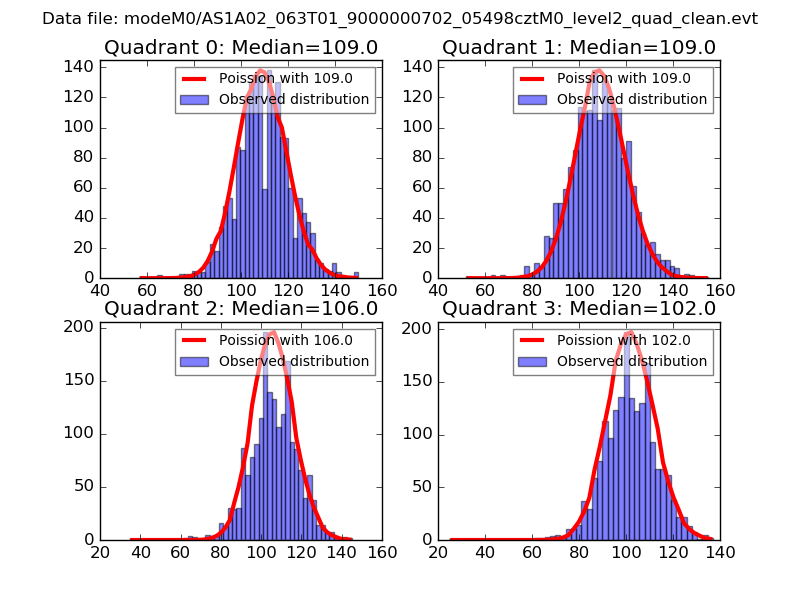 |
 |
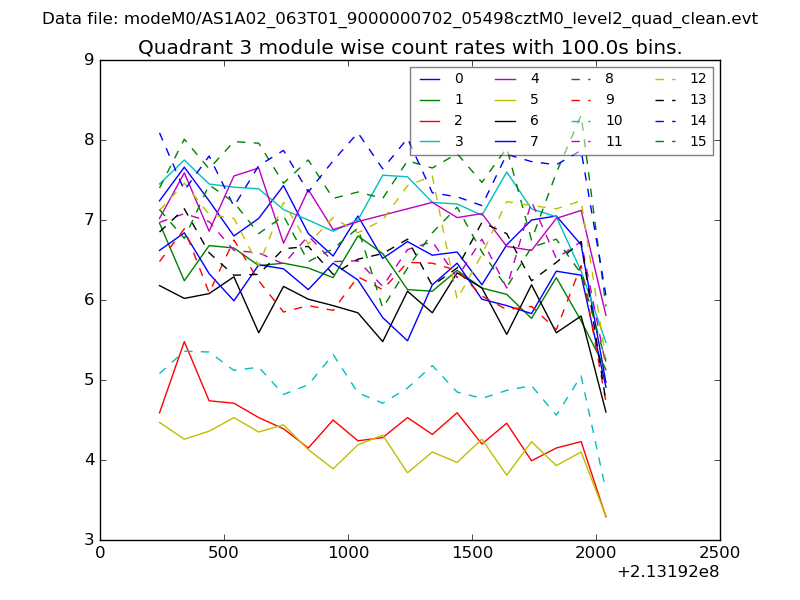
| Quadrant-wise count rates Data is divided into 100 sec bins |
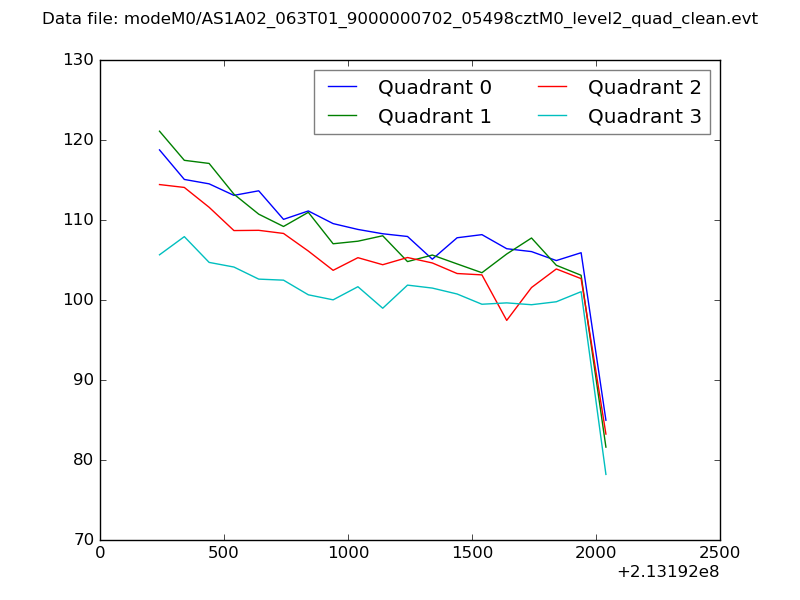 |
|
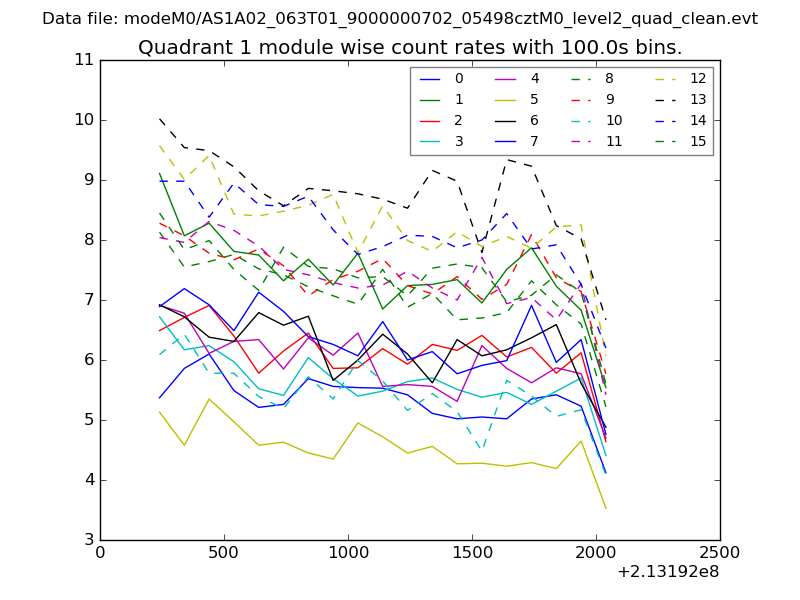
| Module-wise count rates for Quadrant A Data is divided into 100 sec bins |
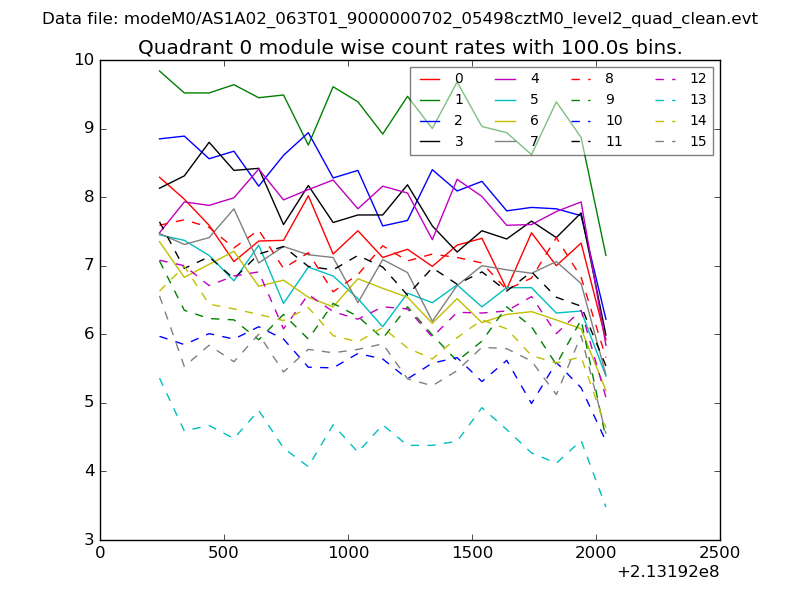 |
 |
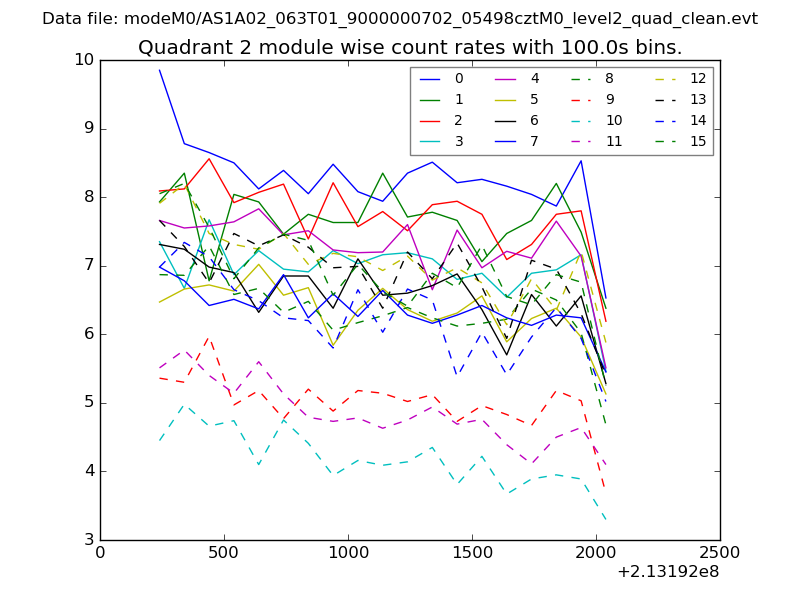
| Module-wise count rates for Quadrant B Data is divided into 100 sec bins |
 |
 |
| Module-wise count rates for Quadrant C Data is divided into 100 sec bins |
 |
 |
| Module-wise count rates for Quadrant D Data is divided into 100 sec bins |
 |
 |
| Parameter | Plot |
|---|---|
| CZT HV Monitor | 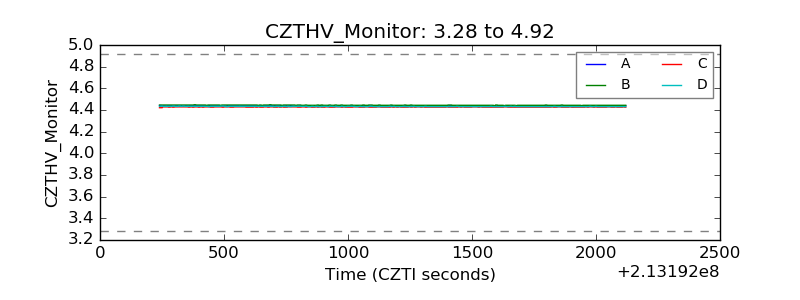 |
| D_VDD | 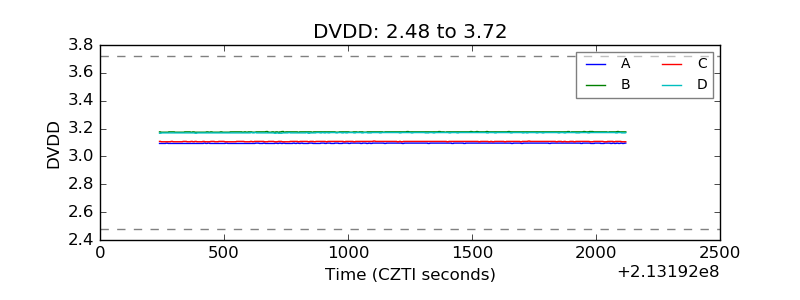 |
| Temperature 1 | 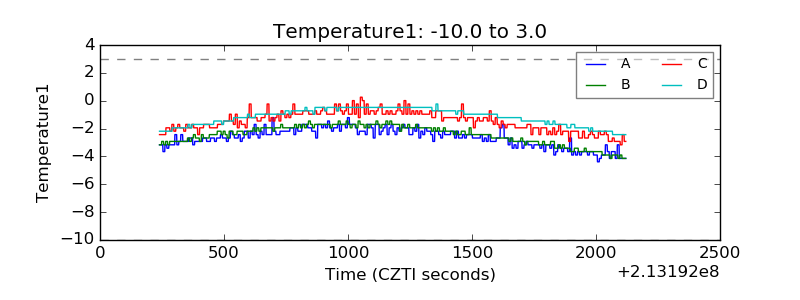 |
| Veto HV Monitor | 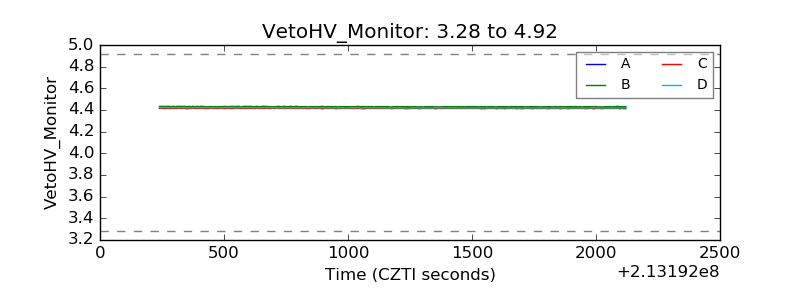 |
| Veto LLD |  |
| Alpha Counter | 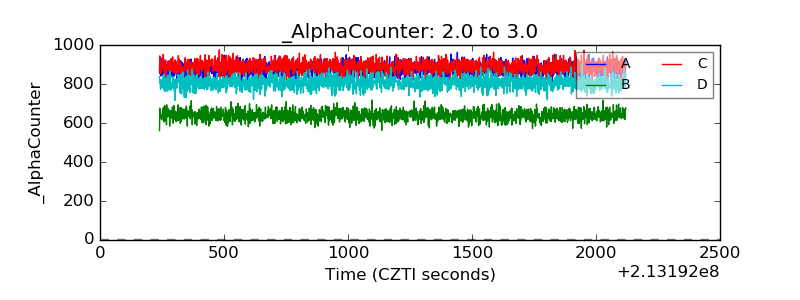 |
| _CPM_Rate | 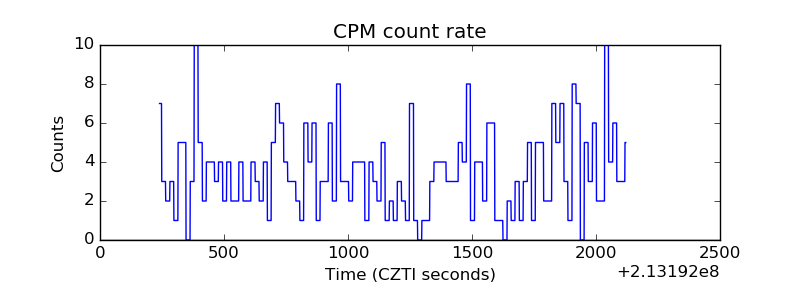 |
| CZT Counter | 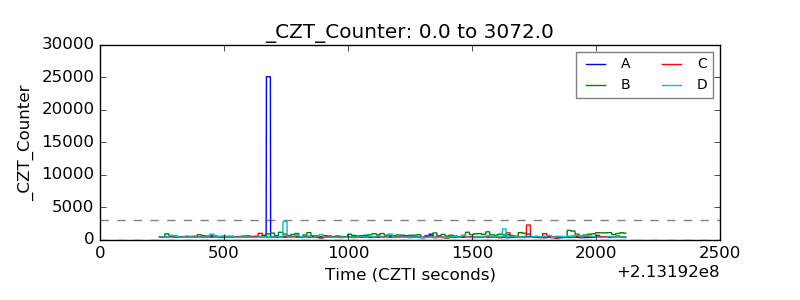 |
| +2.5 Volts monitor |  |
| +5 Volts monitor | 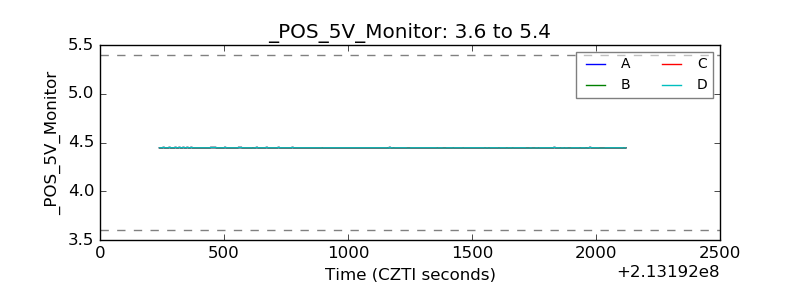 |
| _ROLL_ROT |  |
| _Roll_DEC | 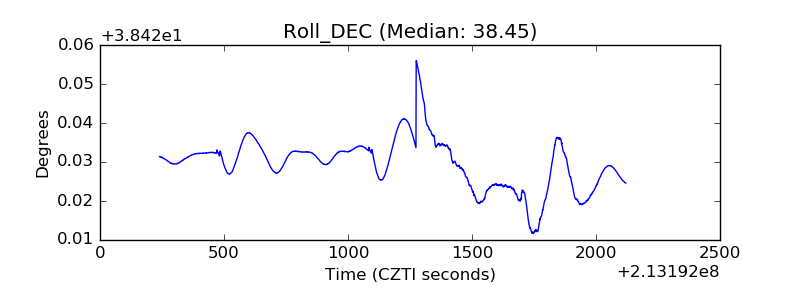 |
| _Roll_RA | 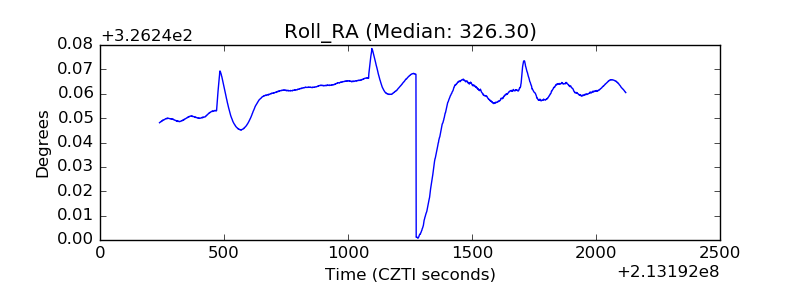 |
| Veto Counter | 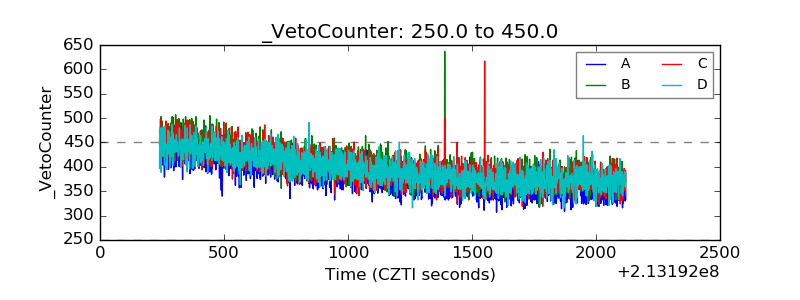 |