| Param | Original file | Final file |
|---|---|---|
| Filename | modeM0/AS1G06_139T01_9000000700cztM0_level2.fits | modeM0/AS1G06_139T01_9000000700cztM0_level2_quad_clean.evt |
| Size (bytes) | 314,398,080 | 266,356,800 |
| Size | 299.8 MB | 254.0 MB |
| Events in quadrant A | 1,917,514 | 1,510,508 |
| Events in quadrant B | 1,846,424 | 1,495,453 |
| Events in quadrant C | 1,859,040 | 1,449,987 |
| Events in quadrant D | 1,618,798 | 1,330,229 |
| Mode M9 | |||
|---|---|---|---|
| Quadrant | BADHDUFLAG | Total packets | Discarded packets |
| A | 0 | 78 | 0 |
| B | 0 | 78 | 0 |
| C | 0 | 78 | 0 |
| D | 0 | 78 | 0 |
| Mode SS | |||
|---|---|---|---|
| Quadrant | BADHDUFLAG | Total packets | Discarded packets |
| A | 0 | 678 | 0 |
| B | 0 | 678 | 0 |
| C | 0 | 678 | 0 |
| D | 0 | 678 | 0 |
| Mode M0 | |||
|---|---|---|---|
| Quadrant | BADHDUFLAG | Total packets | Discarded packets |
| A | 0 | 69240 | 0 |
| B | 0 | 73170 | 0 |
| C | 0 | 75190 | 0 |
| D | 0 | 85378 | 0 |
| Quadrant | Total seconds | Saturated seconds | Saturation percentage |
|---|---|---|---|
| A | 33174 | 464 | 1.398686% |
| B | 33174 | 537 | 1.618738% |
| C | 33171 | 921 | 2.776522% |
| D | 33173 | 1130 | 3.406385% |
Noise dominated data is calculated using 1-second bins in cleaned event files. If a bin has >2000 counts, and if more than 50% of those come from <1% of pixels, then it is considered to be noise-dominated and hence unusable.
| Quadrant | # 1 sec bins | Bins with >0 counts | Bins with >2000 counts | High rate bins dominated by noise | Noise dominated (total time) | Noise dominated (detector-on time) | Marked lightcurve |
|---|---|---|---|---|---|---|---|
| A | 41005 | 33175 | 0 | 0 | 0.00% | 0.00% |  |
| B | 41005 | 33175 | 0 | 0 | 0.00% | 0.00% |  |
| C | 41005 | 33173 | 0 | 0 | 0.00% | 0.00% | 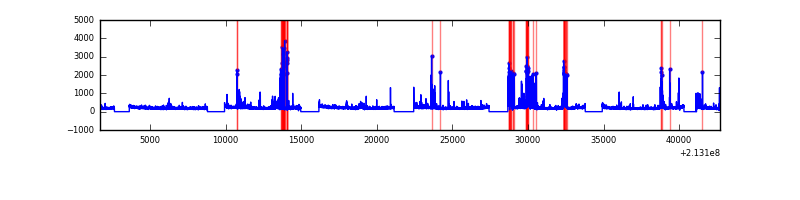 |
| D | 41005 | 33172 | 0 | 0 | 0.00% | 0.00% | 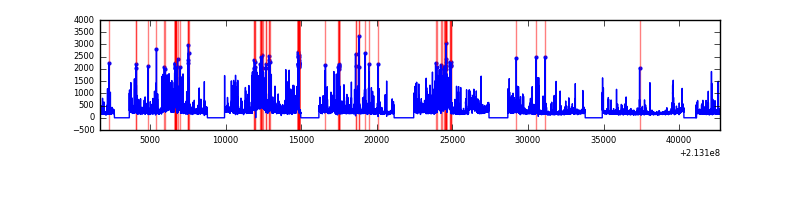 |
Top three noisy pixels from each quadrant. If the there are fewer than three noisy pixels in the level2.evt file, extra rows are filled as -1
| Pixel properties | Quadrant properties | ||||||
|---|---|---|---|---|---|---|---|
| Quadrant | DetID | PixID | Counts | Sigma | Mean | Median | Sigma |
| A | 0 | 29 | 1817 | 10.46 | 499 | 466 | 129.2 |
| A | 7 | 110 | 1635 | 9.05 | 499 | 466 | 129.2 |
| A | 0 | 30 | 1446 | 7.59 | 499 | 466 | 129.2 |
| B | 2 | 9 | 1611 | 11.53 | 487 | 464 | 99.5 |
| B | 12 | 226 | 1401 | 9.42 | 487 | 464 | 99.5 |
| B | 5 | 128 | 1383 | 9.24 | 487 | 464 | 99.5 |
| C | 1 | 80 | 1333 | 6.67 | 490 | 453 | 131.9 |
| C | 12 | 241 | 1303 | 6.45 | 490 | 453 | 131.9 |
| C | 2 | 191 | 1303 | 6.45 | 490 | 453 | 131.9 |
| D | 11 | 82 | 1311 | 7.09 | 461 | 419 | 125.8 |
| D | 6 | 231 | 1215 | 6.33 | 461 | 419 | 125.8 |
| D | 3 | 14 | 1212 | 6.3 | 461 | 419 | 125.8 |
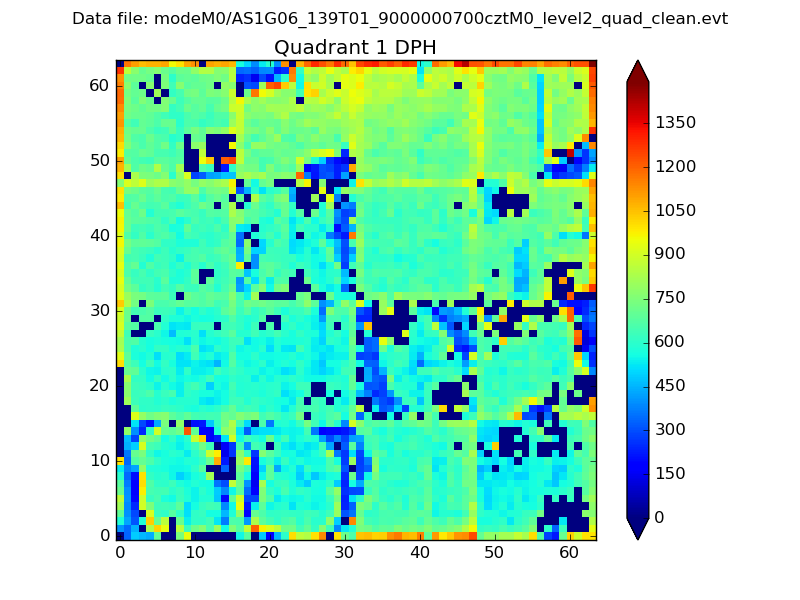
Histogram calculated using DETX and DETY for each event in the final _common_clean file
| Quadrant A |  |
 |
Quadrant B |
|---|---|---|---|
| Quadrant D | 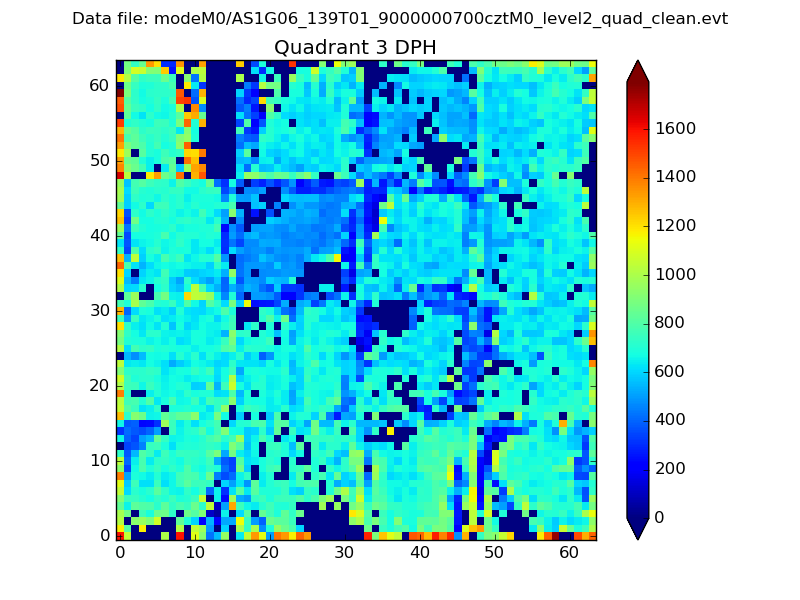 |
 |
Quadrant C |
| Plot type | Count rate plots | Images |
|---|---|---|
| Comparison with Poisson distribution Blue bars denote a histogram of data divided into 1 sec bins. Red curve is a Poisson curve with rate = median count rate of data. |
 |
 |
| Quadrant-wise count rates Data is divided into 100 sec bins |
 |
|
| Module-wise count rates for Quadrant A Data is divided into 100 sec bins |
 |
 |
| Module-wise count rates for Quadrant B Data is divided into 100 sec bins |
 |
 |
| Module-wise count rates for Quadrant C Data is divided into 100 sec bins |
 |
 |
| Module-wise count rates for Quadrant D Data is divided into 100 sec bins |
 |
 |
| Parameter | Plot |
|---|---|
| CZT HV Monitor |  |
| D_VDD |  |
| Temperature 1 | 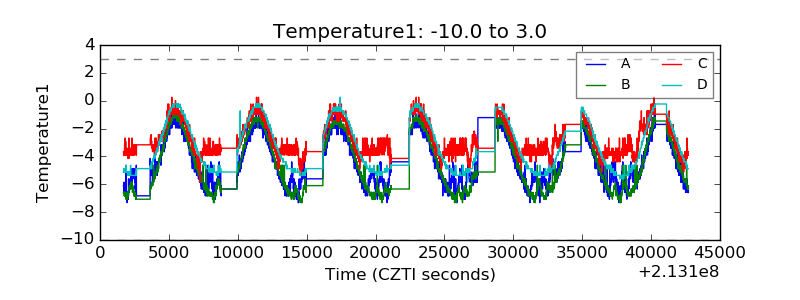 |
| Veto HV Monitor | 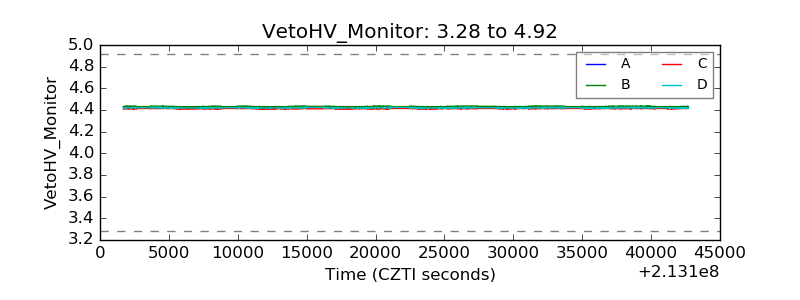 |
| Veto LLD |  |
| Alpha Counter | 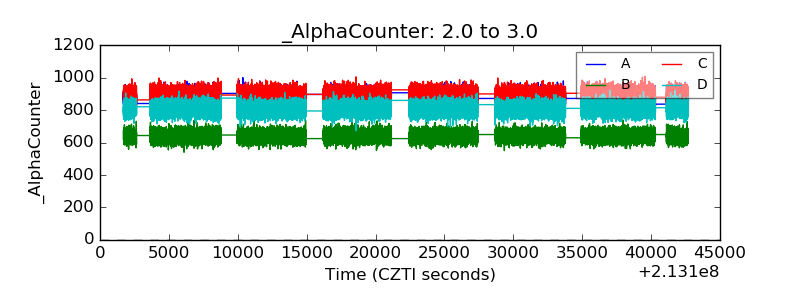 |
| _CPM_Rate | 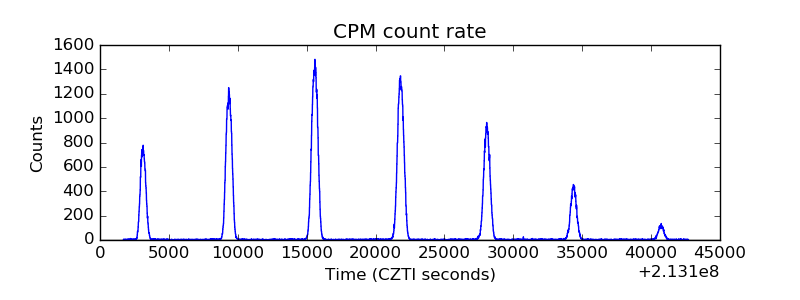 |
| CZT Counter | 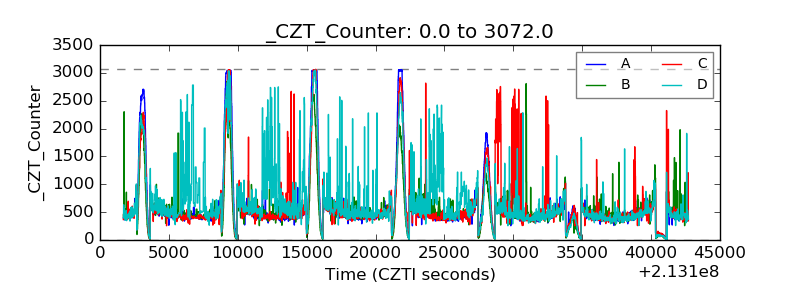 |
| +2.5 Volts monitor |  |
| +5 Volts monitor |  |
| _ROLL_ROT |  |
| _Roll_DEC |  |
| _Roll_RA | 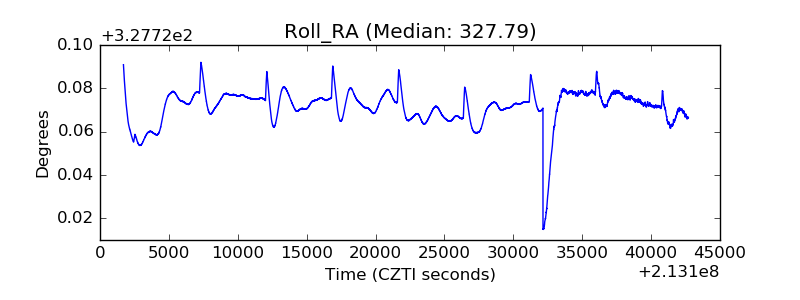 |
| Veto Counter |  |