| Param | Original file | Final file |
|---|---|---|
| Filename | modeM0/AS1G06_139T01_9000000700_05481cztM0_level2.evt | modeM0/AS1G06_139T01_9000000700_05481cztM0_level2_quad_clean.evt |
| Size (bytes) | 170,919,360 | 20,738,880 |
| Size | 163.0 MB | 19.8 MB |
| Events in quadrant A | 1,189,452 | 114,092 |
| Events in quadrant B | 1,275,754 | 115,397 |
| Events in quadrant C | 1,199,567 | 116,451 |
| Events in quadrant D | 1,349,443 | 112,000 |
| Mode M9 | |||
|---|---|---|---|
| Quadrant | BADHDUFLAG | Total packets | Discarded packets |
| A | 0 | 10 | 0 |
| B | 0 | 10 | 0 |
| C | 0 | 10 | 0 |
| D | 0 | 10 | 0 |
| Mode SS | |||
|---|---|---|---|
| Quadrant | BADHDUFLAG | Total packets | Discarded packets |
| A | 0 | 48 | 0 |
| B | 0 | 48 | 0 |
| C | 0 | 48 | 0 |
| D | 0 | 48 | 0 |
| Mode M0 | |||
|---|---|---|---|
| Quadrant | BADHDUFLAG | Total packets | Discarded packets |
| A | 0 | 4981 | 2 |
| B | 0 | 5236 | 1 |
| C | 0 | 5022 | 1 |
| D | 0 | 5552 | 1 |
| Quadrant | Total seconds | Saturated seconds | Saturation percentage |
|---|---|---|---|
| A | 2352 | 74 | 3.146259% |
| B | 2352 | 80 | 3.401361% |
| C | 2352 | 60 | 2.551020% |
| D | 2352 | 86 | 3.656463% |
Noise dominated data is calculated using 1-second bins in cleaned event files. If a bin has >2000 counts, and if more than 50% of those come from <1% of pixels, then it is considered to be noise-dominated and hence unusable.
| Quadrant | # 1 sec bins | Bins with >0 counts | Bins with >2000 counts | High rate bins dominated by noise | Noise dominated (total time) | Noise dominated (detector-on time) | Marked lightcurve |
|---|---|---|---|---|---|---|---|
| A | 3337 | 2353 | 0 | 0 | 0.00% | 0.00% | 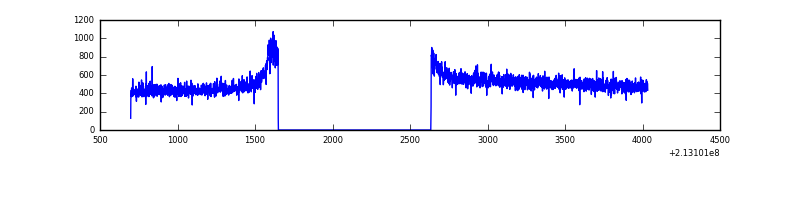 |
| B | 3337 | 2353 | 3 | 3 | 0.09% | 0.13% |  |
| C | 3337 | 2353 | 0 | 0 | 0.00% | 0.00% | 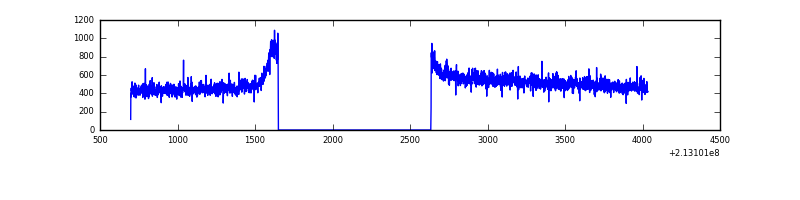 |
| D | 3337 | 2353 | 10 | 10 | 0.30% | 0.42% | 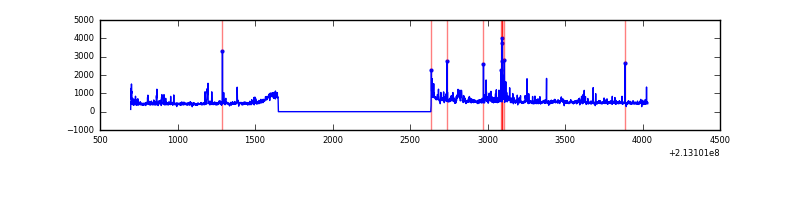 |
Top three noisy pixels from each quadrant. If the there are fewer than three noisy pixels in the level2.evt file, extra rows are filled as -1
| Pixel properties | Quadrant properties | ||||||
|---|---|---|---|---|---|---|---|
| Quadrant | DetID | PixID | Counts | Sigma | Mean | Median | Sigma |
| A | 12 | 194 | 3039 | 42.3 | 308 | 301 | 64.7 |
| A | 0 | 226 | 2985 | 41.47 | 308 | 301 | 64.7 |
| A | 13 | 6 | 1601 | 20.09 | 308 | 301 | 64.7 |
| B | 15 | 204 | 47333 | 756.59 | 310 | 303 | 62.2 |
| B | 4 | 48 | 18697 | 295.91 | 310 | 303 | 62.2 |
| B | 12 | 111 | 5812 | 88.63 | 310 | 303 | 62.2 |
| C | 1 | 16 | 15637 | 213.34 | 301 | 303 | 71.9 |
| C | 9 | 247 | 4746 | 61.81 | 301 | 303 | 71.9 |
| C | 13 | 61 | 2501 | 30.58 | 301 | 303 | 71.9 |
| D | 2 | 152 | 94671 | 1252.19 | 301 | 292 | 75.4 |
| D | 12 | 233 | 40170 | 529.09 | 301 | 292 | 75.4 |
| D | 8 | 195 | 23382 | 306.35 | 301 | 292 | 75.4 |
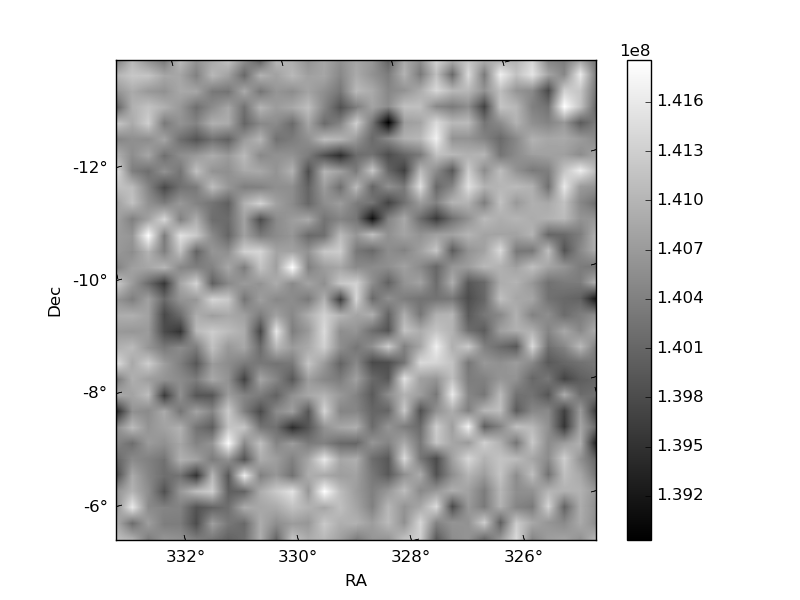
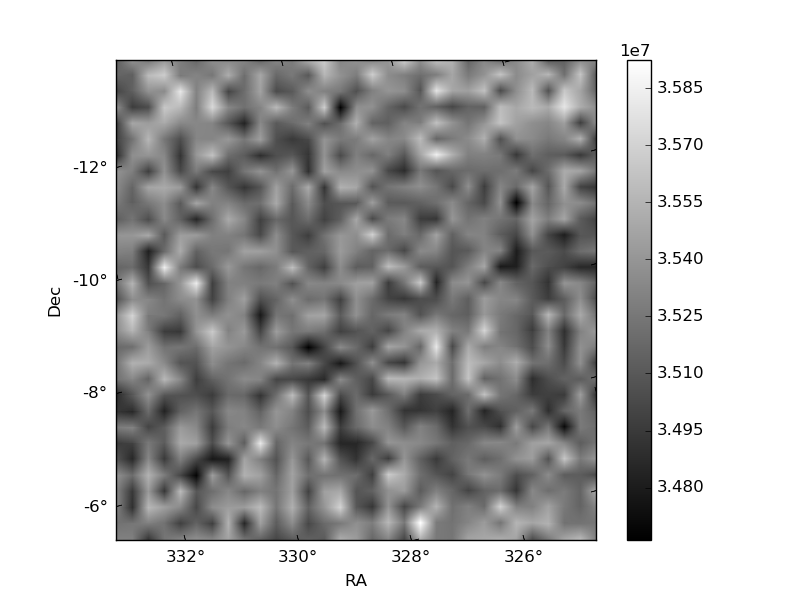
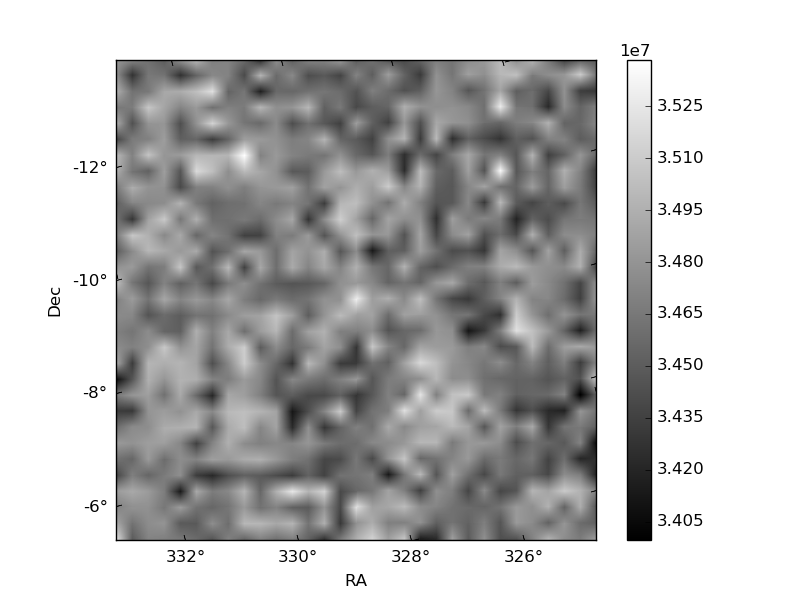
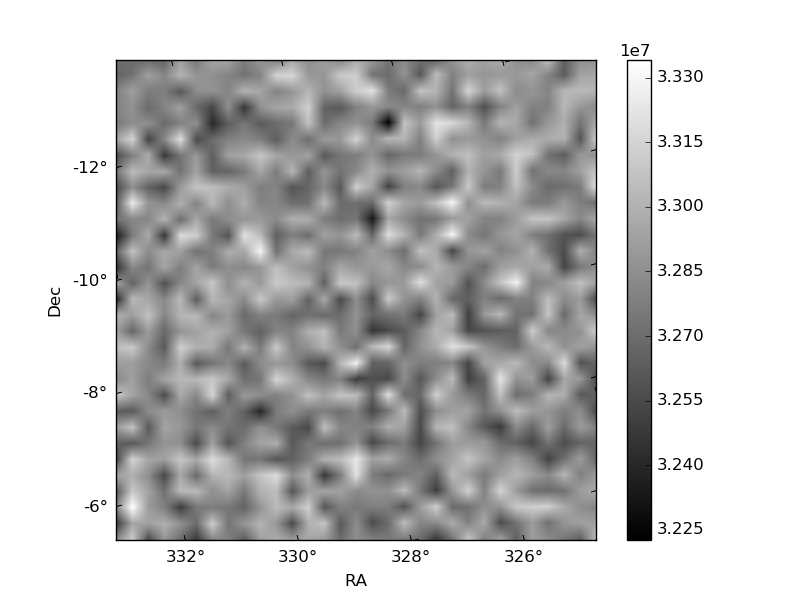
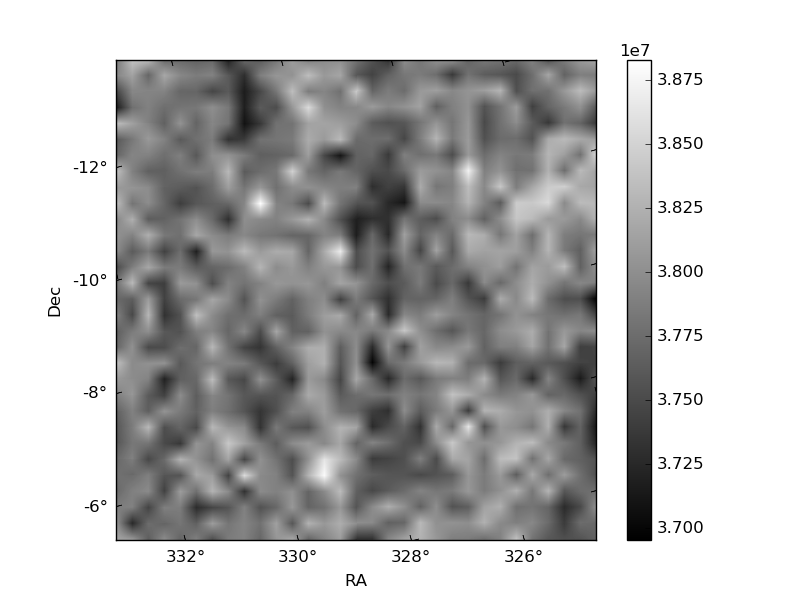
Histogram calculated using DETX and DETY for each event in the final _common_clean file
| Quadrant A | 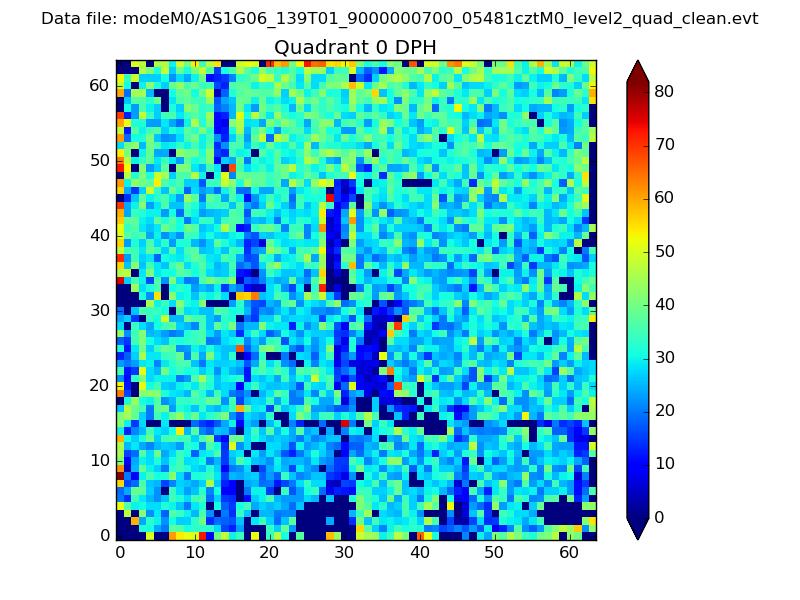 |
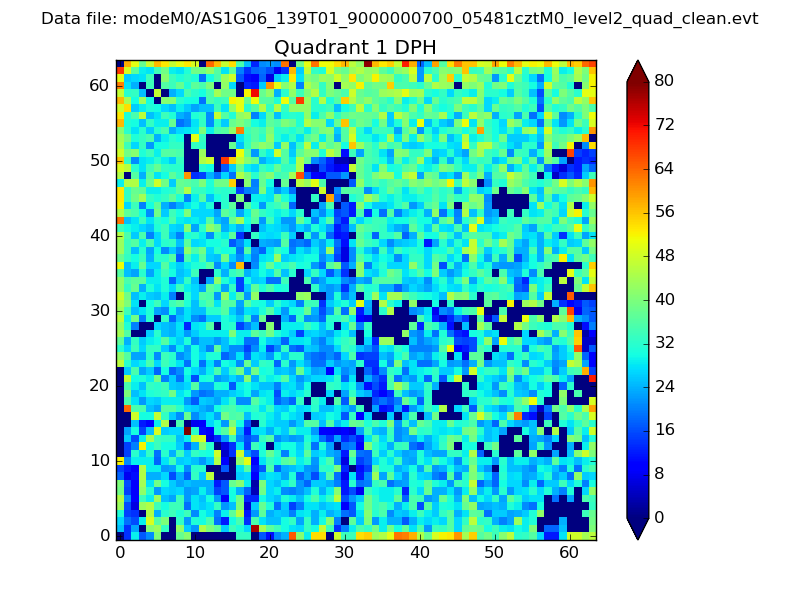 |
Quadrant B |
|---|---|---|---|
| Quadrant D | 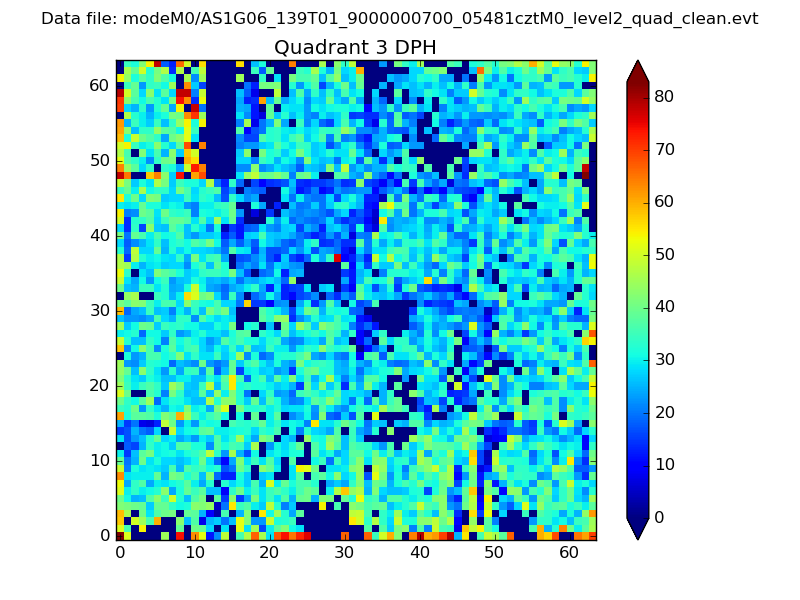 |
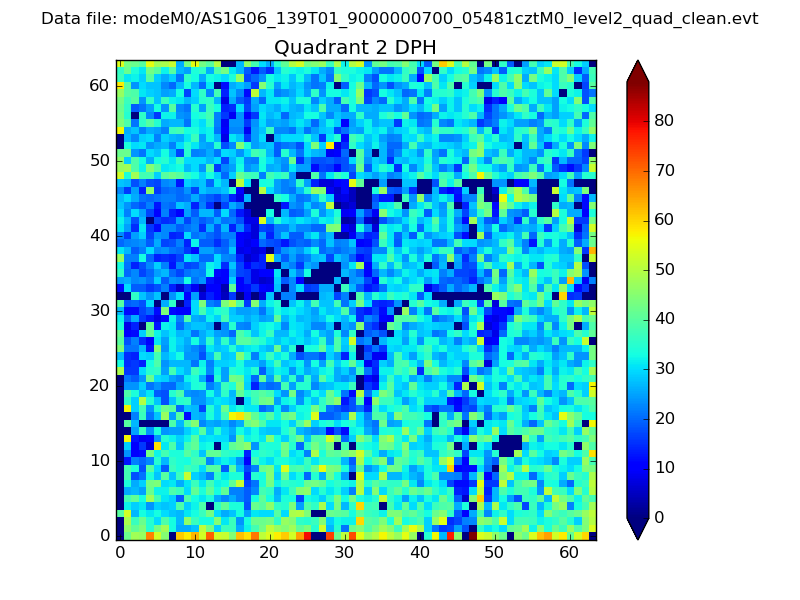 |
Quadrant C |
| Plot type | Count rate plots | Images |
|---|---|---|
| Comparison with Poisson distribution Blue bars denote a histogram of data divided into 1 sec bins. Red curve is a Poisson curve with rate = median count rate of data. |
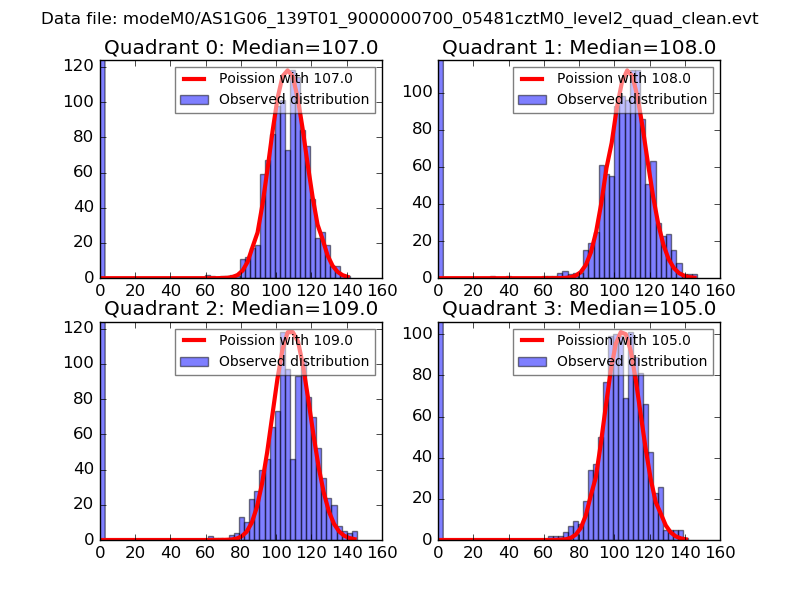 |
 |
| Quadrant-wise count rates Data is divided into 100 sec bins |
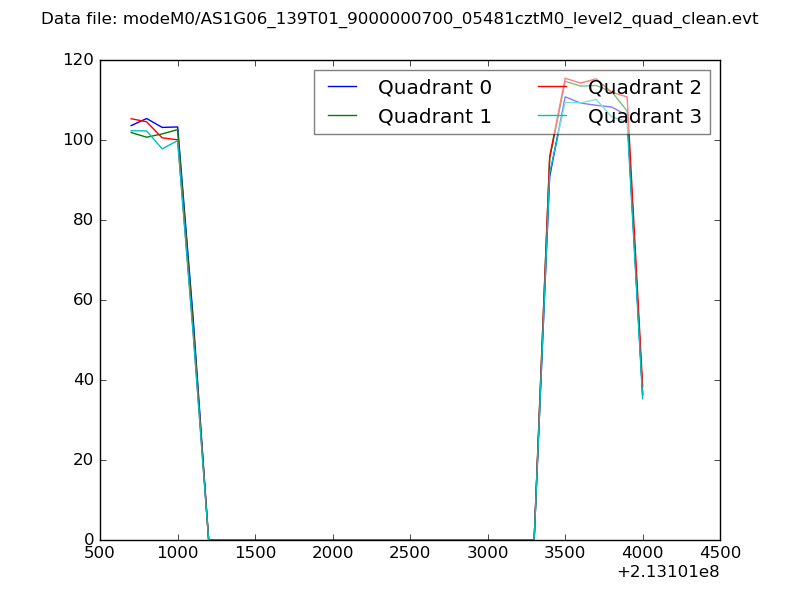 |
|
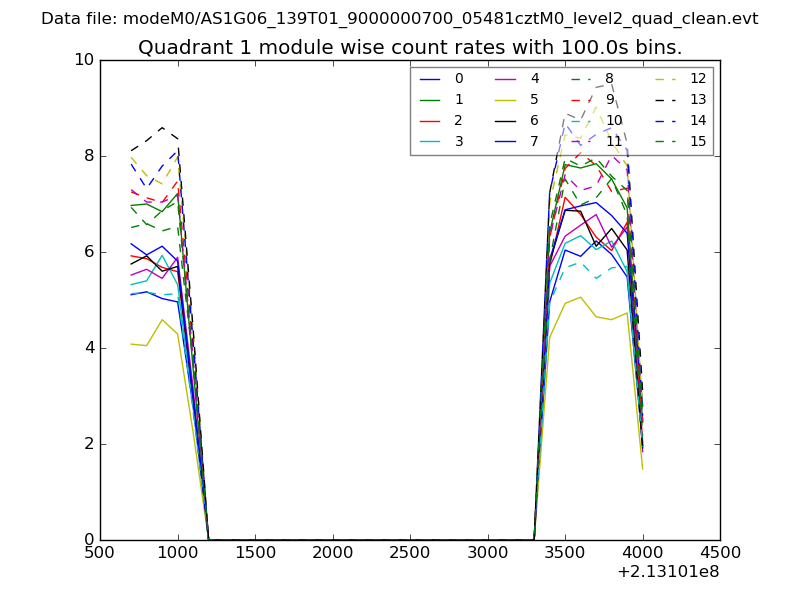
| Module-wise count rates for Quadrant A Data is divided into 100 sec bins |
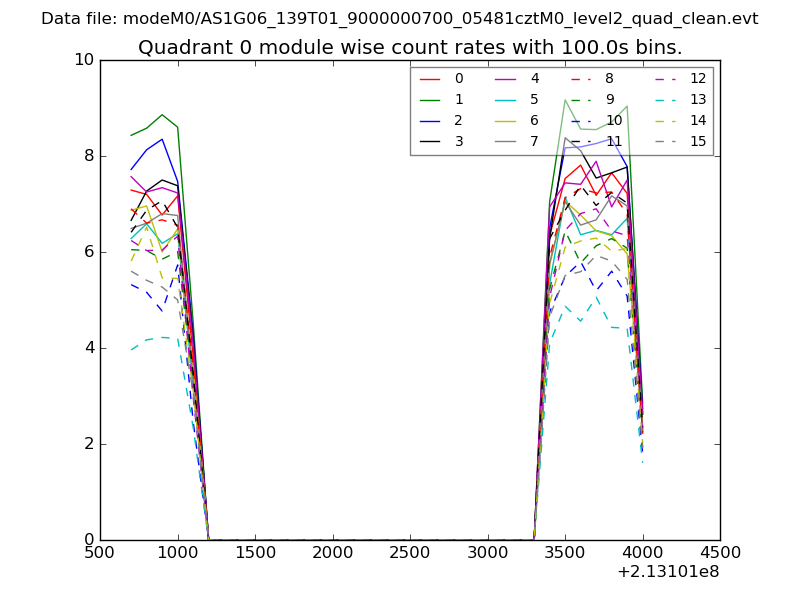 |
 |
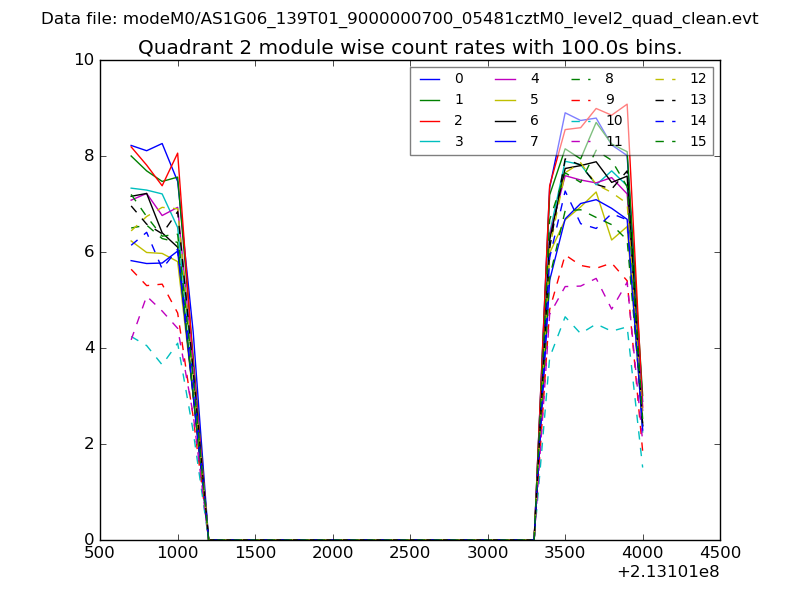
| Module-wise count rates for Quadrant B Data is divided into 100 sec bins |
 |
 |
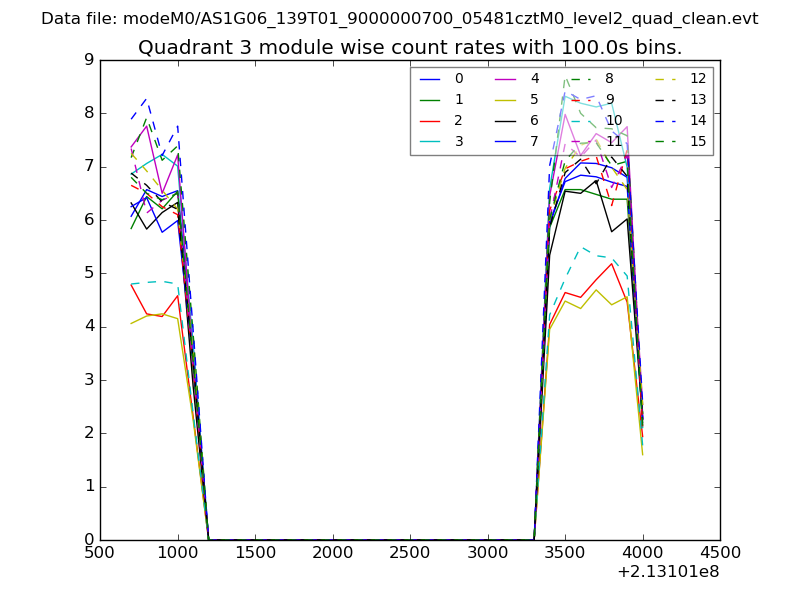
| Module-wise count rates for Quadrant C Data is divided into 100 sec bins |
 |
 |
| Module-wise count rates for Quadrant D Data is divided into 100 sec bins |
 |
 |
| Parameter | Plot |
|---|---|
| CZT HV Monitor | 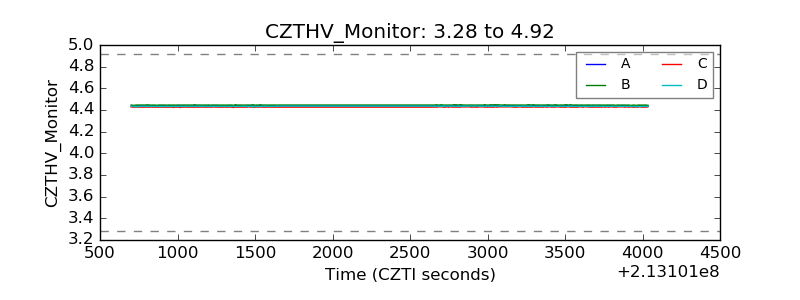 |
| D_VDD | 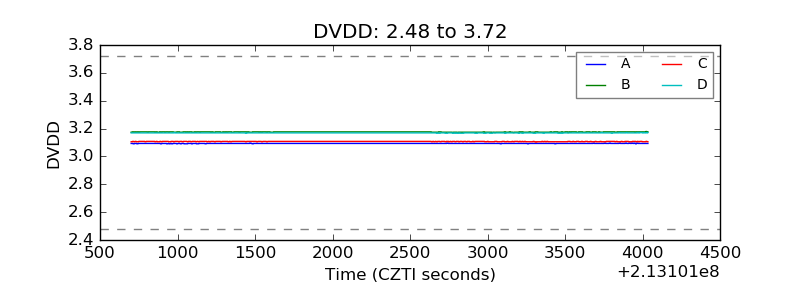 |
| Temperature 1 | 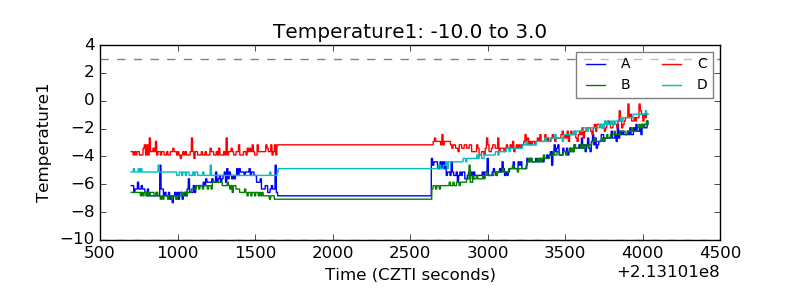 |
| Veto HV Monitor | 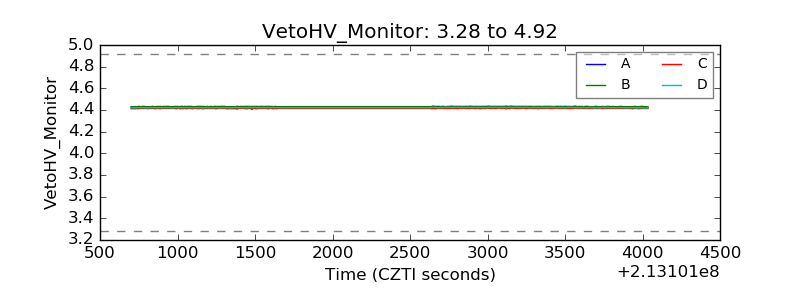 |
| Veto LLD | 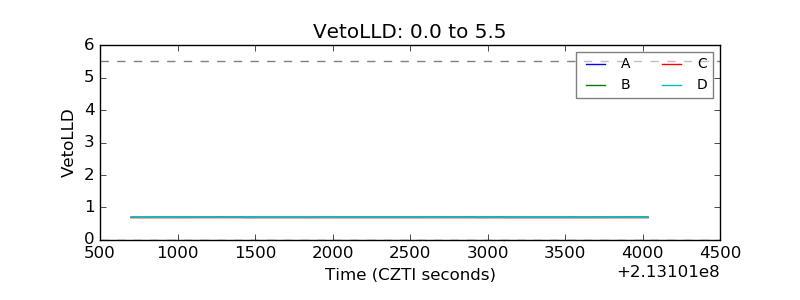 |
| Alpha Counter | 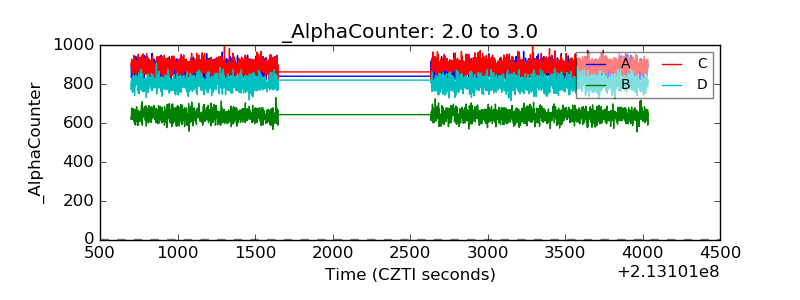 |
| _CPM_Rate | 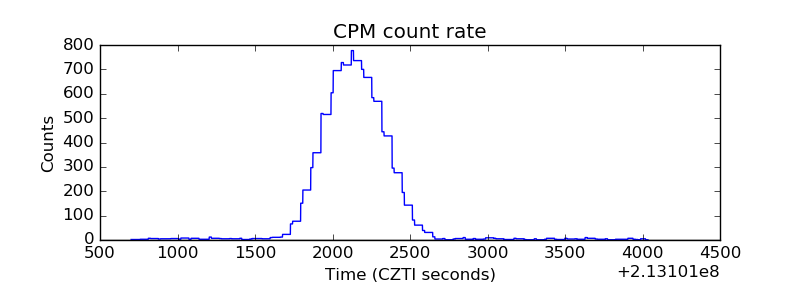 |
| CZT Counter |  |
| +2.5 Volts monitor |  |
| +5 Volts monitor |  |
| _ROLL_ROT | 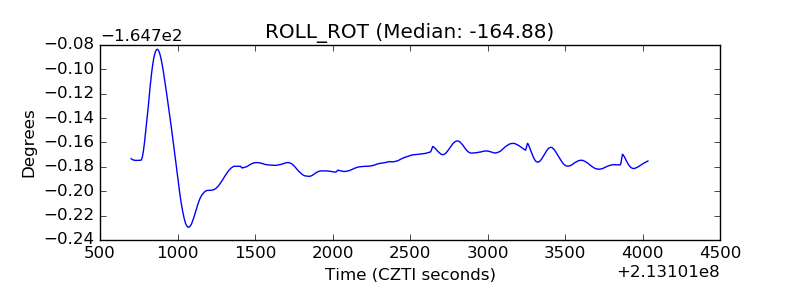 |
| _Roll_DEC | 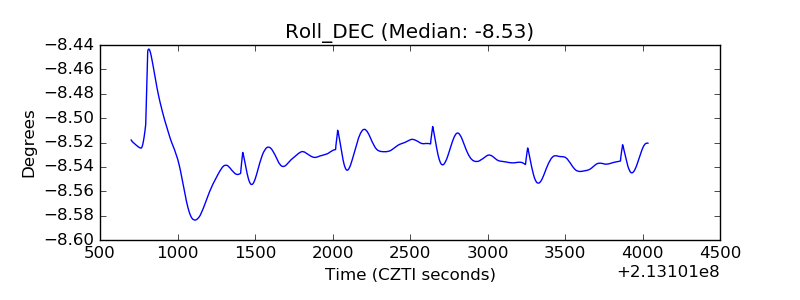 |
| _Roll_RA | 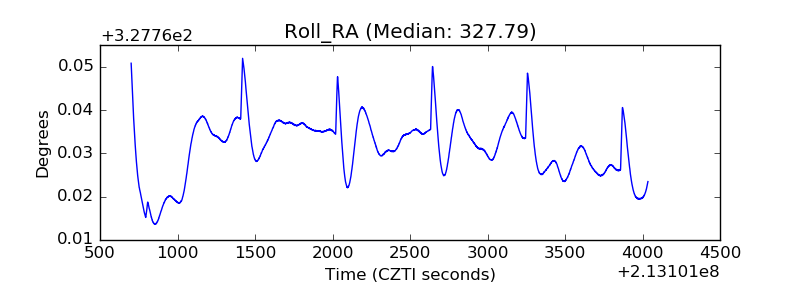 |
| Veto Counter | 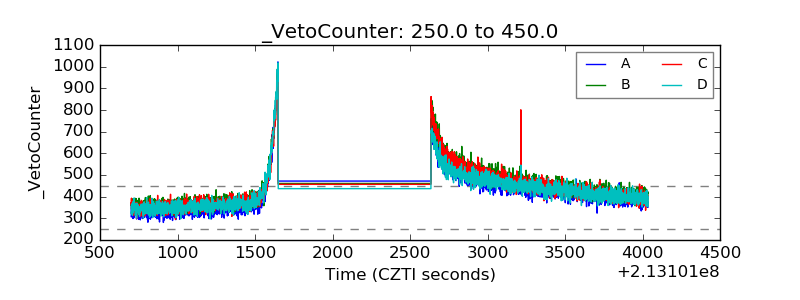 |