| Param | Original file | Final file |
|---|---|---|
| Filename | modeM0/AS1G06_139T01_9000000700_05483cztM0_level2.evt | modeM0/AS1G06_139T01_9000000700_05483cztM0_level2_quad_clean.evt |
| Size (bytes) | 527,362,560 | 83,805,120 |
| Size | 502.9 MB | 79.9 MB |
| Events in quadrant A | 3,456,341 | 510,129 |
| Events in quadrant B | 3,696,212 | 514,751 |
| Events in quadrant C | 3,466,915 | 520,123 |
| Events in quadrant D | 4,865,949 | 494,349 |
| Mode M9 | |||
|---|---|---|---|
| Quadrant | BADHDUFLAG | Total packets | Discarded packets |
| A | 0 | 21 | 0 |
| B | 0 | 21 | 0 |
| C | 0 | 21 | 0 |
| D | 0 | 21 | 0 |
| Mode SS | |||
|---|---|---|---|
| Quadrant | BADHDUFLAG | Total packets | Discarded packets |
| A | 0 | 148 | 0 |
| B | 0 | 148 | 0 |
| C | 0 | 148 | 0 |
| D | 0 | 148 | 0 |
| Mode M0 | |||
|---|---|---|---|
| Quadrant | BADHDUFLAG | Total packets | Discarded packets |
| A | 0 | 15017 | 3 |
| B | 0 | 15563 | 2 |
| C | 0 | 15158 | 2 |
| D | 0 | 19223 | 2 |
| Quadrant | Total seconds | Saturated seconds | Saturation percentage |
|---|---|---|---|
| A | 7152 | 145 | 2.027405% |
| B | 7152 | 140 | 1.957494% |
| C | 7152 | 118 | 1.649888% |
| D | 7152 | 300 | 4.194631% |
Noise dominated data is calculated using 1-second bins in cleaned event files. If a bin has >2000 counts, and if more than 50% of those come from <1% of pixels, then it is considered to be noise-dominated and hence unusable.
| Quadrant | # 1 sec bins | Bins with >0 counts | Bins with >2000 counts | High rate bins dominated by noise | Noise dominated (total time) | Noise dominated (detector-on time) | Marked lightcurve |
|---|---|---|---|---|---|---|---|
| A | 9272 | 7154 | 0 | 0 | 0.00% | 0.00% | 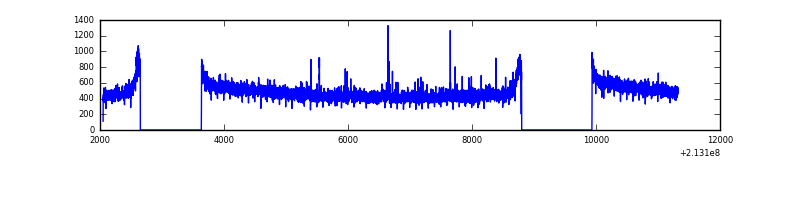 |
| B | 9272 | 7154 | 2 | 2 | 0.02% | 0.03% | 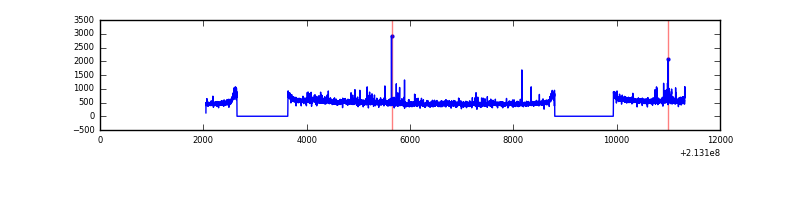 |
| C | 9272 | 7154 | 4 | 4 | 0.04% | 0.06% | 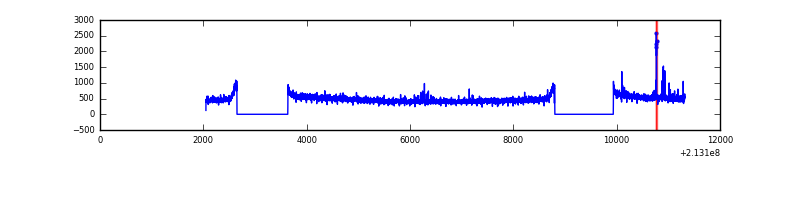 |
| D | 9272 | 7154 | 179 | 179 | 1.93% | 2.50% | 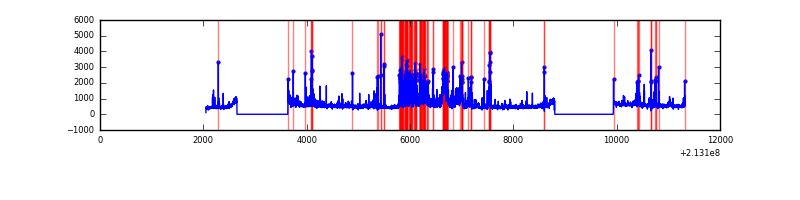 |
Top three noisy pixels from each quadrant. If the there are fewer than three noisy pixels in the level2.evt file, extra rows are filled as -1
| Pixel properties | Quadrant properties | ||||||
|---|---|---|---|---|---|---|---|
| Quadrant | DetID | PixID | Counts | Sigma | Mean | Median | Sigma |
| A | 0 | 50 | 15316 | 79.05 | 891 | 871 | 182.7 |
| A | 13 | 6 | 10371 | 51.99 | 891 | 871 | 182.7 |
| A | 12 | 194 | 8864 | 43.74 | 891 | 871 | 182.7 |
| B | 15 | 204 | 141182 | 817.15 | 894 | 873 | 171.7 |
| B | 15 | 54 | 20986 | 117.14 | 894 | 873 | 171.7 |
| B | 11 | 51 | 20605 | 114.92 | 894 | 873 | 171.7 |
| C | 9 | 247 | 85308 | 425.2 | 861 | 865 | 198.6 |
| C | 1 | 16 | 19101 | 91.82 | 861 | 865 | 198.6 |
| C | 13 | 61 | 7038 | 31.08 | 861 | 865 | 198.6 |
| D | 2 | 152 | 963031 | 4594.03 | 862 | 836 | 209.4 |
| D | 8 | 195 | 214754 | 1021.36 | 862 | 836 | 209.4 |
| D | 2 | 136 | 123674 | 586.49 | 862 | 836 | 209.4 |
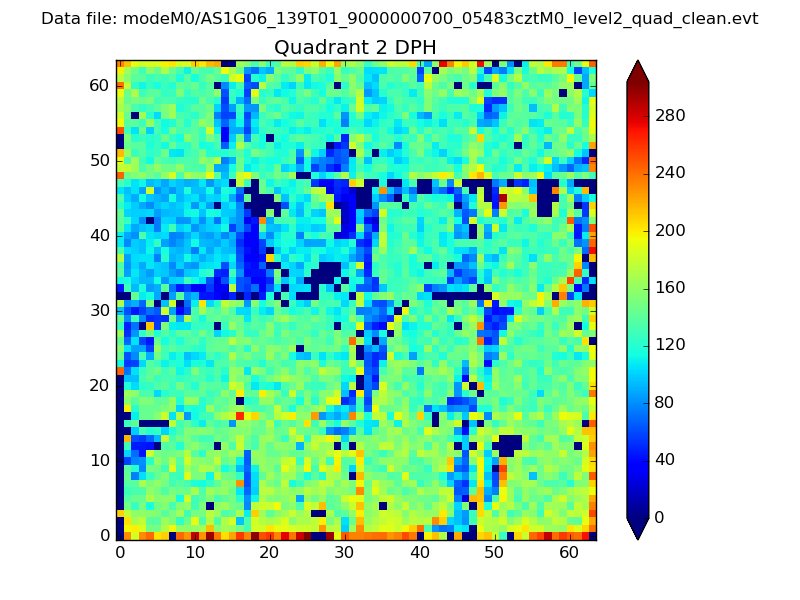
Histogram calculated using DETX and DETY for each event in the final _common_clean file
| Quadrant A | 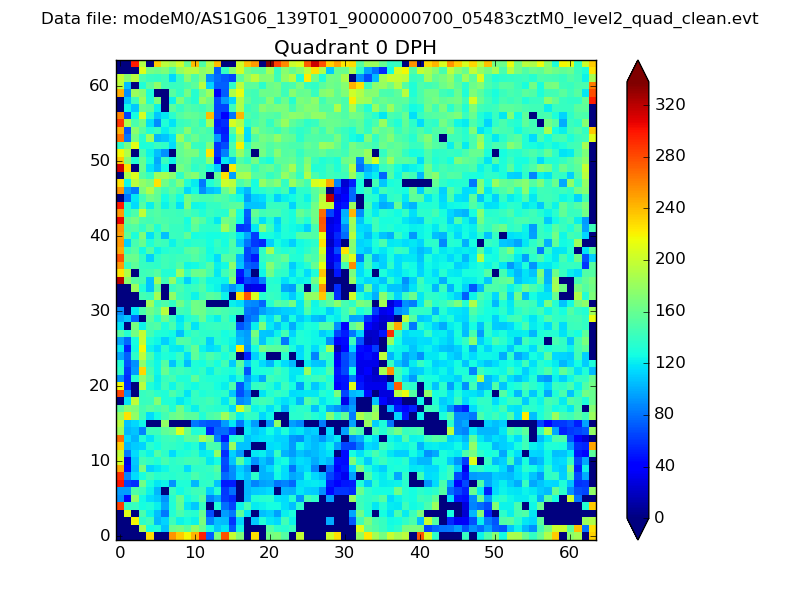 |
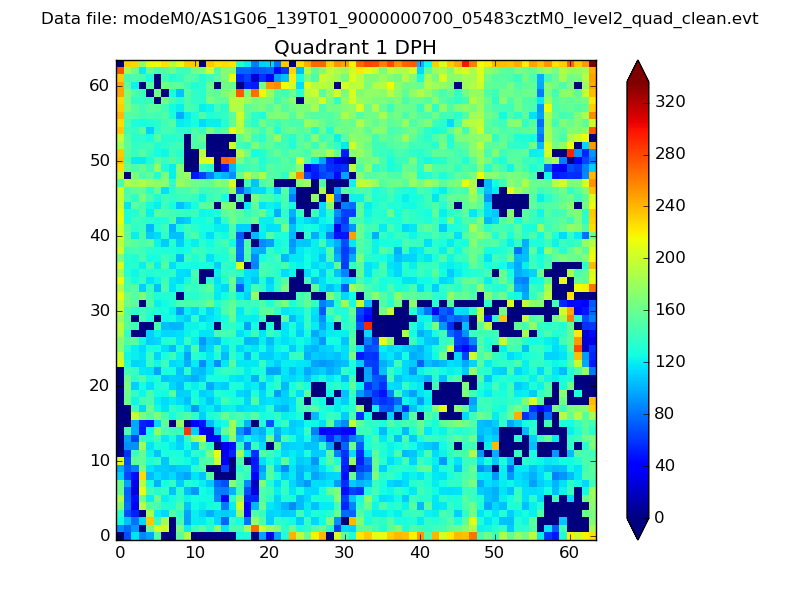 |
Quadrant B |
|---|---|---|---|
| Quadrant D | 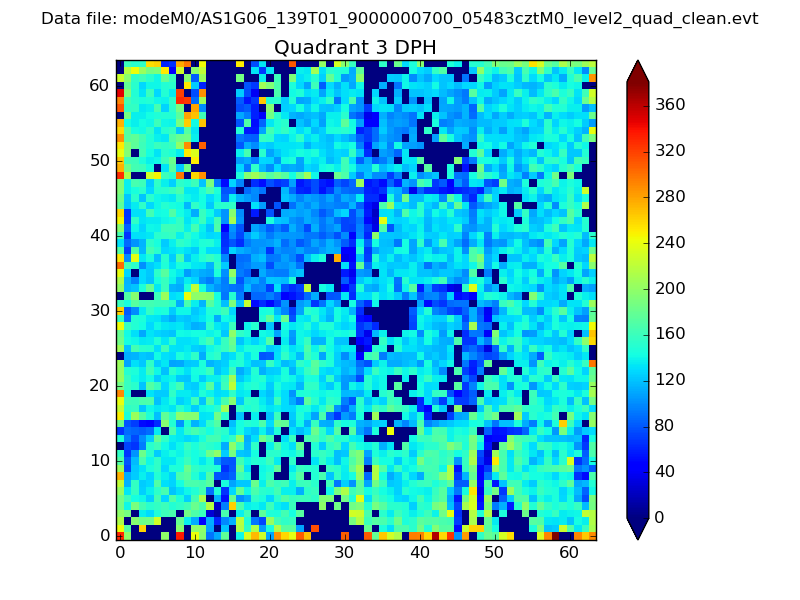 |
 |
Quadrant C |
| Plot type | Count rate plots | Images |
|---|---|---|
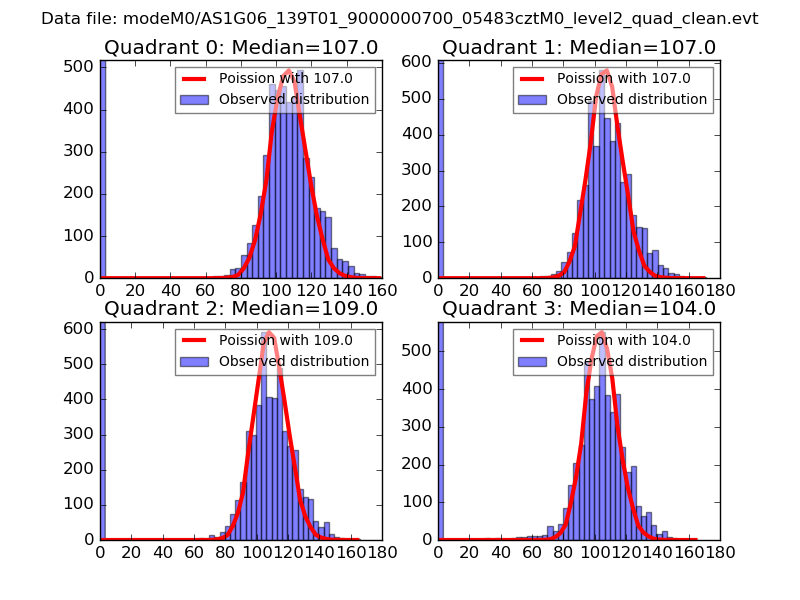
| Comparison with Poisson distribution Blue bars denote a histogram of data divided into 1 sec bins. Red curve is a Poisson curve with rate = median count rate of data. |
 |
 |
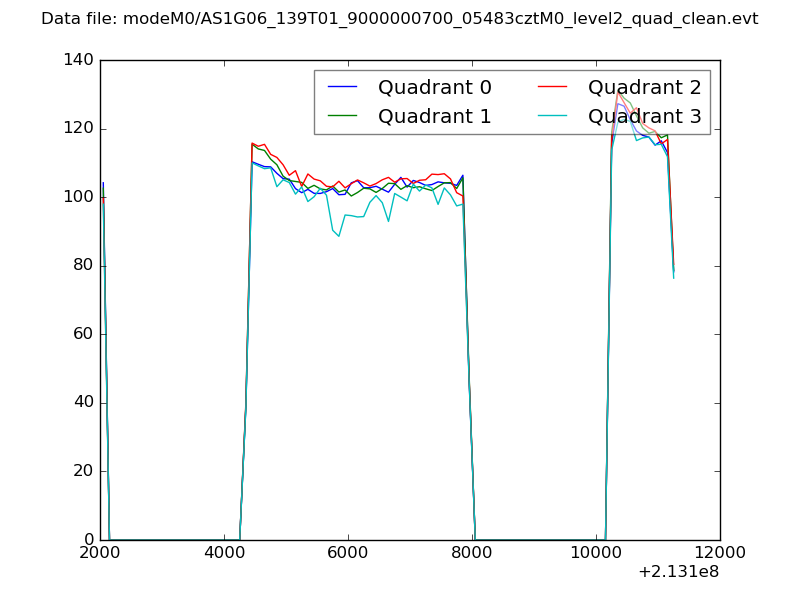
| Quadrant-wise count rates Data is divided into 100 sec bins |
 |
|
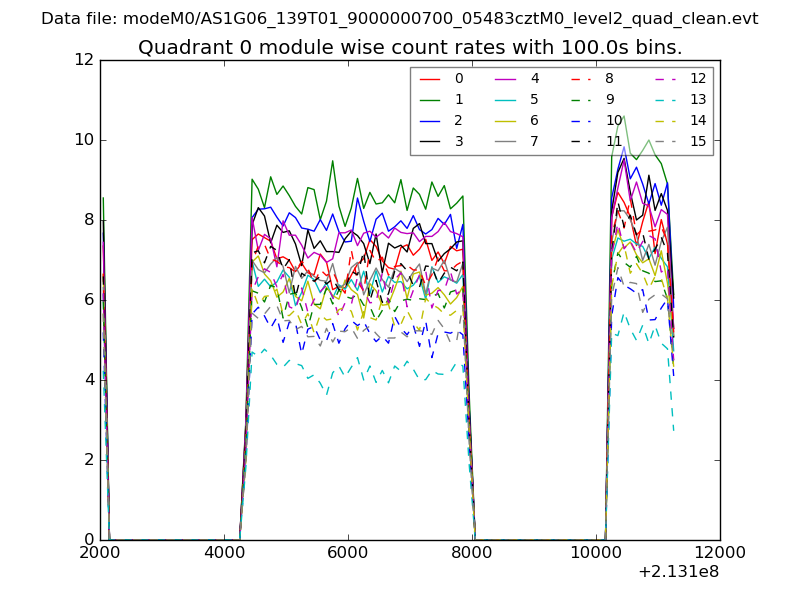
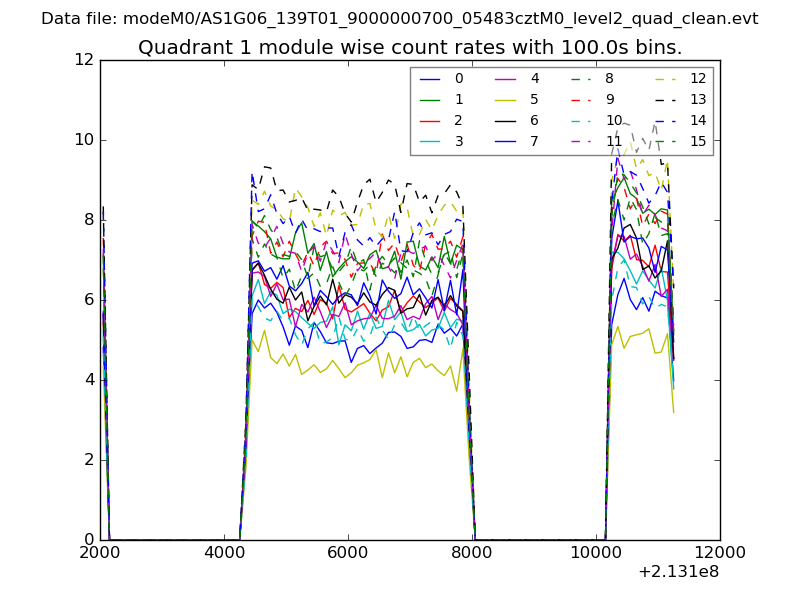
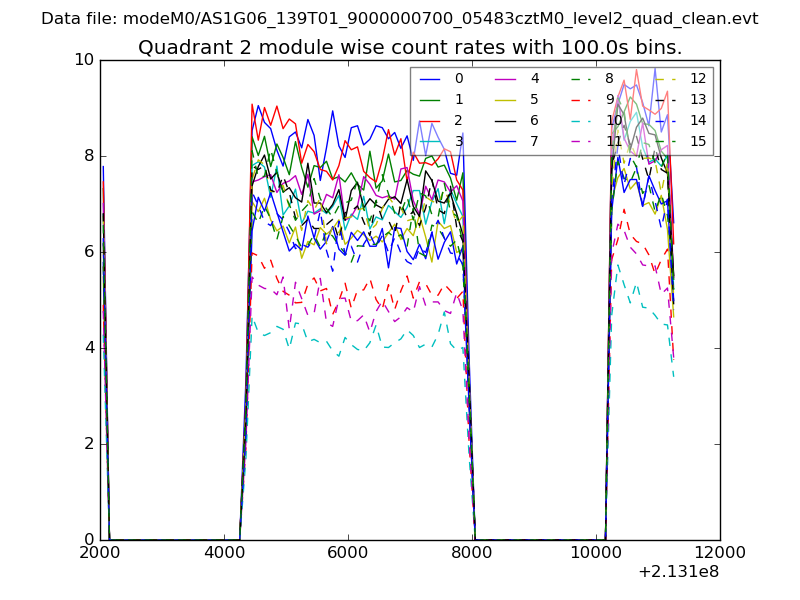
| Module-wise count rates for Quadrant A Data is divided into 100 sec bins |
 |
 |
| Module-wise count rates for Quadrant B Data is divided into 100 sec bins |
 |
 |
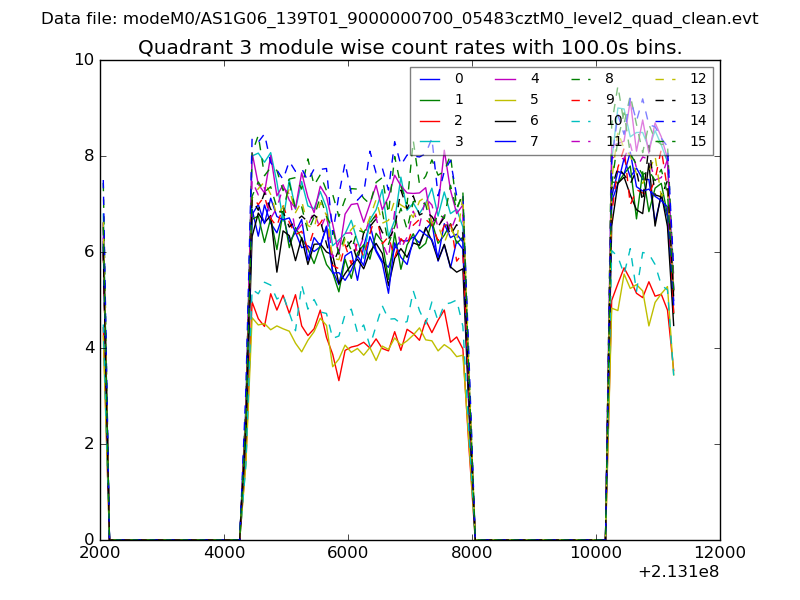
| Module-wise count rates for Quadrant C Data is divided into 100 sec bins |
 |
 |
| Module-wise count rates for Quadrant D Data is divided into 100 sec bins |
 |
 |
| Parameter | Plot |
|---|---|
| CZT HV Monitor |  |
| D_VDD |  |
| Temperature 1 | 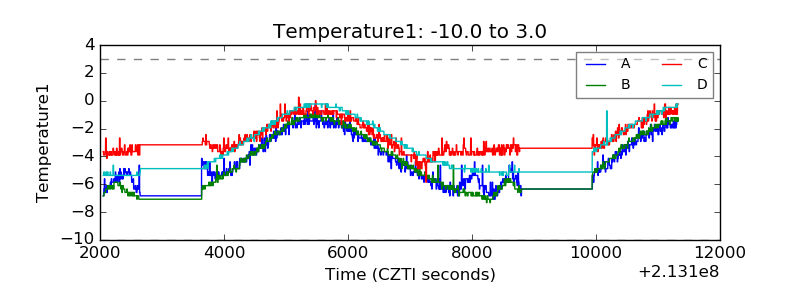 |
| Veto HV Monitor | 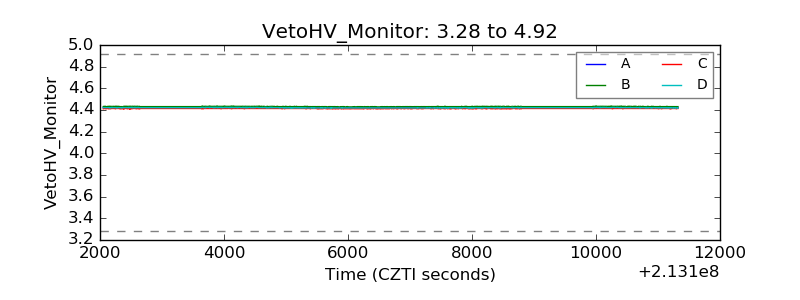 |
| Veto LLD | 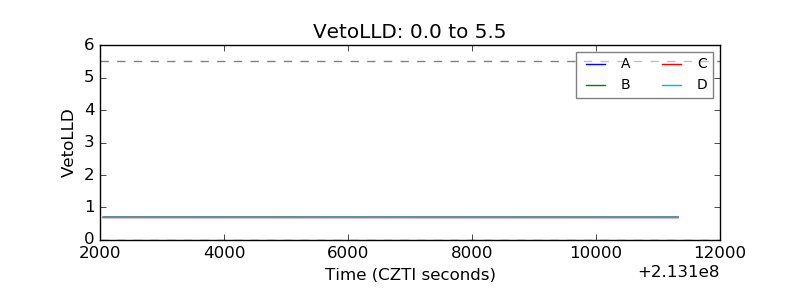 |
| Alpha Counter | 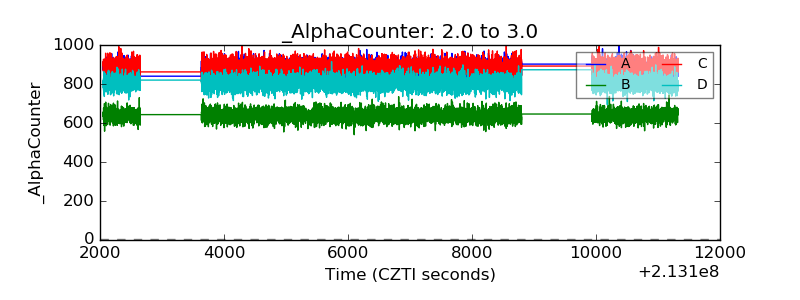 |
| _CPM_Rate | 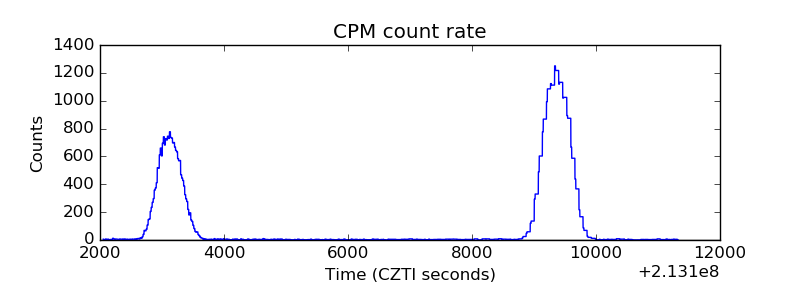 |
| CZT Counter | 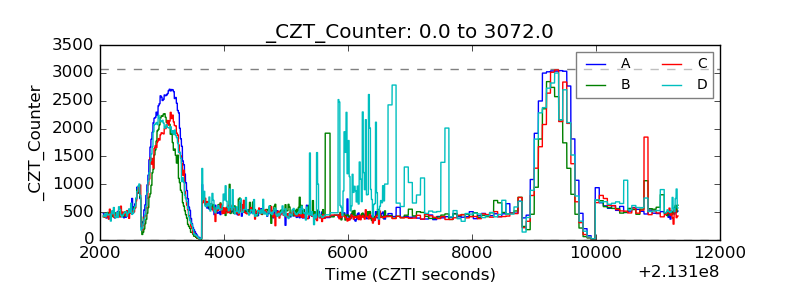 |
| +2.5 Volts monitor |  |
| +5 Volts monitor |  |
| _ROLL_ROT | 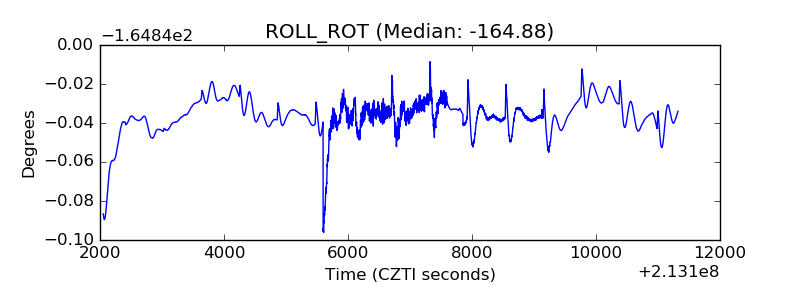 |
| _Roll_DEC | 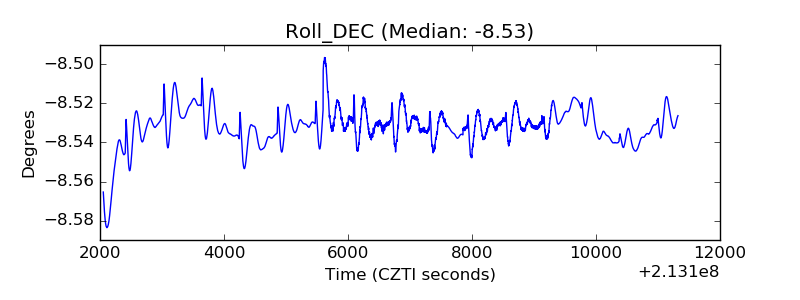 |
| _Roll_RA | 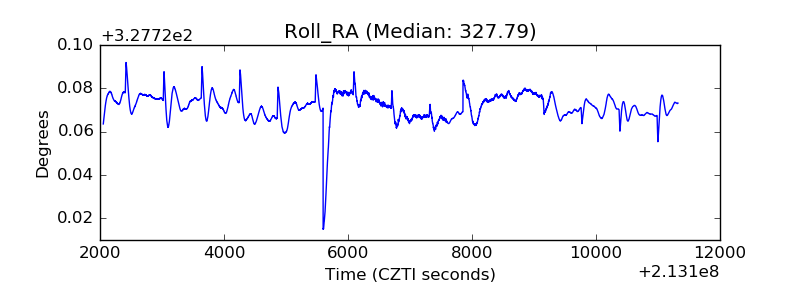 |
| Veto Counter | 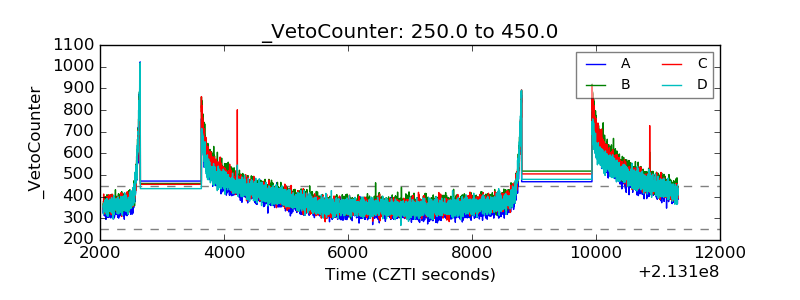 |