| Param | Original file | Final file |
|---|---|---|
| Filename | modeM0/AS1G06_139T01_9000000700_05484cztM0_level2.evt | modeM0/AS1G06_139T01_9000000700_05484cztM0_level2_quad_clean.evt |
| Size (bytes) | 540,696,960 | 88,329,600 |
| Size | 515.6 MB | 84.2 MB |
| Events in quadrant A | 3,381,775 | 554,588 |
| Events in quadrant B | 3,595,035 | 560,473 |
| Events in quadrant C | 3,606,708 | 558,671 |
| Events in quadrant D | 5,328,972 | 525,895 |
| Mode M9 | |||
|---|---|---|---|
| Quadrant | BADHDUFLAG | Total packets | Discarded packets |
| A | 0 | 23 | 0 |
| B | 0 | 23 | 0 |
| C | 0 | 23 | 0 |
| D | 0 | 23 | 0 |
| Mode SS | |||
|---|---|---|---|
| Quadrant | BADHDUFLAG | Total packets | Discarded packets |
| A | 0 | 140 | 0 |
| B | 0 | 140 | 0 |
| C | 0 | 140 | 0 |
| D | 0 | 140 | 2 |
| Mode M0 | |||
|---|---|---|---|
| Quadrant | BADHDUFLAG | Total packets | Discarded packets |
| A | 0 | 14598 | 11 |
| B | 0 | 15095 | 8 |
| C | 0 | 15277 | 6 |
| D | 0 | 20344 | 15 |
| Quadrant | Total seconds | Saturated seconds | Saturation percentage |
|---|---|---|---|
| A | 6822 | 142 | 2.081501% |
| B | 6823 | 143 | 2.095852% |
| C | 6824 | 139 | 2.036928% |
| D | 6821 | 470 | 6.890485% |
Noise dominated data is calculated using 1-second bins in cleaned event files. If a bin has >2000 counts, and if more than 50% of those come from <1% of pixels, then it is considered to be noise-dominated and hence unusable.
| Quadrant | # 1 sec bins | Bins with >0 counts | Bins with >2000 counts | High rate bins dominated by noise | Noise dominated (total time) | Noise dominated (detector-on time) | Marked lightcurve |
|---|---|---|---|---|---|---|---|
| A | 9166 | 6828 | 0 | 0 | 0.00% | 0.00% | 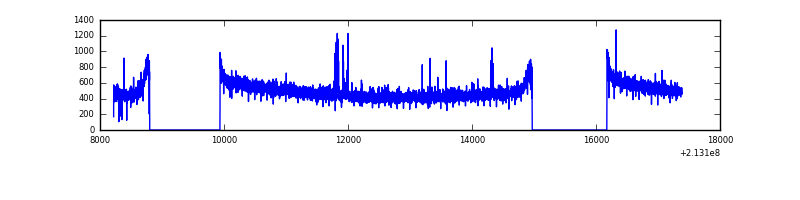 |
| B | 9166 | 6828 | 1 | 1 | 0.01% | 0.01% |  |
| C | 9166 | 6828 | 39 | 39 | 0.43% | 0.57% |  |
| D | 9166 | 6828 | 337 | 337 | 3.68% | 4.94% | 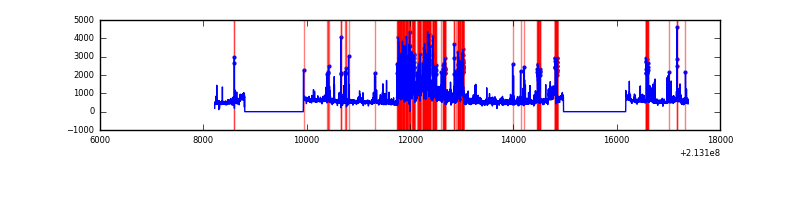 |
Top three noisy pixels from each quadrant. If the there are fewer than three noisy pixels in the level2.evt file, extra rows are filled as -1
| Pixel properties | Quadrant properties | ||||||
|---|---|---|---|---|---|---|---|
| Quadrant | DetID | PixID | Counts | Sigma | Mean | Median | Sigma |
| A | 0 | 50 | 27536 | 150.64 | 868 | 848 | 177.2 |
| A | 12 | 194 | 8558 | 43.52 | 868 | 848 | 177.2 |
| A | 0 | 226 | 8531 | 43.37 | 868 | 848 | 177.2 |
| B | 15 | 204 | 130111 | 774.83 | 868 | 848 | 166.8 |
| B | 11 | 51 | 33206 | 193.96 | 868 | 848 | 166.8 |
| B | 15 | 54 | 20338 | 116.83 | 868 | 848 | 166.8 |
| C | 1 | 241 | 229763 | 1190.57 | 831 | 835 | 192.3 |
| C | 9 | 247 | 87250 | 449.41 | 831 | 835 | 192.3 |
| C | 1 | 16 | 38254 | 194.6 | 831 | 835 | 192.3 |
| D | 2 | 152 | 1117928 | 5530.67 | 829 | 804 | 202.0 |
| D | 9 | 85 | 258449 | 1275.55 | 829 | 804 | 202.0 |
| D | 8 | 195 | 245653 | 1212.2 | 829 | 804 | 202.0 |
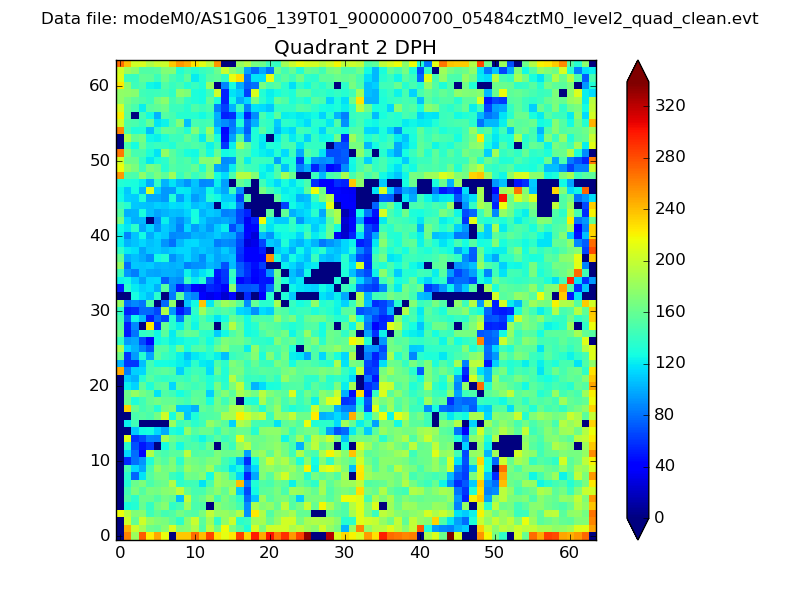
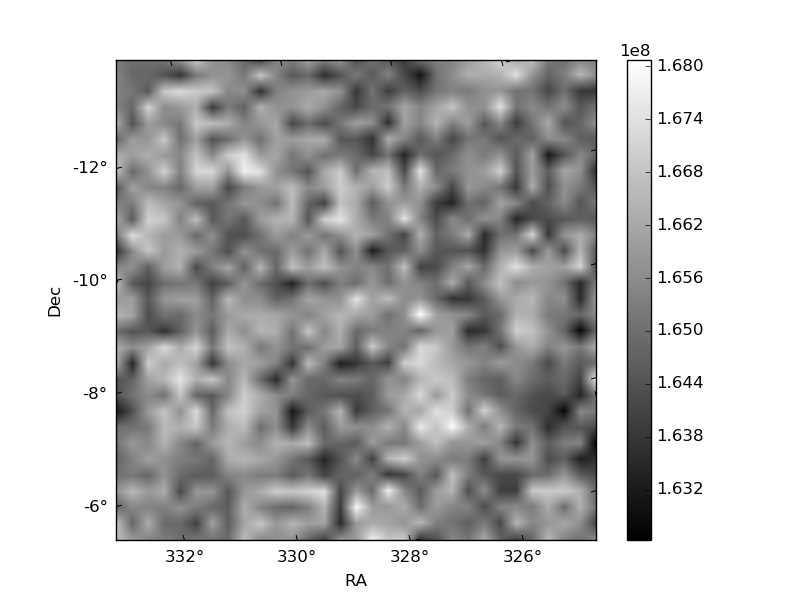
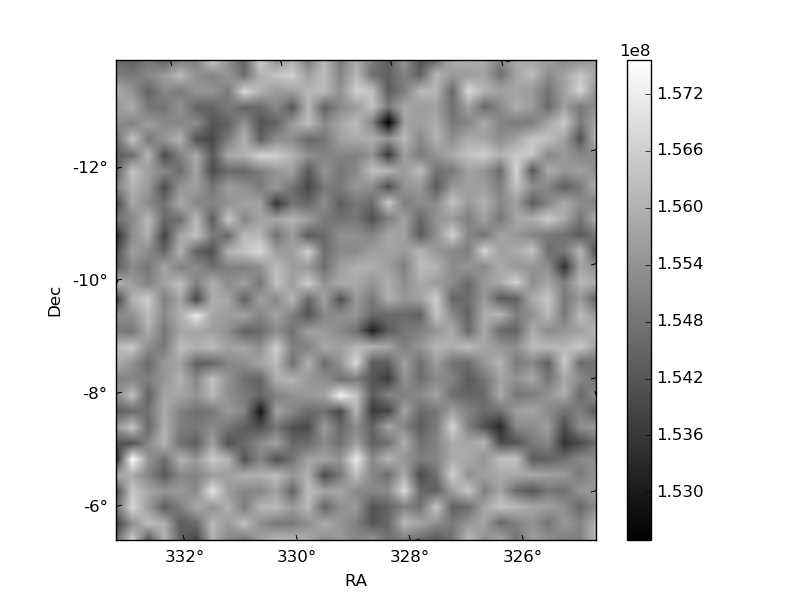
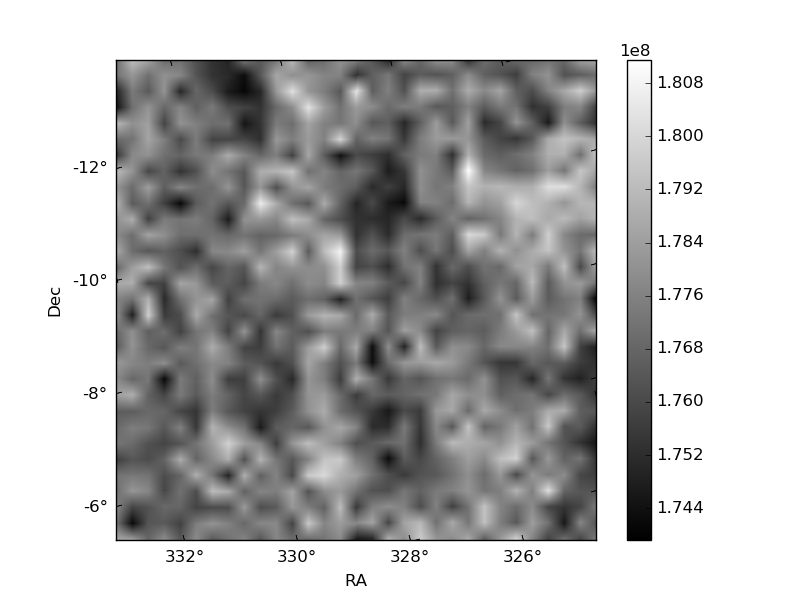
Histogram calculated using DETX and DETY for each event in the final _common_clean file
| Quadrant A | 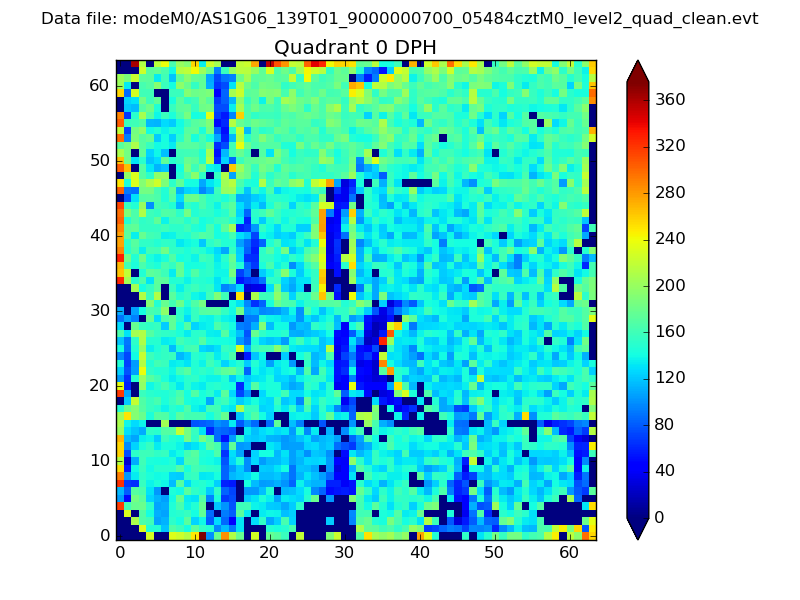 |
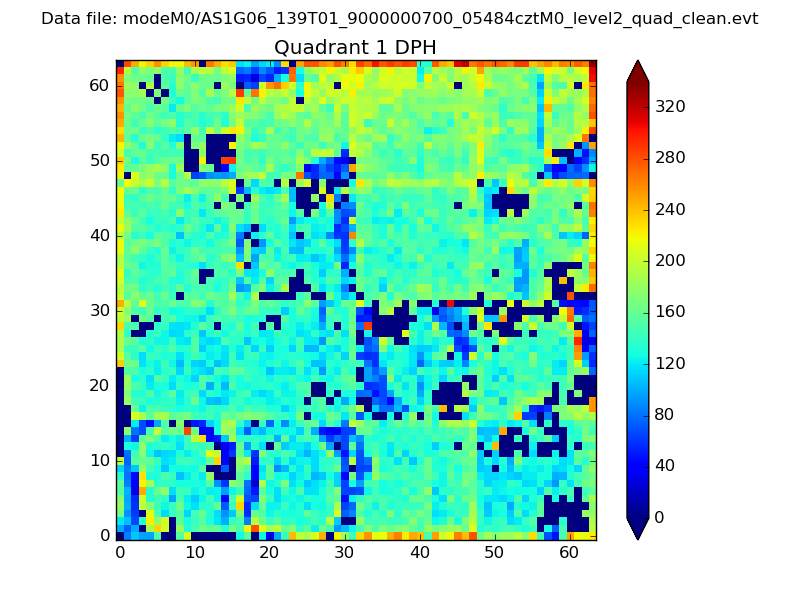 |
Quadrant B |
|---|---|---|---|
| Quadrant D | 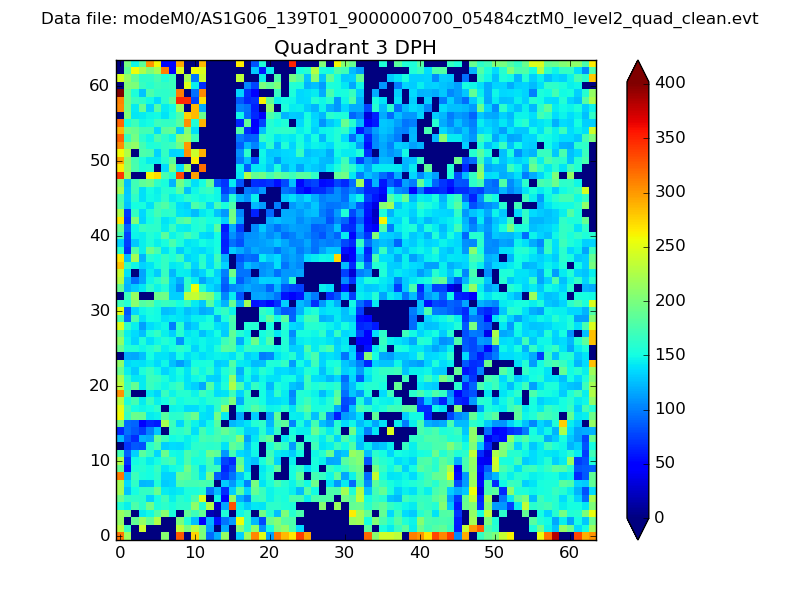 |
 |
Quadrant C |
| Plot type | Count rate plots | Images |
|---|---|---|
| Comparison with Poisson distribution Blue bars denote a histogram of data divided into 1 sec bins. Red curve is a Poisson curve with rate = median count rate of data. |
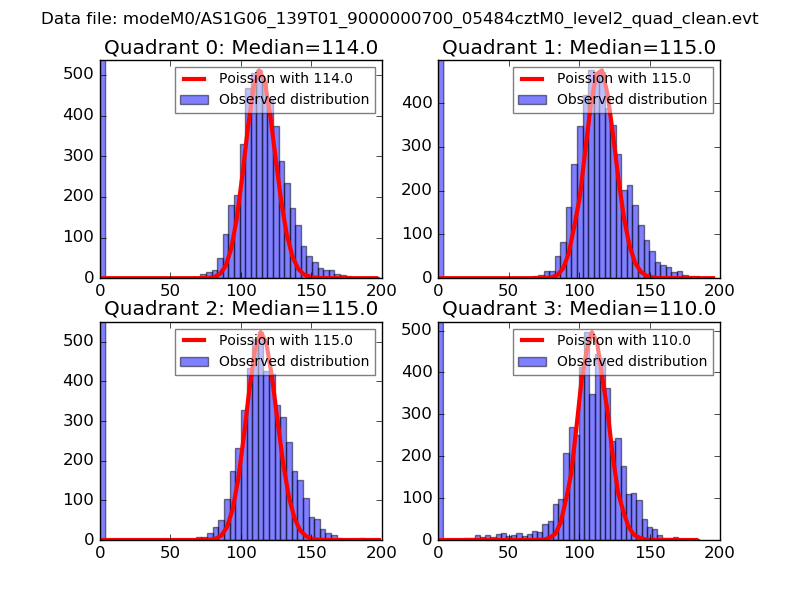 |
 |
| Quadrant-wise count rates Data is divided into 100 sec bins |
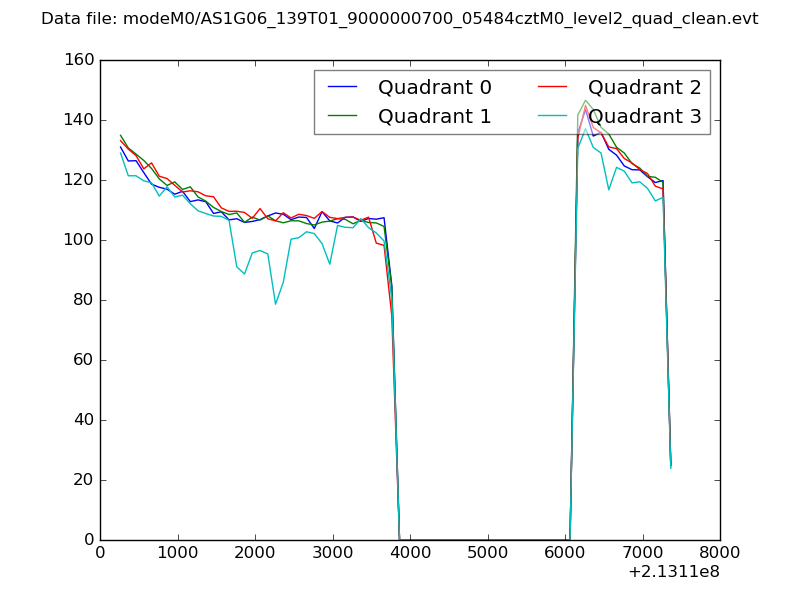 |
|
| Module-wise count rates for Quadrant A Data is divided into 100 sec bins |
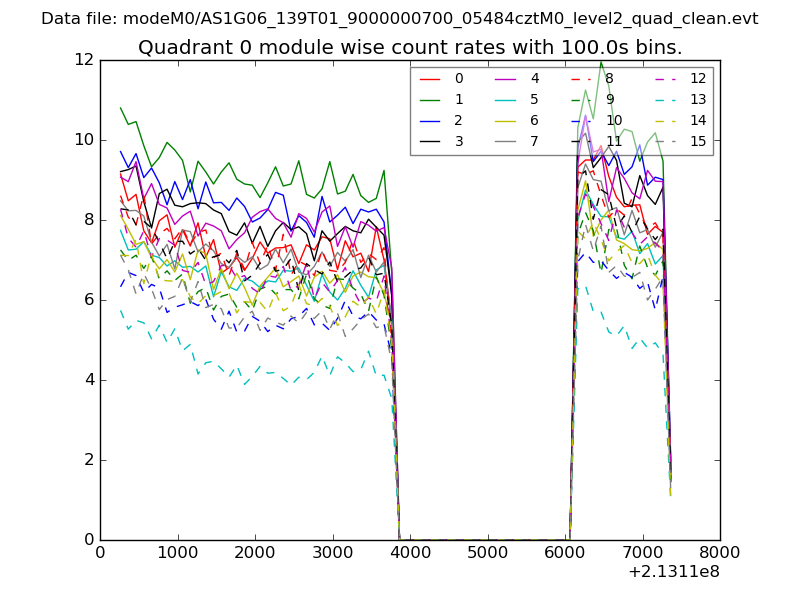 |
 |
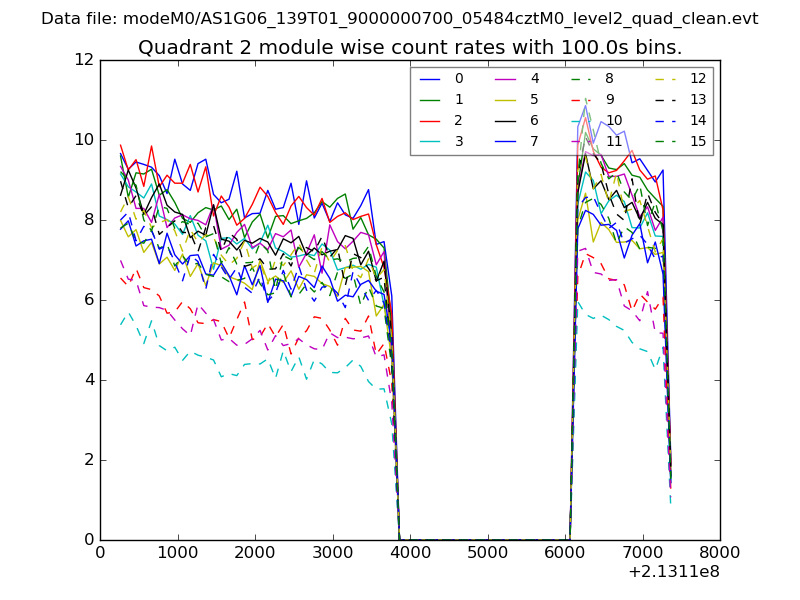
| Module-wise count rates for Quadrant B Data is divided into 100 sec bins |
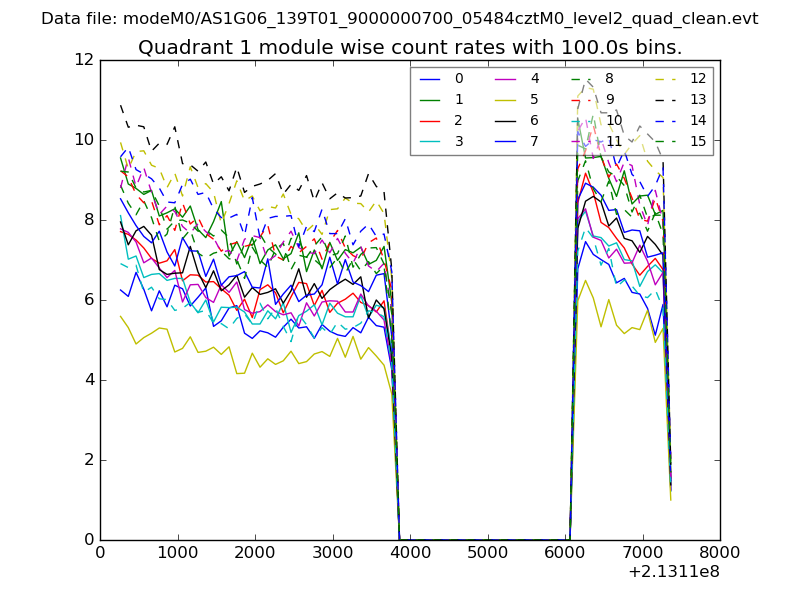 |
 |
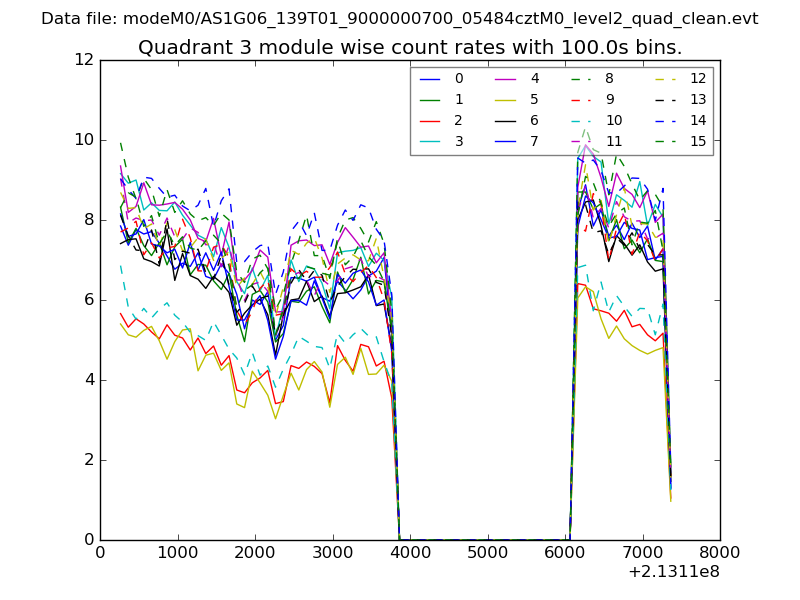
| Module-wise count rates for Quadrant C Data is divided into 100 sec bins |
 |
 |
| Module-wise count rates for Quadrant D Data is divided into 100 sec bins |
 |
 |
| Parameter | Plot |
|---|---|
| CZT HV Monitor | 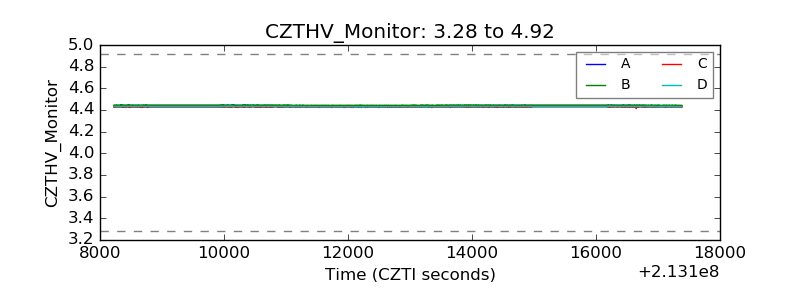 |
| D_VDD | 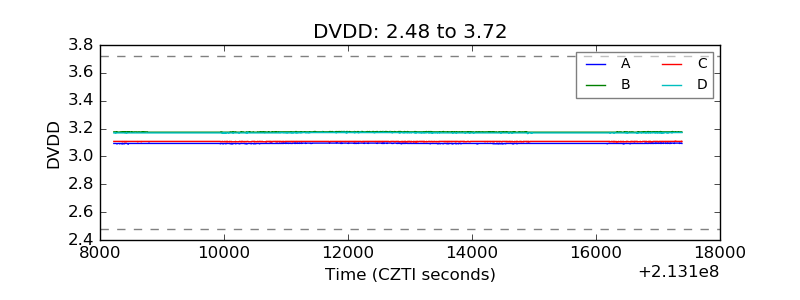 |
| Temperature 1 | 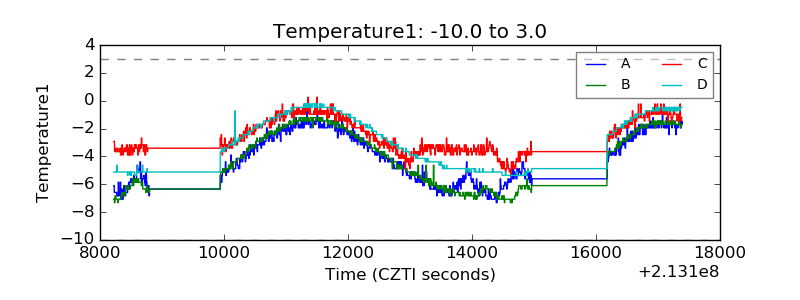 |
| Veto HV Monitor | 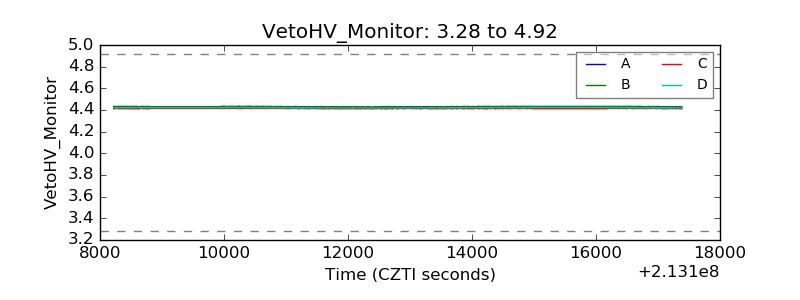 |
| Veto LLD | 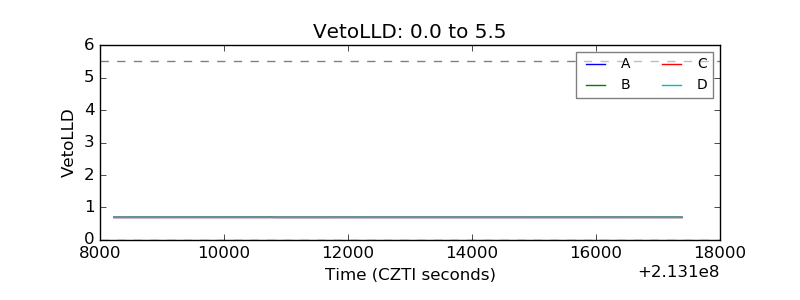 |
| Alpha Counter | 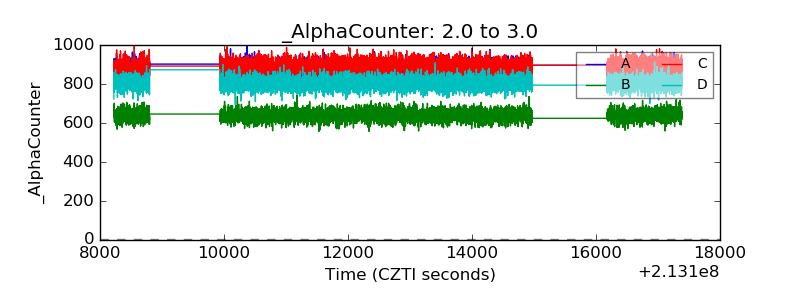 |
| _CPM_Rate | 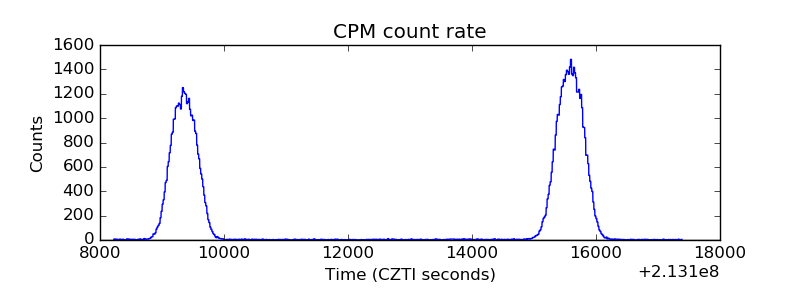 |
| CZT Counter | 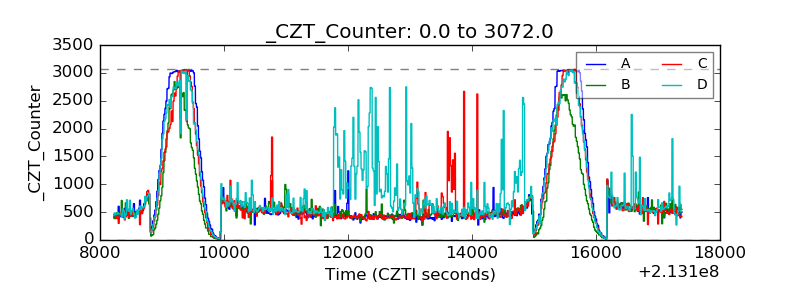 |
| +2.5 Volts monitor |  |
| +5 Volts monitor |  |
| _ROLL_ROT | 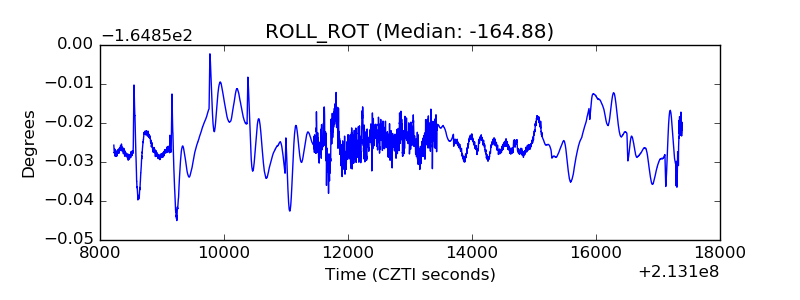 |
| _Roll_DEC | 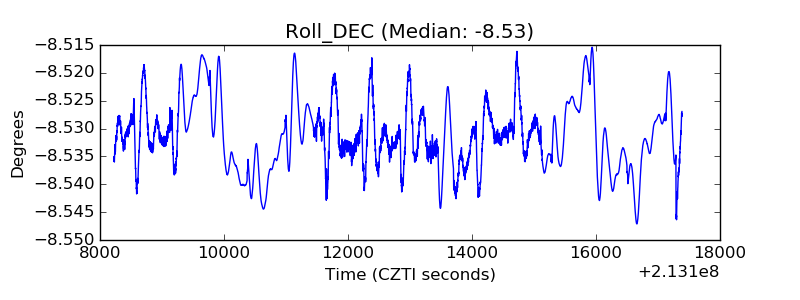 |
| _Roll_RA | 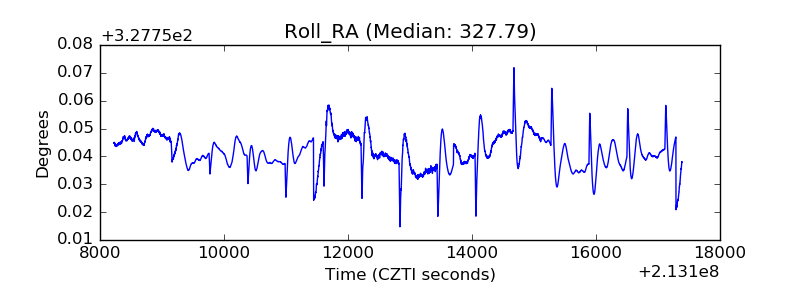 |
| Veto Counter | 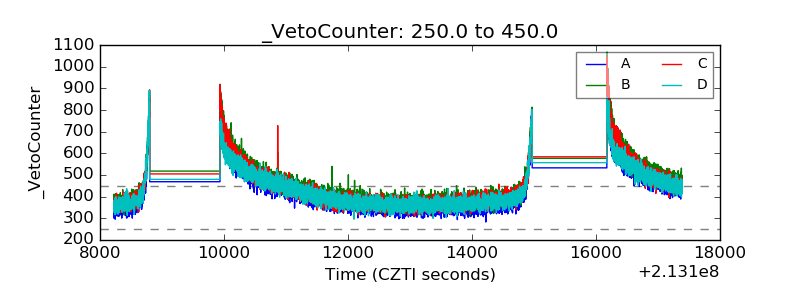 |