| Param | Original file | Final file |
|---|---|---|
| Filename | modeM0/AS1G06_139T01_9000000700_05486cztM0_level2.evt | modeM0/AS1G06_139T01_9000000700_05486cztM0_level2_quad_clean.evt |
| Size (bytes) | 517,924,800 | 79,943,040 |
| Size | 493.9 MB | 76.2 MB |
| Events in quadrant A | 3,010,202 | 508,322 |
| Events in quadrant B | 3,461,265 | 509,716 |
| Events in quadrant C | 4,141,356 | 477,219 |
| Events in quadrant D | 4,643,353 | 483,774 |
| Mode M9 | |||
|---|---|---|---|
| Quadrant | BADHDUFLAG | Total packets | Discarded packets |
| A | 0 | 12 | 0 |
| B | 0 | 12 | 0 |
| C | 0 | 12 | 0 |
| D | 0 | 12 | 0 |
| Mode SS | |||
|---|---|---|---|
| Quadrant | BADHDUFLAG | Total packets | Discarded packets |
| A | 0 | 128 | 0 |
| B | 0 | 128 | 0 |
| C | 0 | 128 | 0 |
| D | 0 | 128 | 0 |
| Mode M0 | |||
|---|---|---|---|
| Quadrant | BADHDUFLAG | Total packets | Discarded packets |
| A | 0 | 13177 | 2 |
| B | 0 | 14466 | 1 |
| C | 0 | 16595 | 1 |
| D | 0 | 18065 | 1 |
| Quadrant | Total seconds | Saturated seconds | Saturation percentage |
|---|---|---|---|
| A | 6327 | 85 | 1.343449% |
| B | 6327 | 90 | 1.422475% |
| C | 6327 | 521 | 8.234550% |
| D | 6327 | 241 | 3.809072% |
Noise dominated data is calculated using 1-second bins in cleaned event files. If a bin has >2000 counts, and if more than 50% of those come from <1% of pixels, then it is considered to be noise-dominated and hence unusable.
| Quadrant | # 1 sec bins | Bins with >0 counts | Bins with >2000 counts | High rate bins dominated by noise | Noise dominated (total time) | Noise dominated (detector-on time) | Marked lightcurve |
|---|---|---|---|---|---|---|---|
| A | 7577 | 6328 | 0 | 0 | 0.00% | 0.00% | 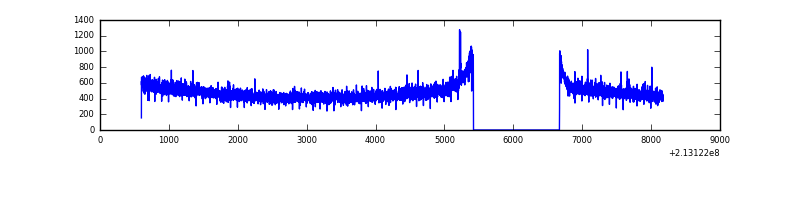 |
| B | 7577 | 6328 | 6 | 6 | 0.08% | 0.09% | 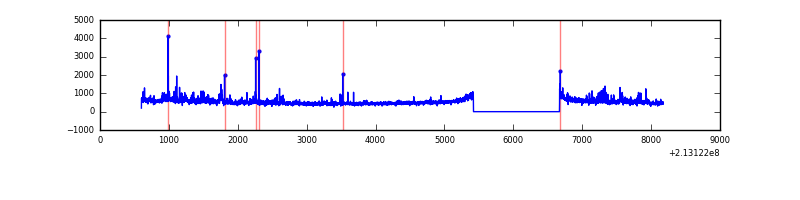 |
| C | 7577 | 6328 | 366 | 366 | 4.83% | 5.78% | 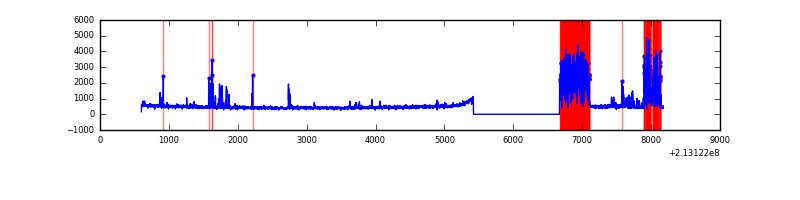 |
| D | 7577 | 6328 | 207 | 207 | 2.73% | 3.27% |  |
Top three noisy pixels from each quadrant. If the there are fewer than three noisy pixels in the level2.evt file, extra rows are filled as -1
| Pixel properties | Quadrant properties | ||||||
|---|---|---|---|---|---|---|---|
| Quadrant | DetID | PixID | Counts | Sigma | Mean | Median | Sigma |
| A | 14 | 218 | 8652 | 50.03 | 775 | 760 | 157.7 |
| A | 0 | 226 | 8023 | 46.04 | 775 | 760 | 157.7 |
| A | 12 | 194 | 7769 | 44.43 | 775 | 760 | 157.7 |
| B | 15 | 204 | 267671 | 1791.24 | 779 | 761 | 149.0 |
| B | 11 | 51 | 91596 | 609.6 | 779 | 761 | 149.0 |
| B | 4 | 81 | 29761 | 194.62 | 779 | 761 | 149.0 |
| C | 9 | 247 | 1338233 | 8059.39 | 714 | 718 | 166.0 |
| C | 1 | 16 | 12818 | 72.91 | 714 | 718 | 166.0 |
| C | 13 | 61 | 5742 | 30.27 | 714 | 718 | 166.0 |
| D | 9 | 85 | 811614 | 4365.9 | 745 | 722 | 185.7 |
| D | 2 | 152 | 780336 | 4197.49 | 745 | 722 | 185.7 |
| D | 8 | 195 | 62094 | 330.43 | 745 | 722 | 185.7 |
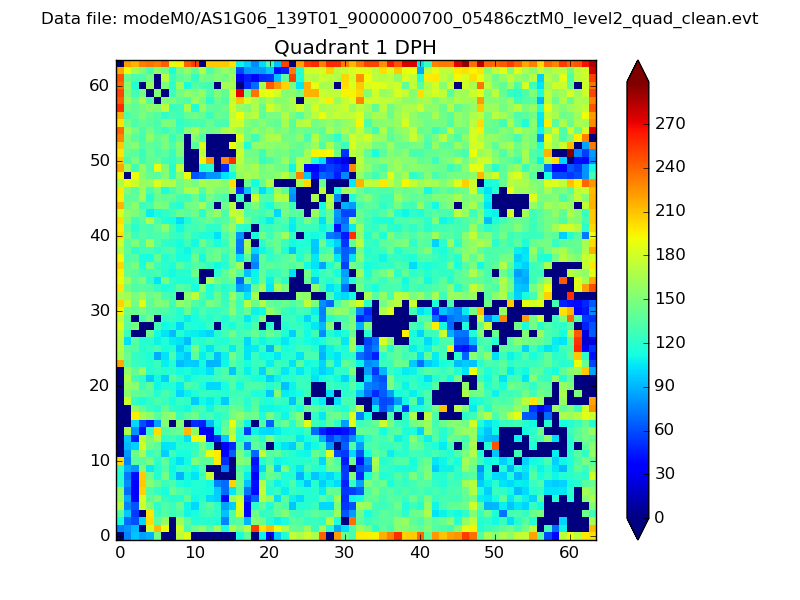
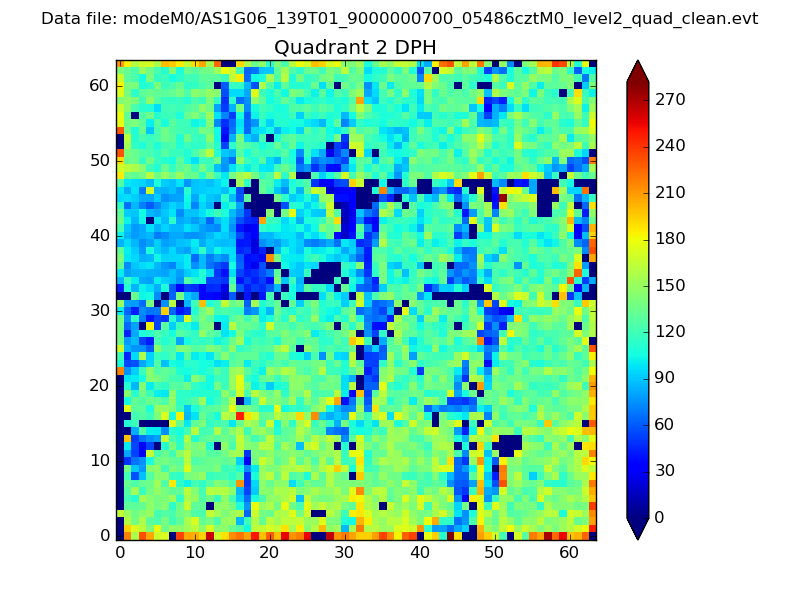
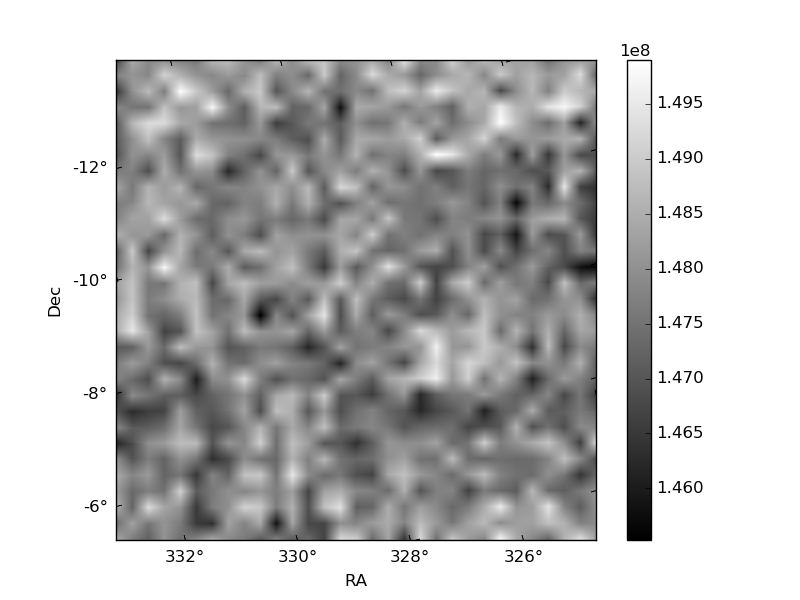
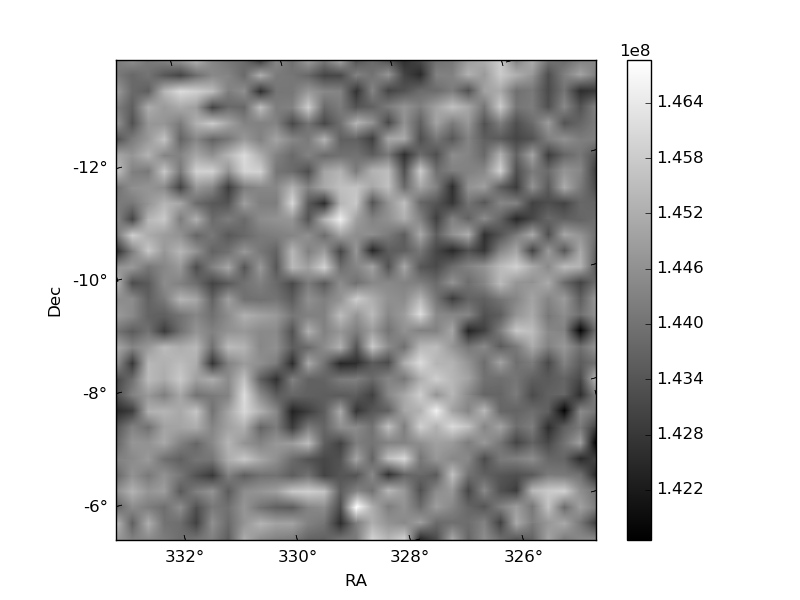
Histogram calculated using DETX and DETY for each event in the final _common_clean file
| Quadrant A | 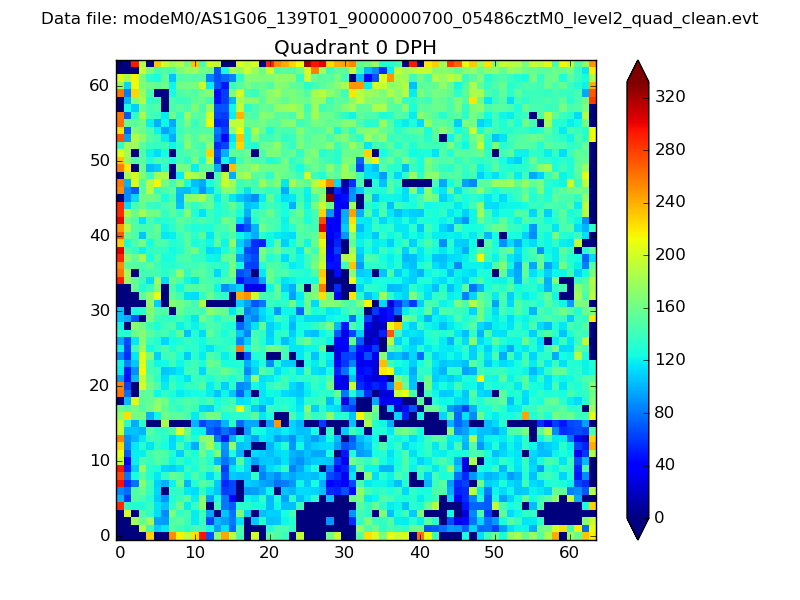 |
 |
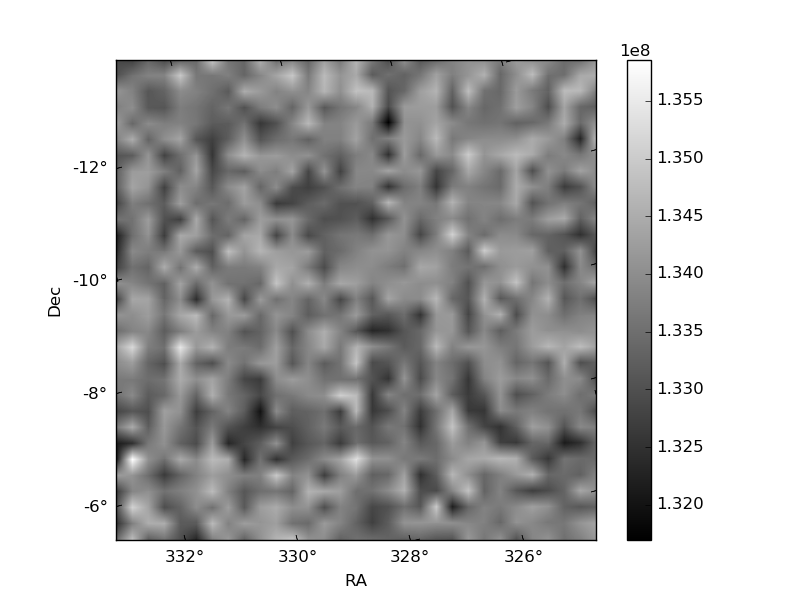
Quadrant B |
|---|---|---|---|
| Quadrant D | 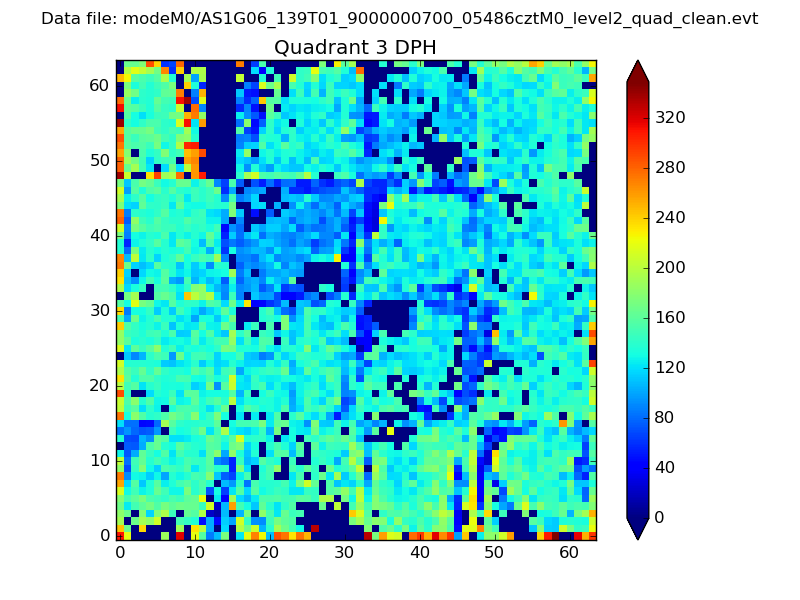 |
 |
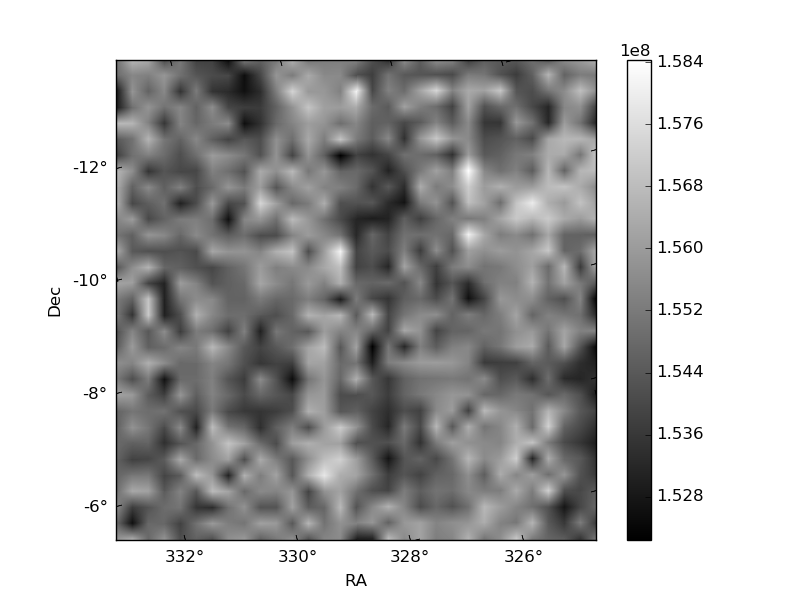
Quadrant C |
| Plot type | Count rate plots | Images |
|---|---|---|
| Comparison with Poisson distribution Blue bars denote a histogram of data divided into 1 sec bins. Red curve is a Poisson curve with rate = median count rate of data. |
 |
 |
| Quadrant-wise count rates Data is divided into 100 sec bins |
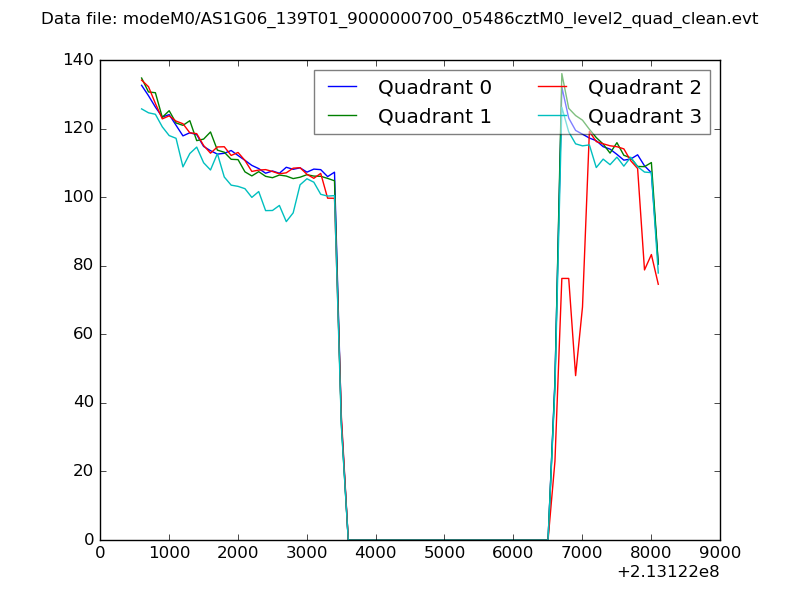 |
|
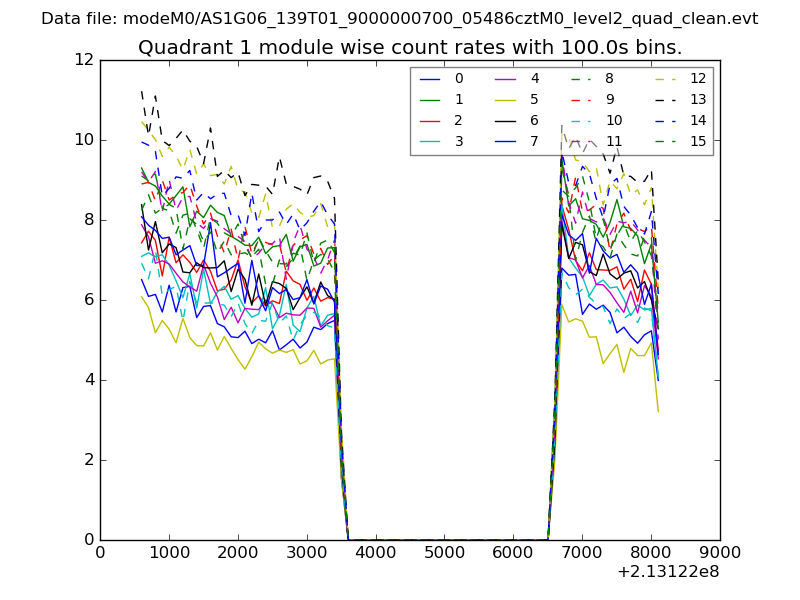
| Module-wise count rates for Quadrant A Data is divided into 100 sec bins |
 |
 |
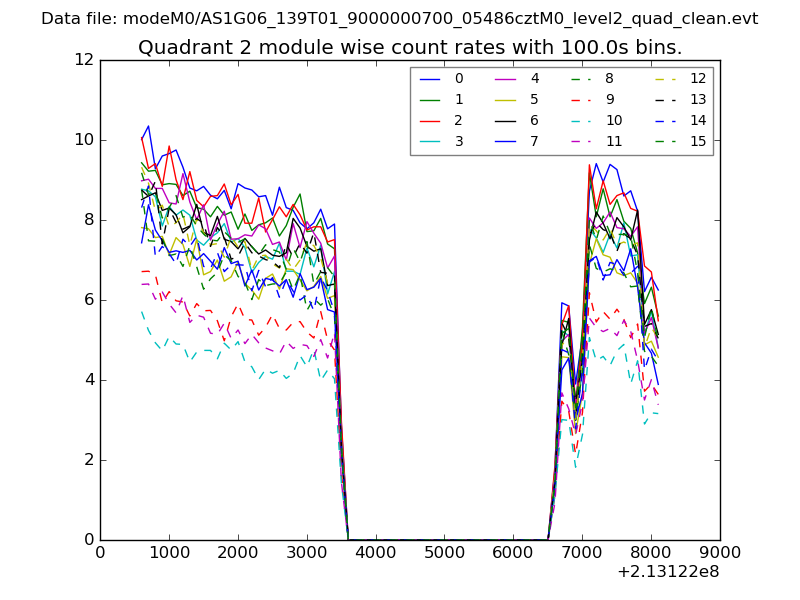
| Module-wise count rates for Quadrant B Data is divided into 100 sec bins |
 |
 |
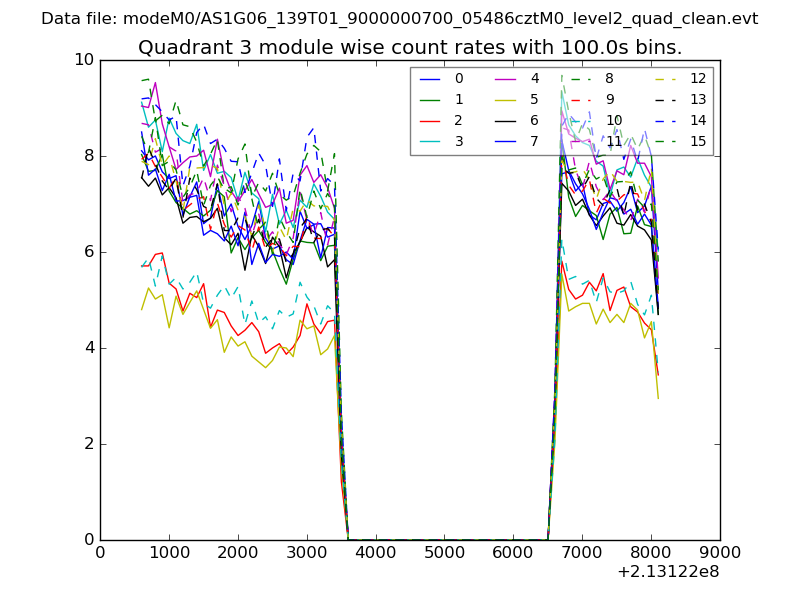
| Module-wise count rates for Quadrant C Data is divided into 100 sec bins |
 |
 |
| Module-wise count rates for Quadrant D Data is divided into 100 sec bins |
 |
 |
| Parameter | Plot |
|---|---|
| CZT HV Monitor | 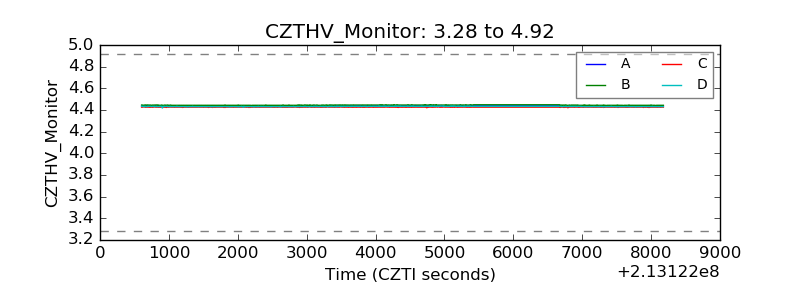 |
| D_VDD | 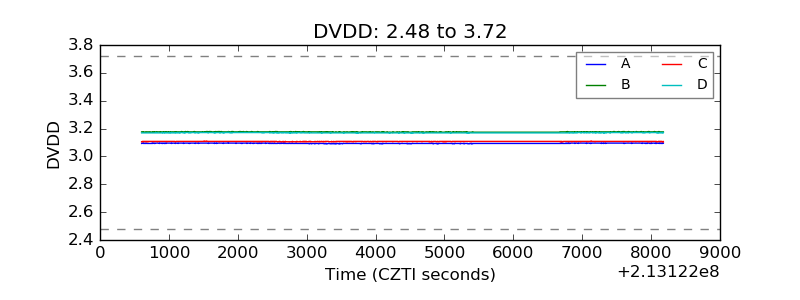 |
| Temperature 1 | 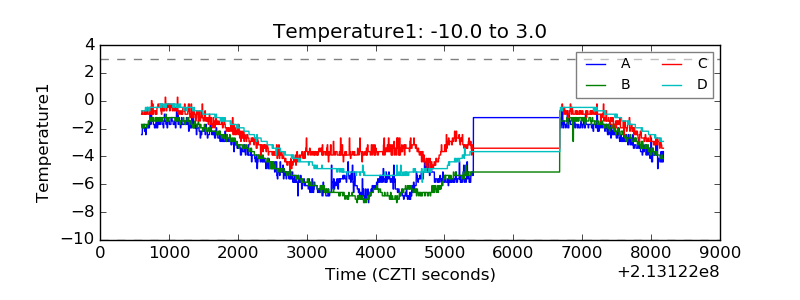 |
| Veto HV Monitor | 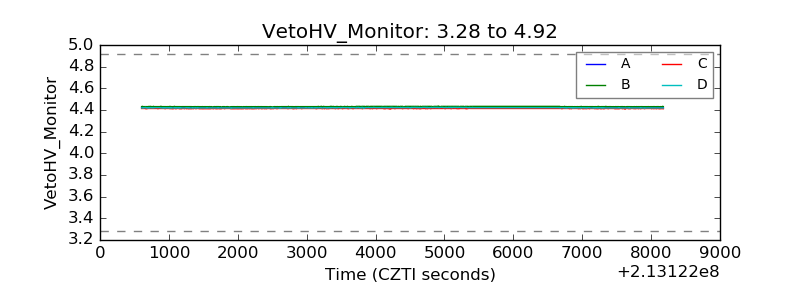 |
| Veto LLD | 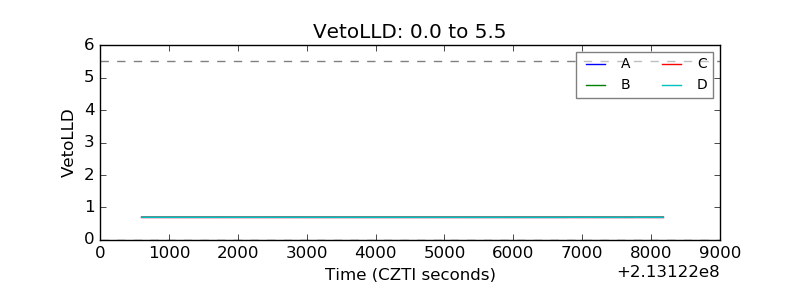 |
| Alpha Counter | 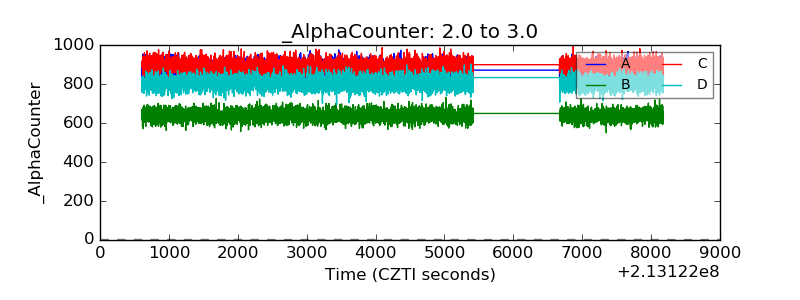 |
| _CPM_Rate | 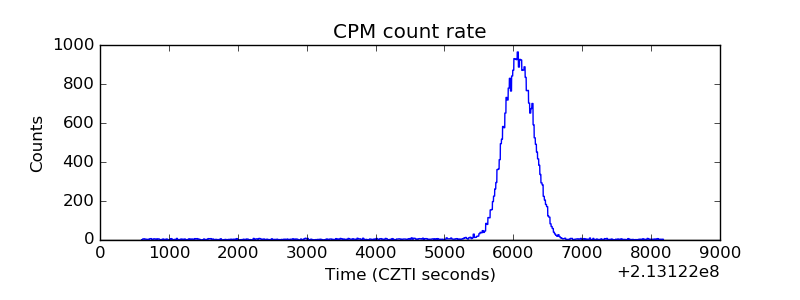 |
| CZT Counter | 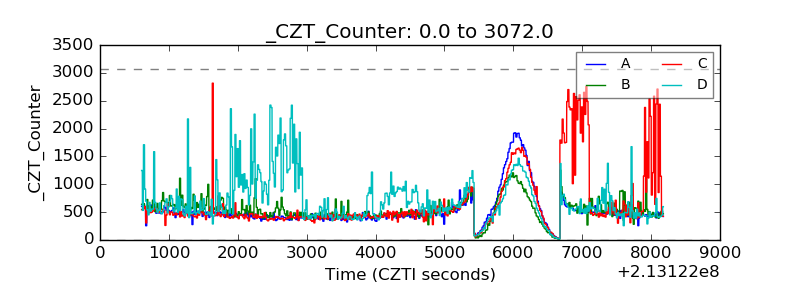 |
| +2.5 Volts monitor |  |
| +5 Volts monitor | 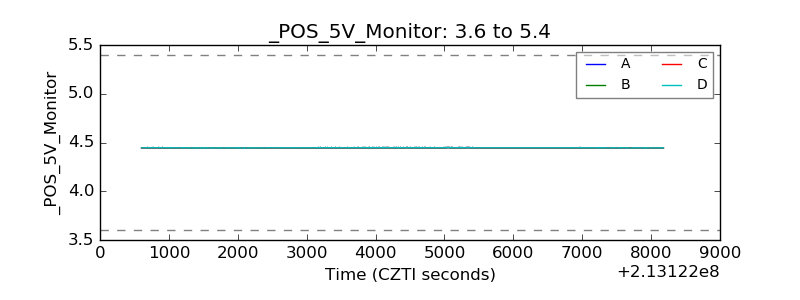 |
| _ROLL_ROT | 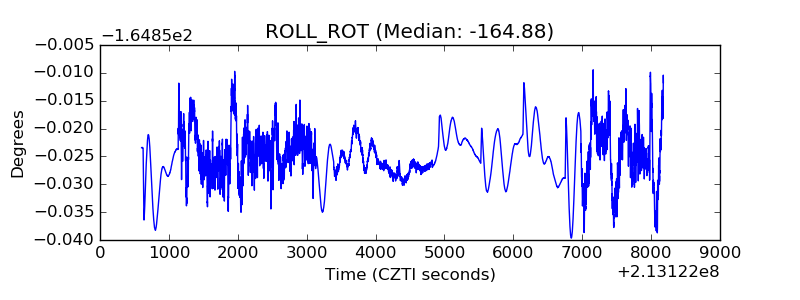 |
| _Roll_DEC | 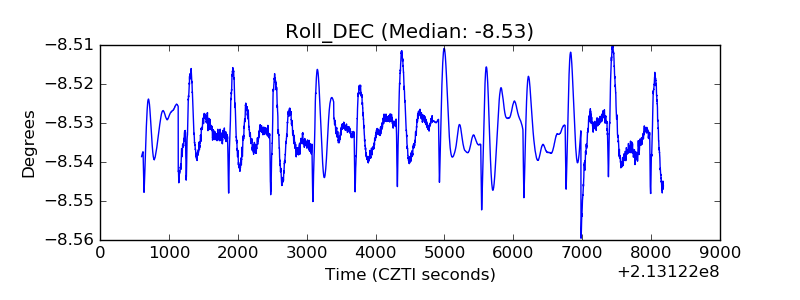 |
| _Roll_RA | 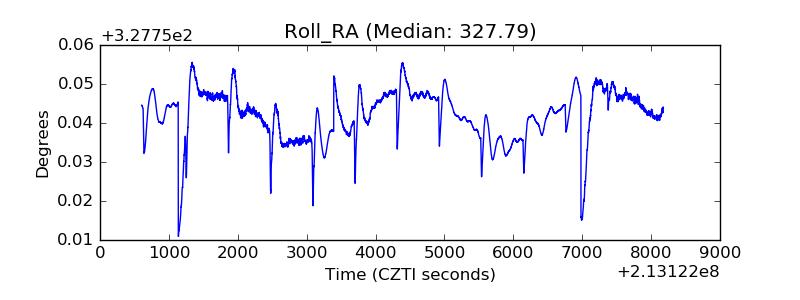 |
| Veto Counter | 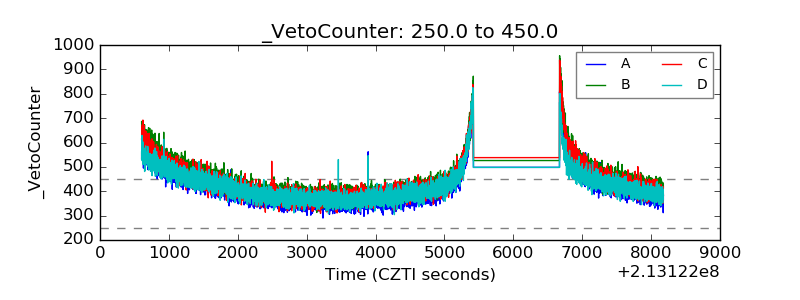 |