| Param | Original file | Final file |
|---|---|---|
| Filename | modeM0/AS1G06_139T01_9000000700_05487cztM0_level2.evt | modeM0/AS1G06_139T01_9000000700_05487cztM0_level2_quad_clean.evt |
| Size (bytes) | 499,409,280 | 77,569,920 |
| Size | 476.3 MB | 74.0 MB |
| Events in quadrant A | 3,108,625 | 482,167 |
| Events in quadrant B | 3,572,795 | 482,876 |
| Events in quadrant C | 4,635,693 | 451,461 |
| Events in quadrant D | 3,356,444 | 469,144 |
| Mode M9 | |||
|---|---|---|---|
| Quadrant | BADHDUFLAG | Total packets | Discarded packets |
| A | 0 | 12 | 0 |
| B | 0 | 12 | 0 |
| C | 0 | 12 | 0 |
| D | 0 | 13 | 0 |
| Mode SS | |||
|---|---|---|---|
| Quadrant | BADHDUFLAG | Total packets | Discarded packets |
| A | 0 | 134 | 0 |
| B | 0 | 134 | 0 |
| C | 0 | 134 | 0 |
| D | 0 | 134 | 0 |
| Mode M0 | |||
|---|---|---|---|
| Quadrant | BADHDUFLAG | Total packets | Discarded packets |
| A | 0 | 13905 | 3 |
| B | 0 | 15061 | 2 |
| C | 0 | 18429 | 2 |
| D | 0 | 14697 | 2 |
| Quadrant | Total seconds | Saturated seconds | Saturation percentage |
|---|---|---|---|
| A | 6644 | 63 | 0.948224% |
| B | 6644 | 102 | 1.535220% |
| C | 6644 | 590 | 8.880193% |
| D | 6644 | 67 | 1.008429% |
Noise dominated data is calculated using 1-second bins in cleaned event files. If a bin has >2000 counts, and if more than 50% of those come from <1% of pixels, then it is considered to be noise-dominated and hence unusable.
| Quadrant | # 1 sec bins | Bins with >0 counts | Bins with >2000 counts | High rate bins dominated by noise | Noise dominated (total time) | Noise dominated (detector-on time) | Marked lightcurve |
|---|---|---|---|---|---|---|---|
| A | 7774 | 6645 | 0 | 0 | 0.00% | 0.00% | 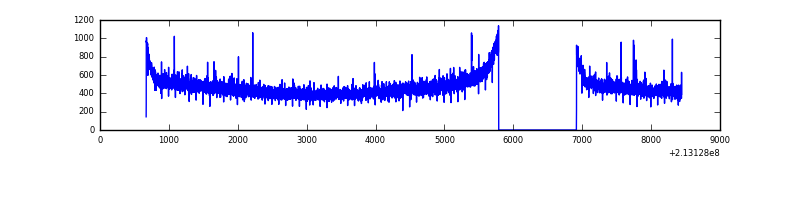 |
| B | 7774 | 6645 | 24 | 24 | 0.31% | 0.36% | 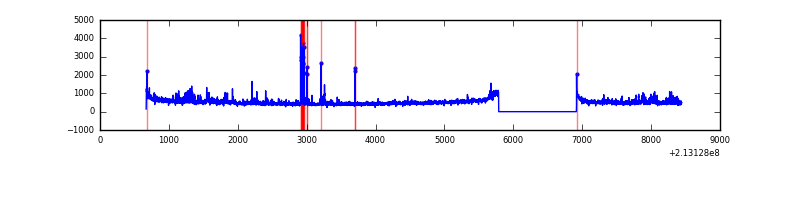 |
| C | 7774 | 6645 | 447 | 447 | 5.75% | 6.73% | 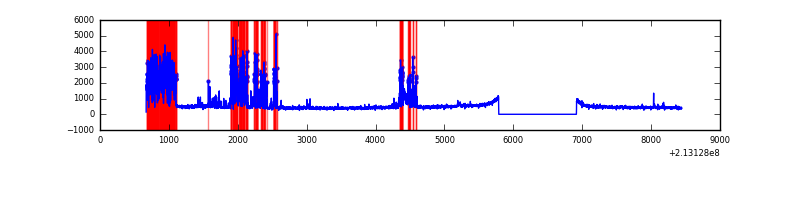 |
| D | 7774 | 6645 | 27 | 27 | 0.35% | 0.41% | 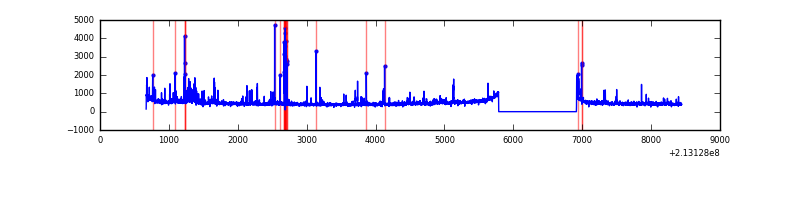 |
Top three noisy pixels from each quadrant. If the there are fewer than three noisy pixels in the level2.evt file, extra rows are filled as -1
| Pixel properties | Quadrant properties | ||||||
|---|---|---|---|---|---|---|---|
| Quadrant | DetID | PixID | Counts | Sigma | Mean | Median | Sigma |
| A | 13 | 251 | 18727 | 108.92 | 800 | 783 | 164.7 |
| A | 12 | 194 | 8127 | 44.58 | 800 | 783 | 164.7 |
| A | 0 | 226 | 8030 | 43.99 | 800 | 783 | 164.7 |
| B | 15 | 204 | 234331 | 1512.63 | 805 | 786 | 154.4 |
| B | 7 | 252 | 92915 | 596.7 | 805 | 786 | 154.4 |
| B | 11 | 51 | 50790 | 323.87 | 805 | 786 | 154.4 |
| C | 9 | 247 | 1725573 | 10047.9 | 738 | 744 | 171.7 |
| C | 1 | 16 | 23016 | 129.74 | 738 | 744 | 171.7 |
| C | 10 | 21 | 6410 | 33.01 | 738 | 744 | 171.7 |
| D | 2 | 152 | 124781 | 649.52 | 771 | 745 | 191.0 |
| D | 9 | 85 | 92430 | 480.11 | 771 | 745 | 191.0 |
| D | 11 | 192 | 47493 | 244.8 | 771 | 745 | 191.0 |
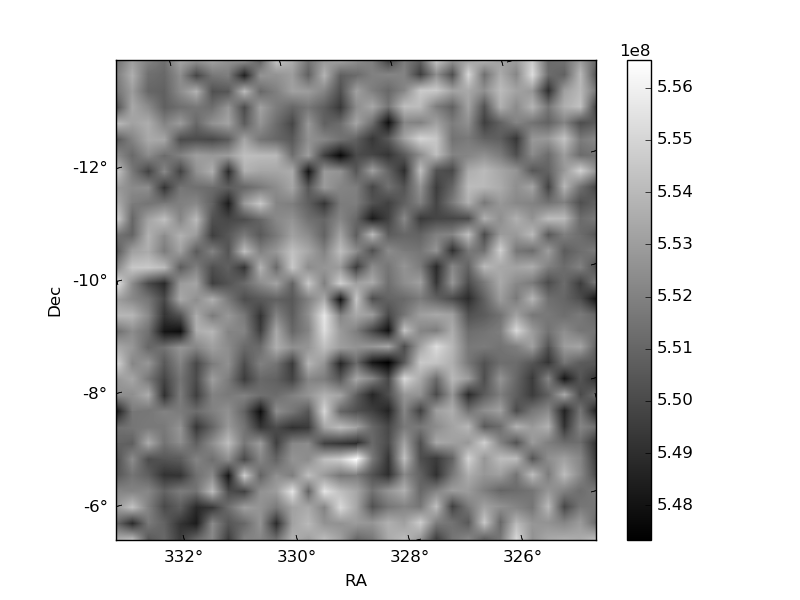
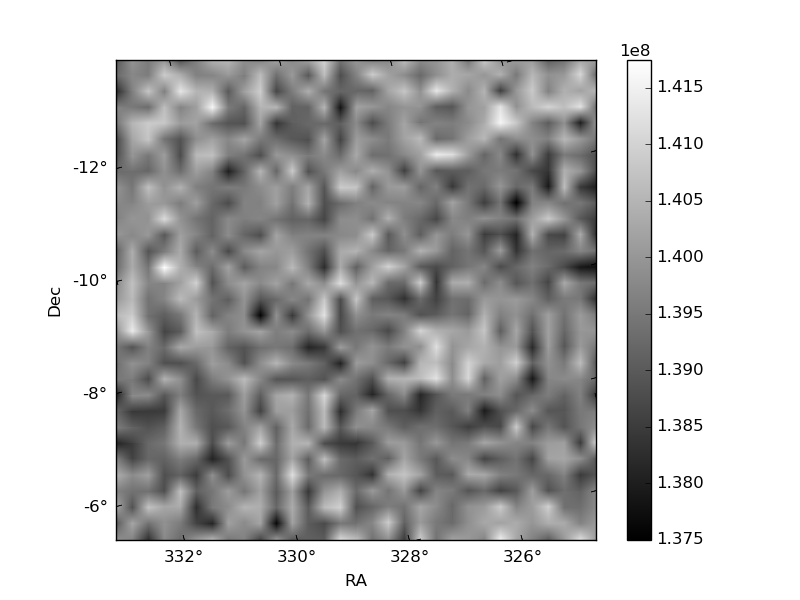
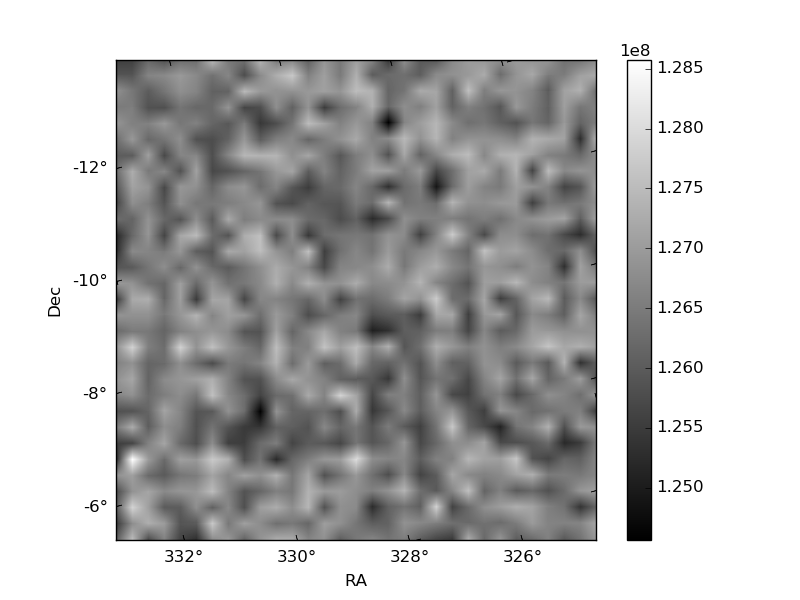
Histogram calculated using DETX and DETY for each event in the final _common_clean file
| Quadrant A | 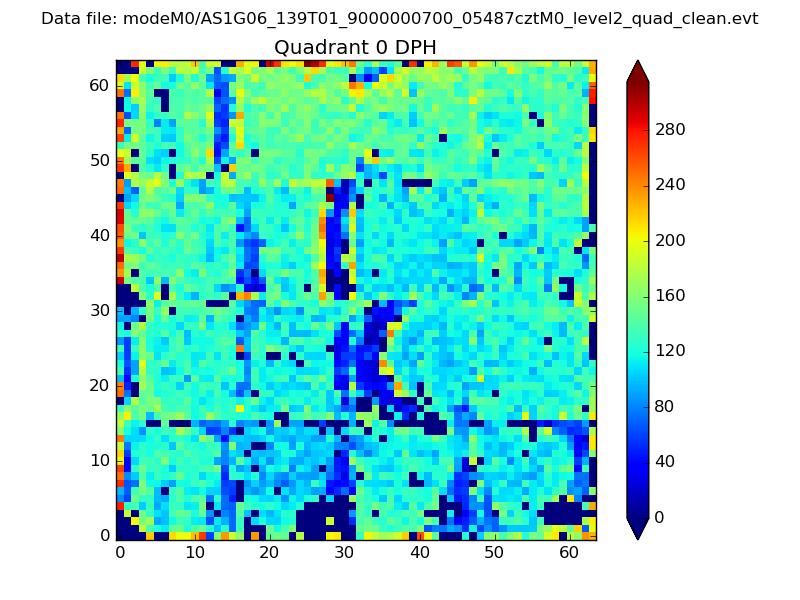 |
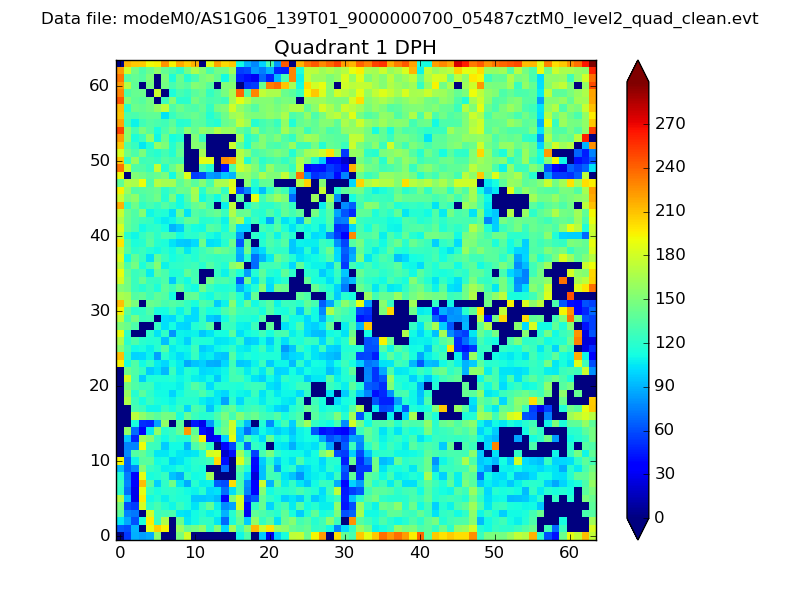 |
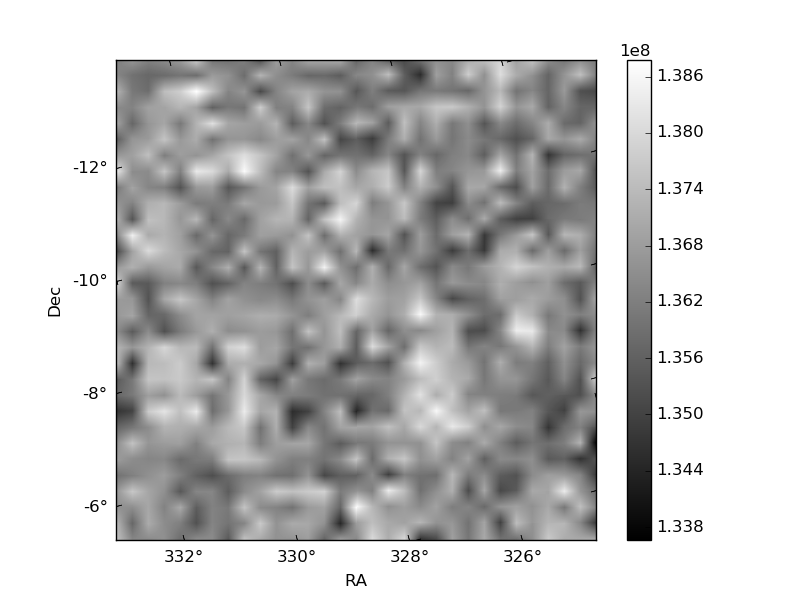
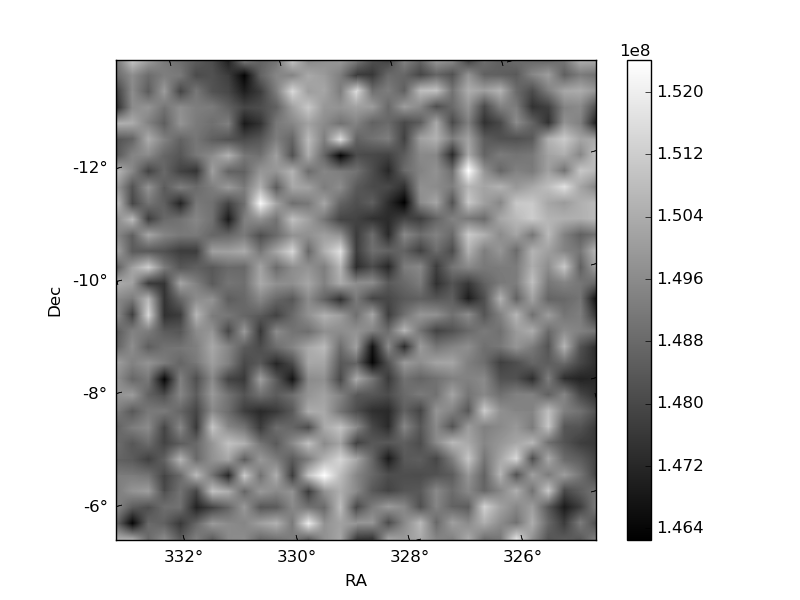
Quadrant B |
|---|---|---|---|
| Quadrant D | 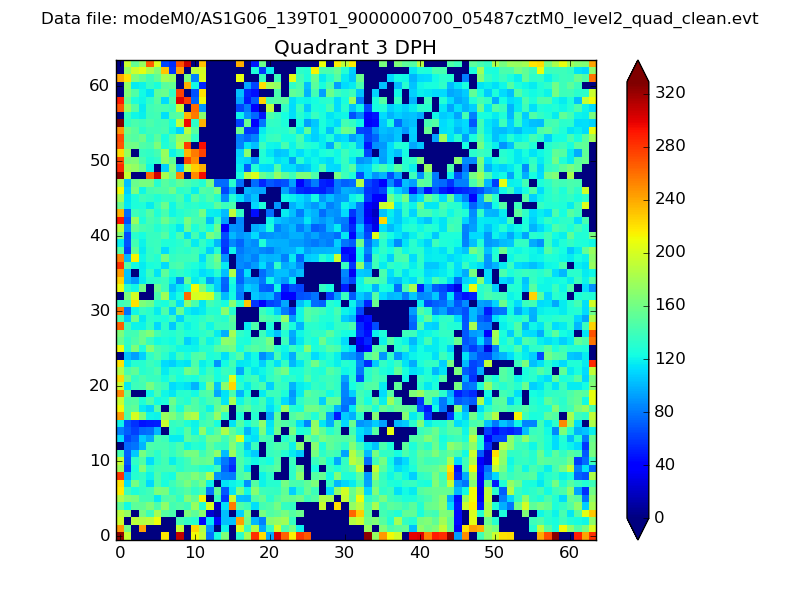 |
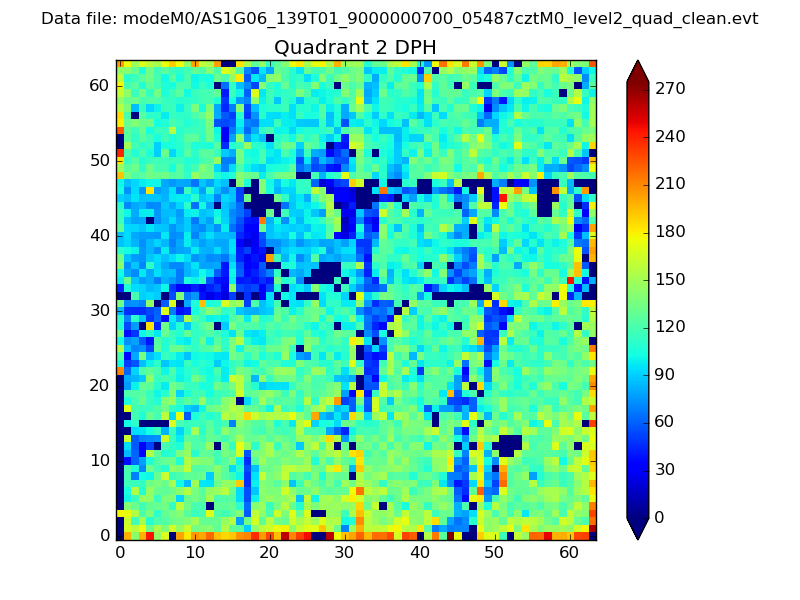 |
Quadrant C |
| Plot type | Count rate plots | Images |
|---|---|---|
| Comparison with Poisson distribution Blue bars denote a histogram of data divided into 1 sec bins. Red curve is a Poisson curve with rate = median count rate of data. |
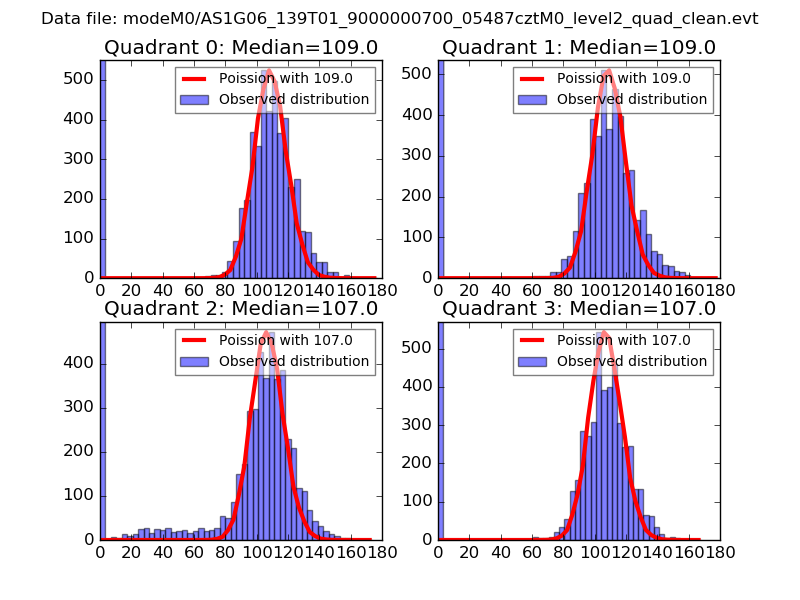 |
 |
| Quadrant-wise count rates Data is divided into 100 sec bins |
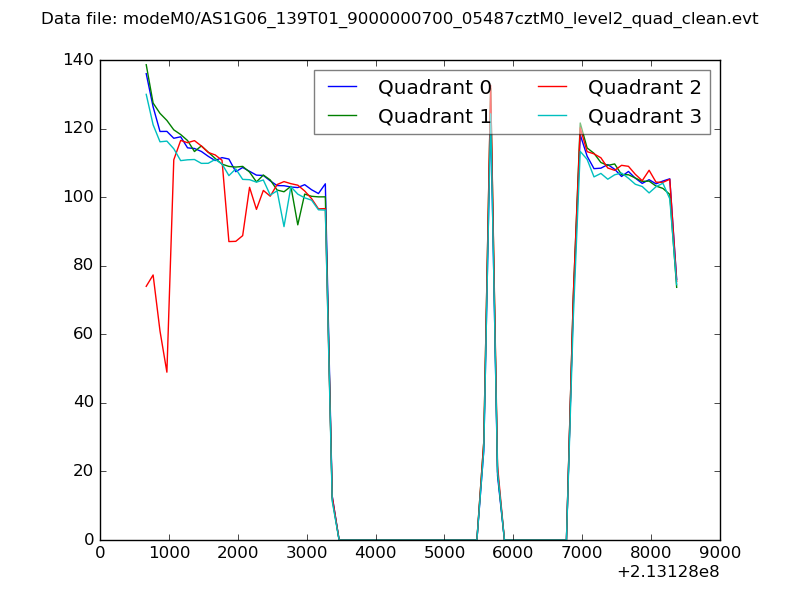 |
|
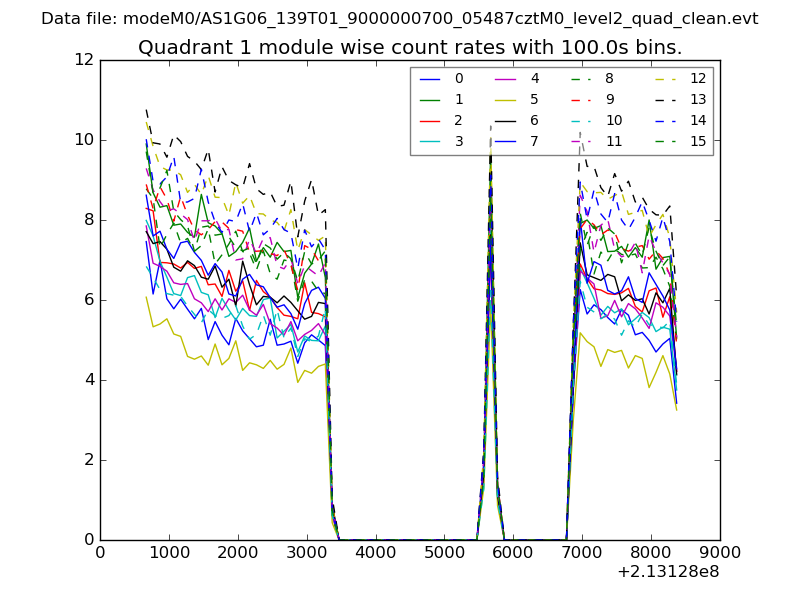
| Module-wise count rates for Quadrant A Data is divided into 100 sec bins |
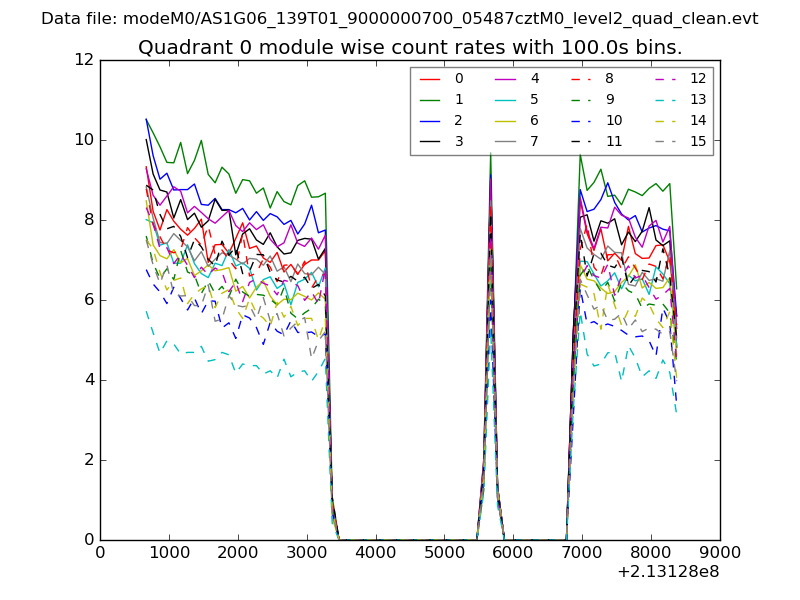 |
 |
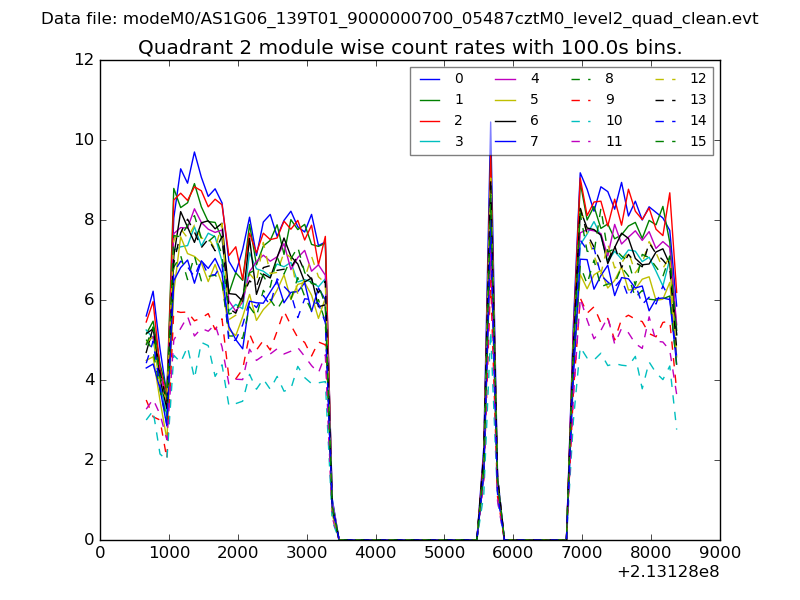
| Module-wise count rates for Quadrant B Data is divided into 100 sec bins |
 |
 |
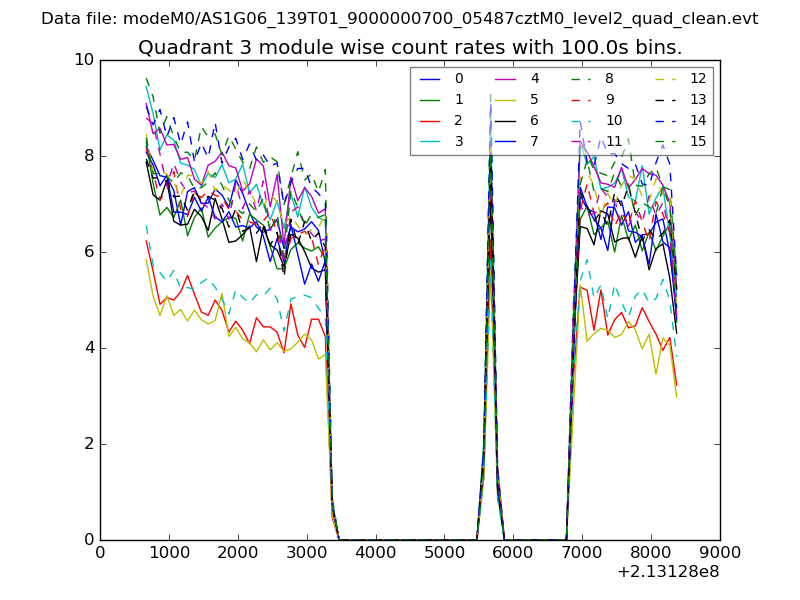
| Module-wise count rates for Quadrant C Data is divided into 100 sec bins |
 |
 |
| Module-wise count rates for Quadrant D Data is divided into 100 sec bins |
 |
 |
| Parameter | Plot |
|---|---|
| CZT HV Monitor | 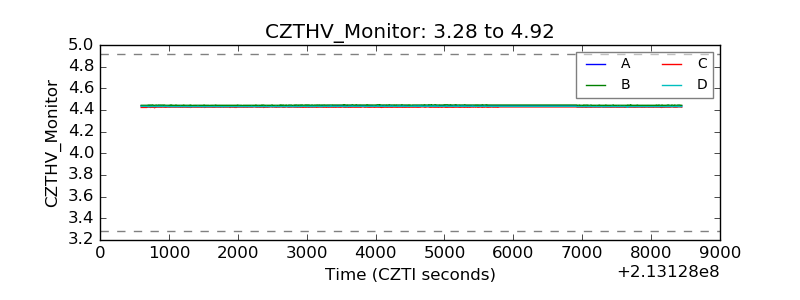 |
| D_VDD |  |
| Temperature 1 | 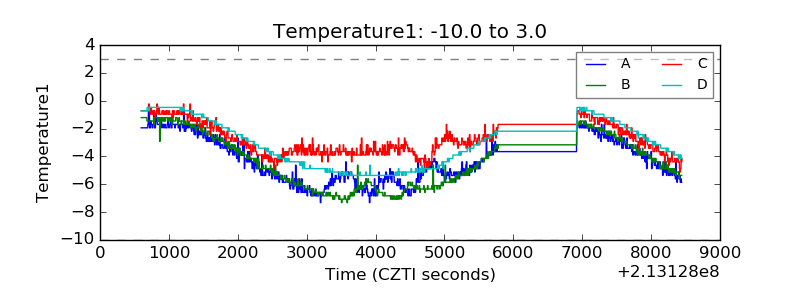 |
| Veto HV Monitor |  |
| Veto LLD | 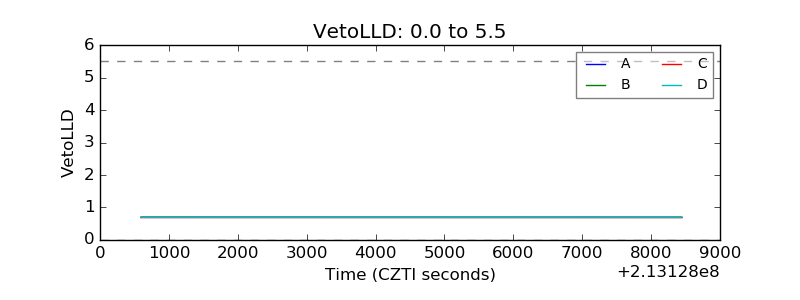 |
| Alpha Counter | 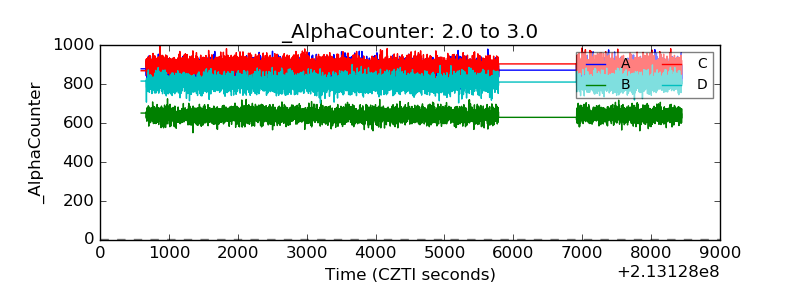 |
| _CPM_Rate | 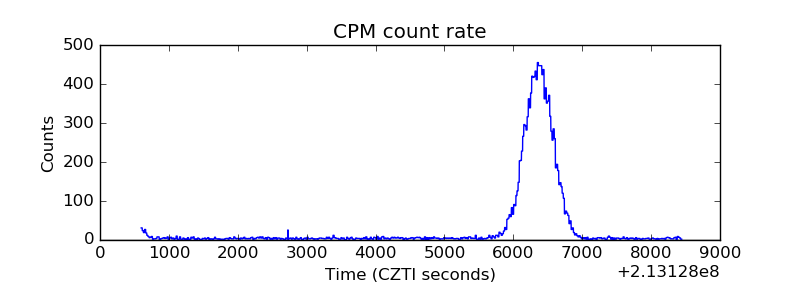 |
| CZT Counter | 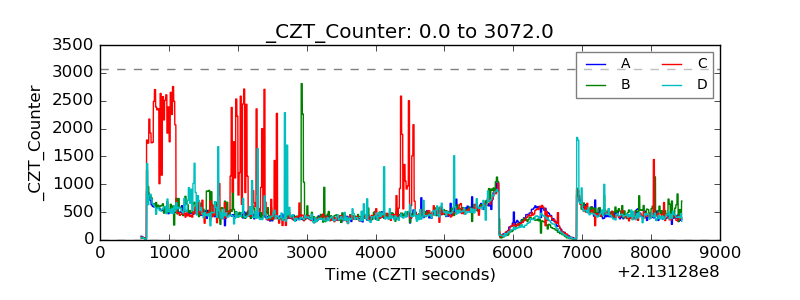 |
| +2.5 Volts monitor | 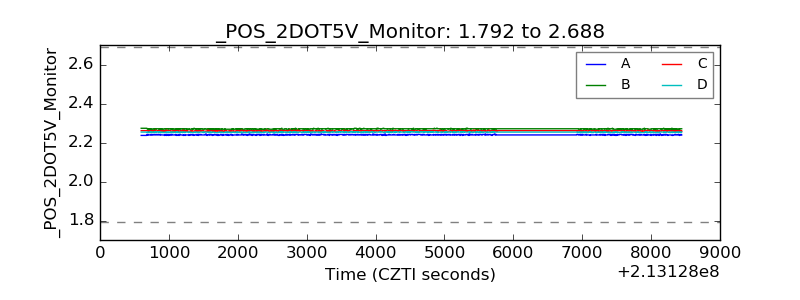 |
| +5 Volts monitor |  |
| _ROLL_ROT | 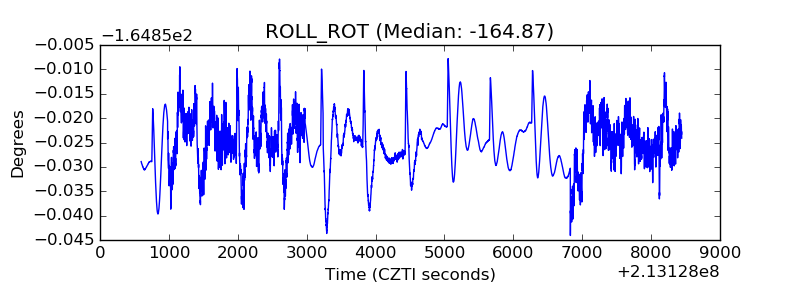 |
| _Roll_DEC | 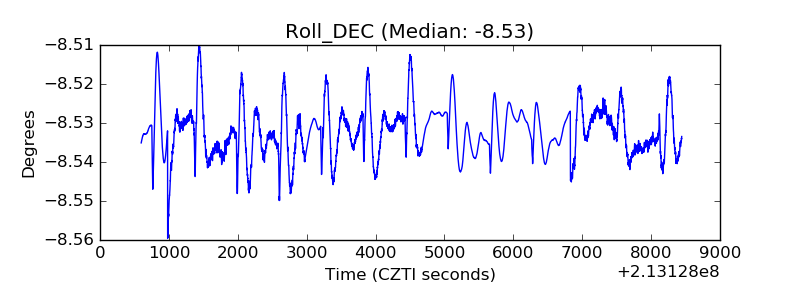 |
| _Roll_RA | 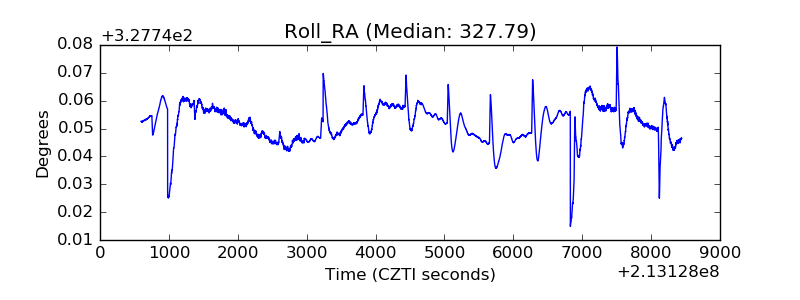 |
| Veto Counter | 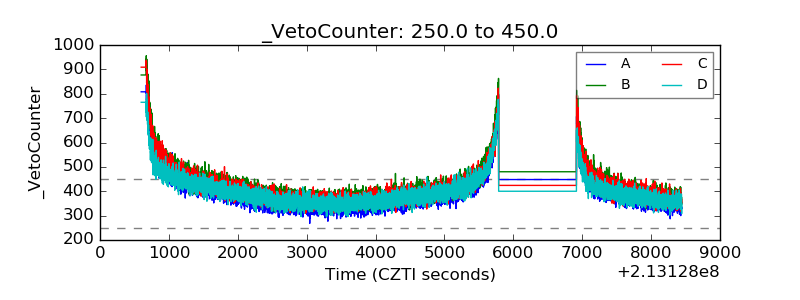 |