| Param | Original file | Final file |
|---|---|---|
| Filename | modeM0/AS1G06_139T01_9000000700_05488cztM0_level2.evt | modeM0/AS1G06_139T01_9000000700_05488cztM0_level2_quad_clean.evt |
| Size (bytes) | 452,885,760 | 81,262,080 |
| Size | 431.9 MB | 77.5 MB |
| Events in quadrant A | 3,127,865 | 498,246 |
| Events in quadrant B | 3,612,364 | 494,647 |
| Events in quadrant C | 3,289,078 | 502,031 |
| Events in quadrant D | 3,222,154 | 489,868 |
| Mode M9 | |||
|---|---|---|---|
| Quadrant | BADHDUFLAG | Total packets | Discarded packets |
| A | 0 | 13 | 0 |
| B | 0 | 13 | 0 |
| C | 0 | 13 | 0 |
| D | 0 | 14 | 0 |
| Mode SS | |||
|---|---|---|---|
| Quadrant | BADHDUFLAG | Total packets | Discarded packets |
| A | 0 | 138 | 0 |
| B | 0 | 138 | 0 |
| C | 0 | 138 | 0 |
| D | 0 | 138 | 0 |
| Mode M0 | |||
|---|---|---|---|
| Quadrant | BADHDUFLAG | Total packets | Discarded packets |
| A | 0 | 14184 | 5 |
| B | 0 | 15243 | 2 |
| C | 0 | 14679 | 5 |
| D | 0 | 14533 | 4 |
| Quadrant | Total seconds | Saturated seconds | Saturation percentage |
|---|---|---|---|
| A | 6830 | 58 | 0.849195% |
| B | 6831 | 105 | 1.537110% |
| C | 6829 | 65 | 0.951823% |
| D | 6830 | 57 | 0.834553% |
Noise dominated data is calculated using 1-second bins in cleaned event files. If a bin has >2000 counts, and if more than 50% of those come from <1% of pixels, then it is considered to be noise-dominated and hence unusable.
| Quadrant | # 1 sec bins | Bins with >0 counts | Bins with >2000 counts | High rate bins dominated by noise | Noise dominated (total time) | Noise dominated (detector-on time) | Marked lightcurve |
|---|---|---|---|---|---|---|---|
| A | 7656 | 6833 | 0 | 0 | 0.00% | 0.00% | 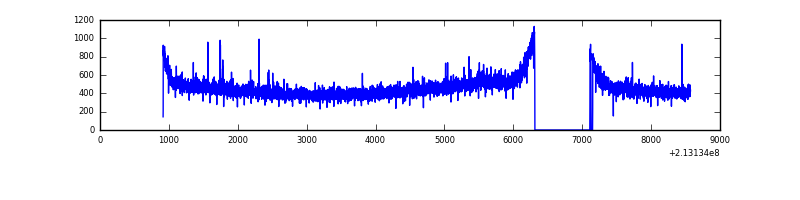 |
| B | 7656 | 6833 | 12 | 12 | 0.16% | 0.18% | 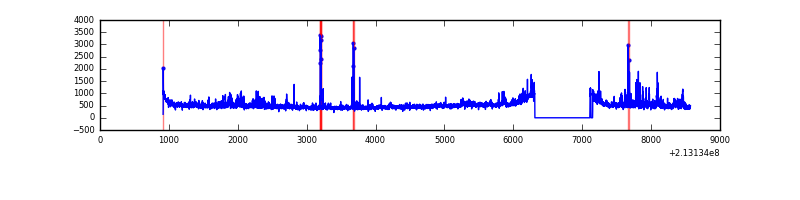 |
| C | 7656 | 6833 | 27 | 27 | 0.35% | 0.40% | 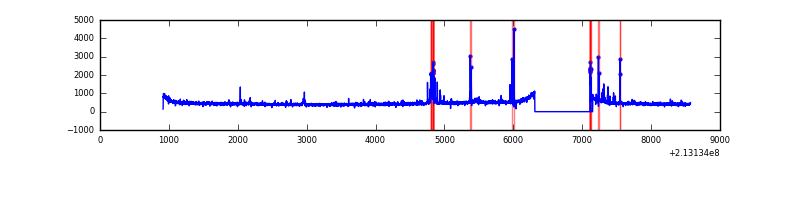 |
| D | 7656 | 6833 | 10 | 10 | 0.13% | 0.15% | 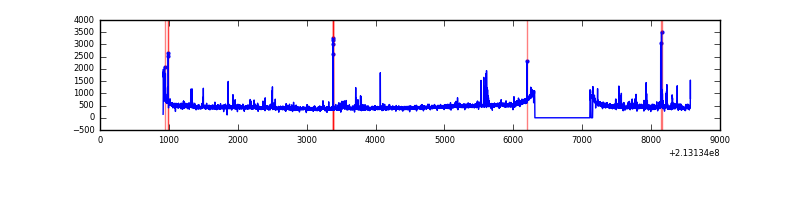 |
Top three noisy pixels from each quadrant. If the there are fewer than three noisy pixels in the level2.evt file, extra rows are filled as -1
| Pixel properties | Quadrant properties | ||||||
|---|---|---|---|---|---|---|---|
| Quadrant | DetID | PixID | Counts | Sigma | Mean | Median | Sigma |
| A | 13 | 251 | 24259 | 142.16 | 804 | 785 | 165.1 |
| A | 13 | 6 | 8557 | 47.07 | 804 | 785 | 165.1 |
| A | 12 | 194 | 8105 | 44.33 | 804 | 785 | 165.1 |
| B | 15 | 204 | 215502 | 1370.91 | 812 | 792 | 156.6 |
| B | 11 | 51 | 72064 | 455.07 | 812 | 792 | 156.6 |
| B | 7 | 252 | 60804 | 383.17 | 812 | 792 | 156.6 |
| C | 9 | 247 | 217531 | 1200.64 | 777 | 782 | 180.5 |
| C | 1 | 16 | 32745 | 177.05 | 777 | 782 | 180.5 |
| C | 13 | 61 | 6296 | 30.54 | 777 | 782 | 180.5 |
| D | 2 | 152 | 76657 | 389.73 | 782 | 756 | 194.8 |
| D | 8 | 195 | 59246 | 300.33 | 782 | 756 | 194.8 |
| D | 2 | 33 | 31882 | 159.82 | 782 | 756 | 194.8 |
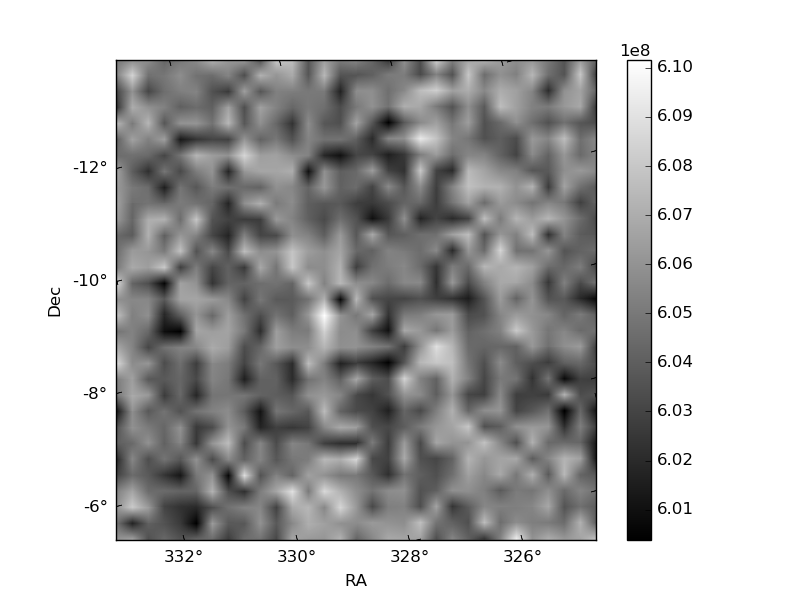
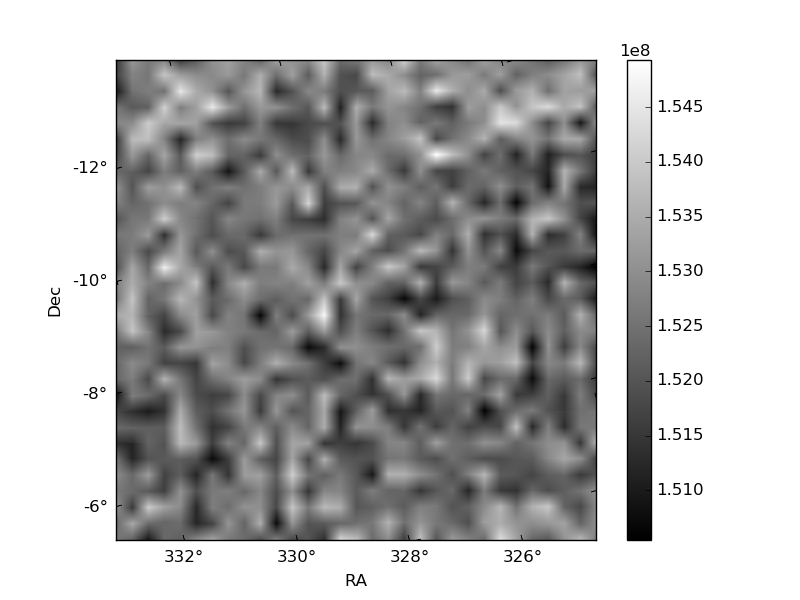
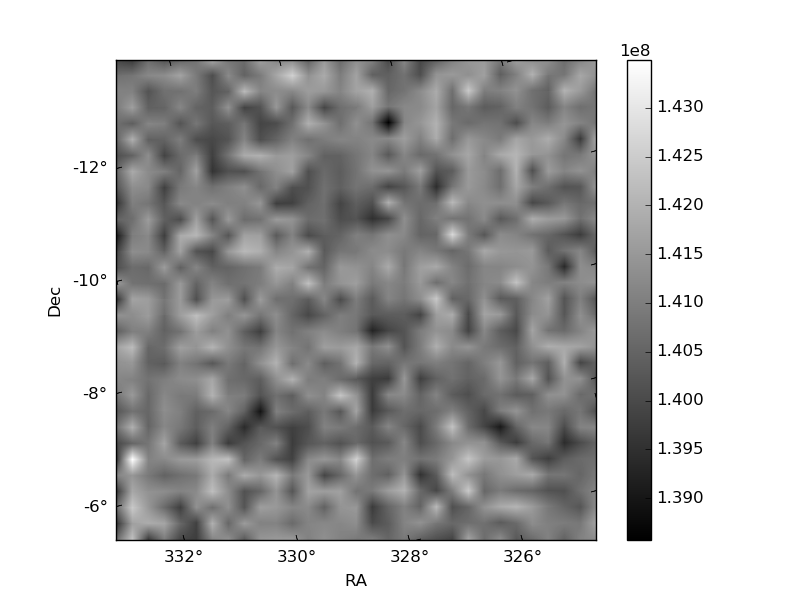
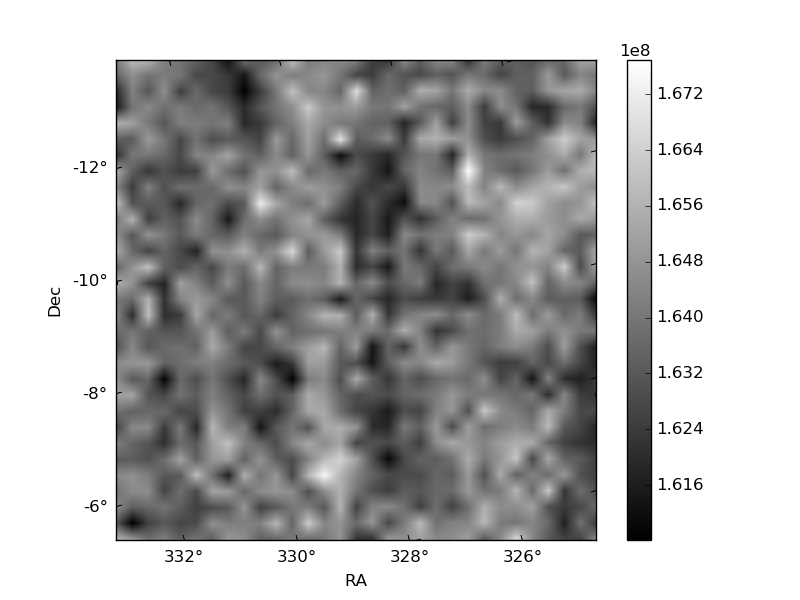
Histogram calculated using DETX and DETY for each event in the final _common_clean file
| Quadrant A | 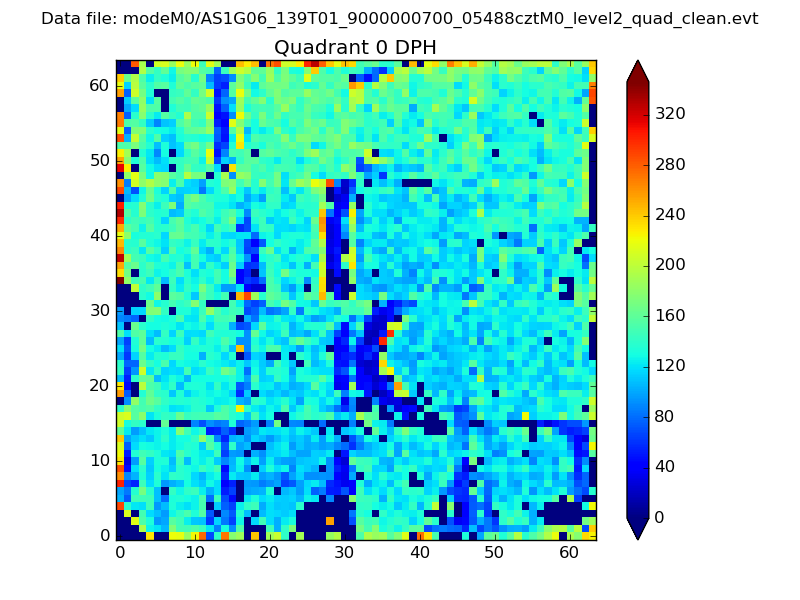 |
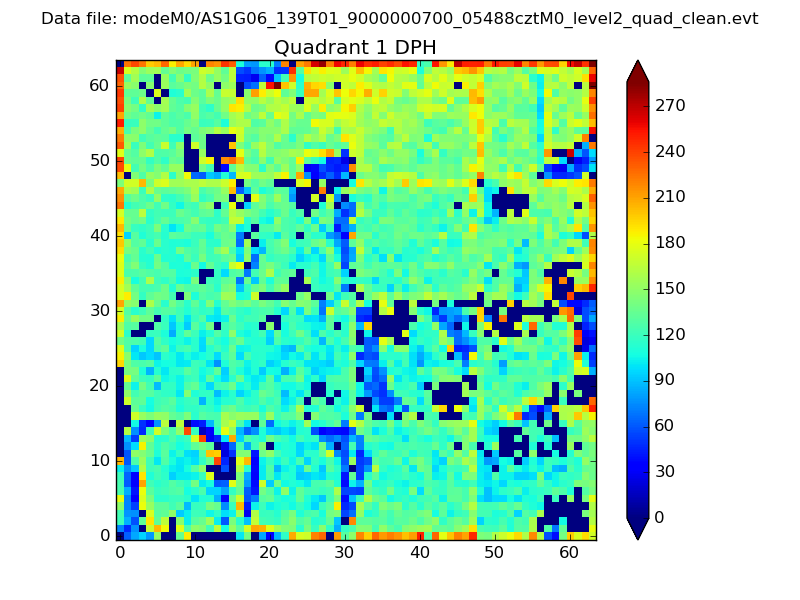 |
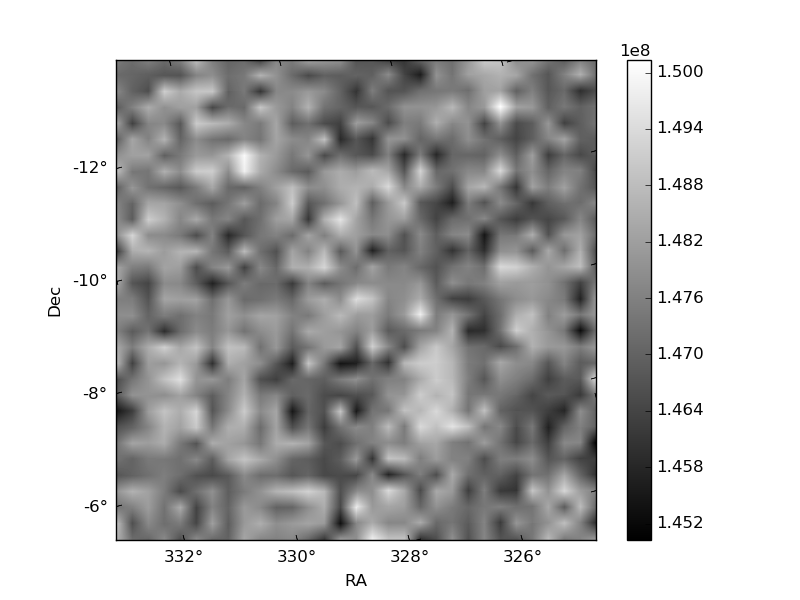
Quadrant B |
|---|---|---|---|
| Quadrant D | 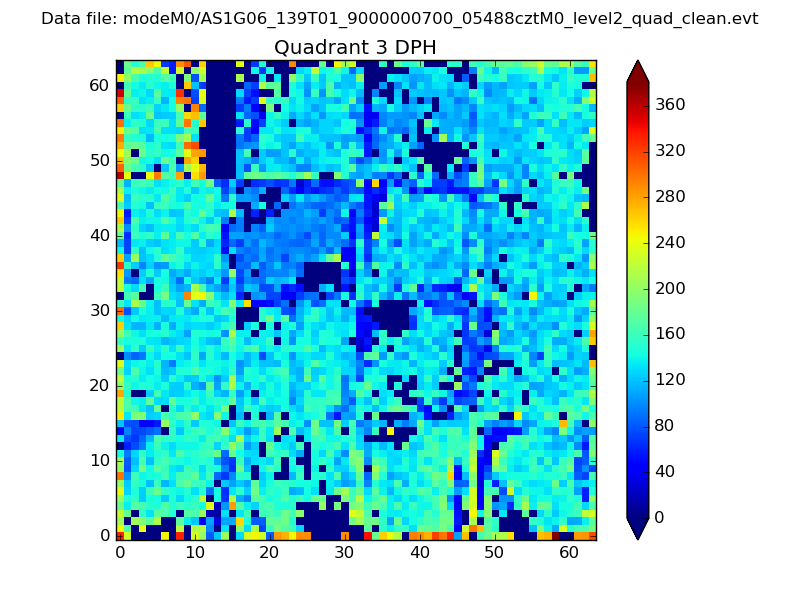 |
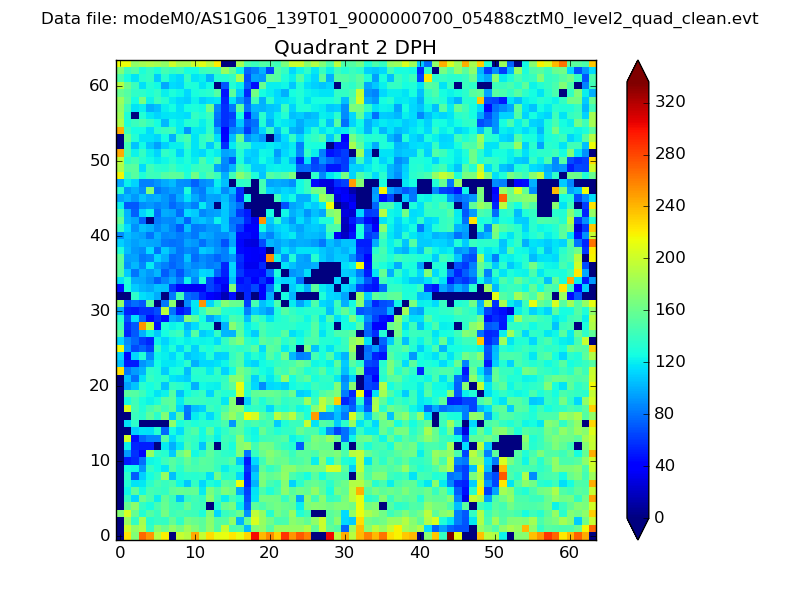 |
Quadrant C |
| Plot type | Count rate plots | Images |
|---|---|---|
| Comparison with Poisson distribution Blue bars denote a histogram of data divided into 1 sec bins. Red curve is a Poisson curve with rate = median count rate of data. |
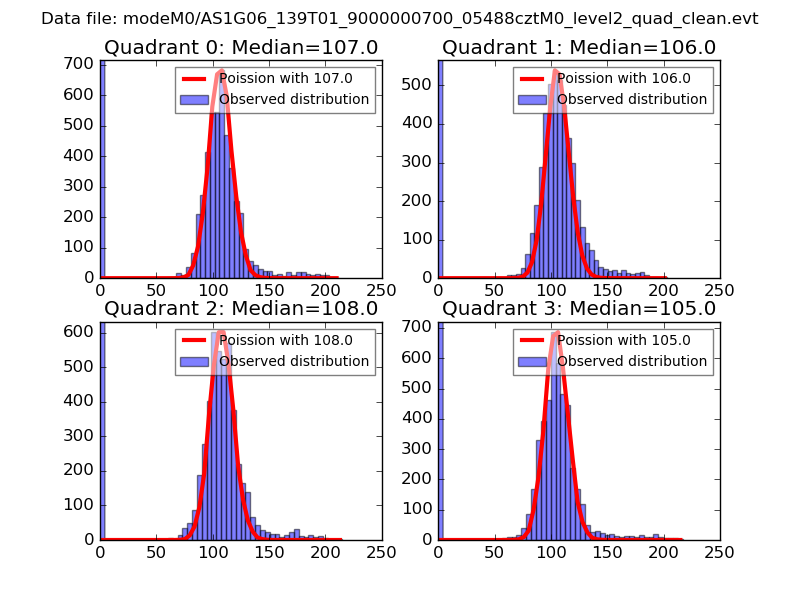 |
 |
| Quadrant-wise count rates Data is divided into 100 sec bins |
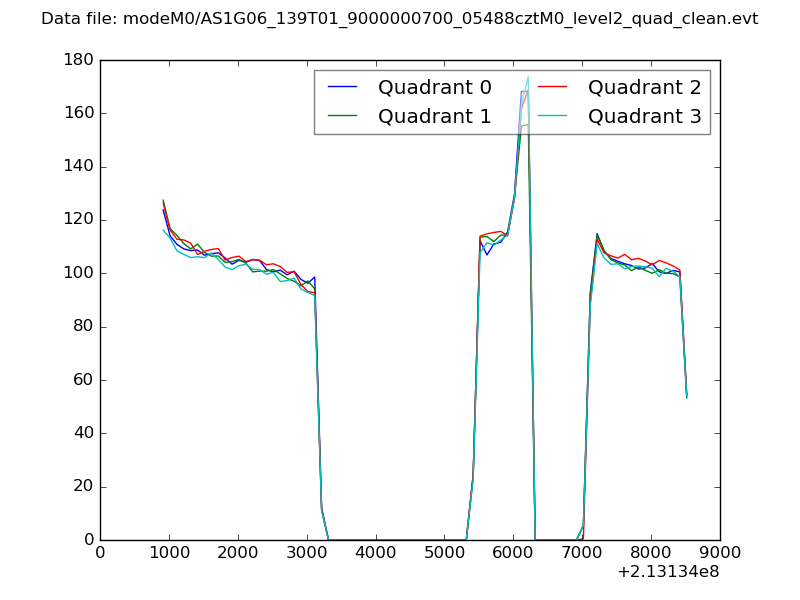 |
|
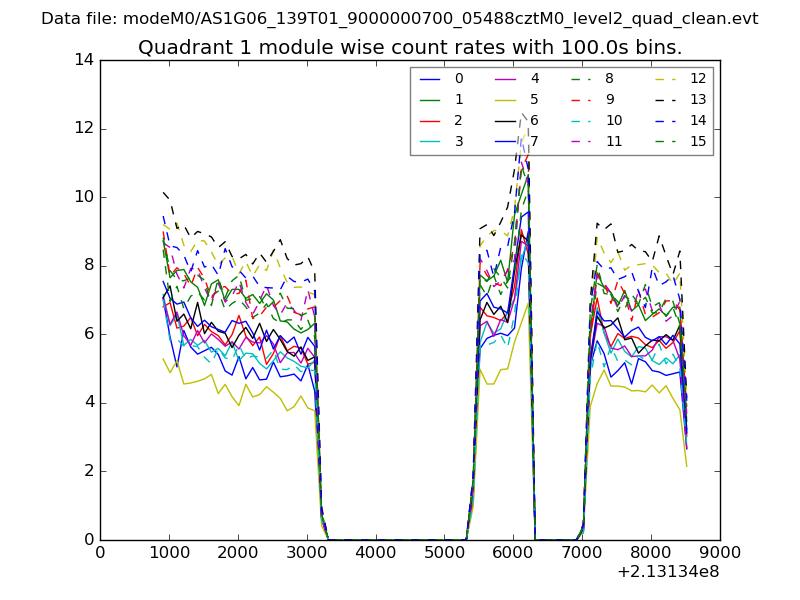
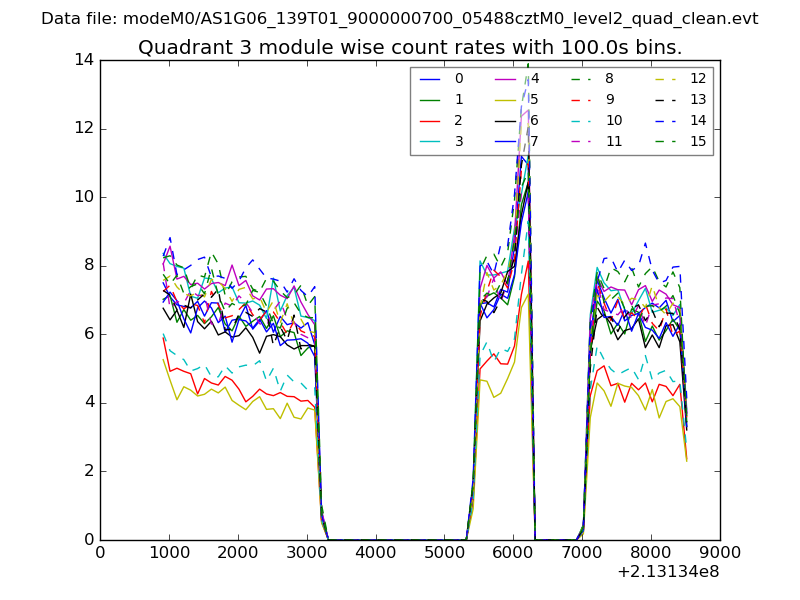
| Module-wise count rates for Quadrant A Data is divided into 100 sec bins |
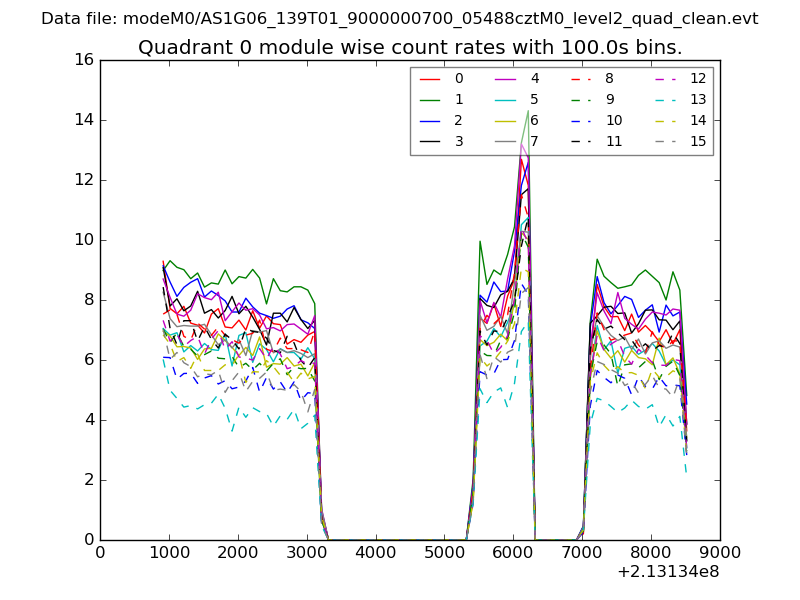 |
 |
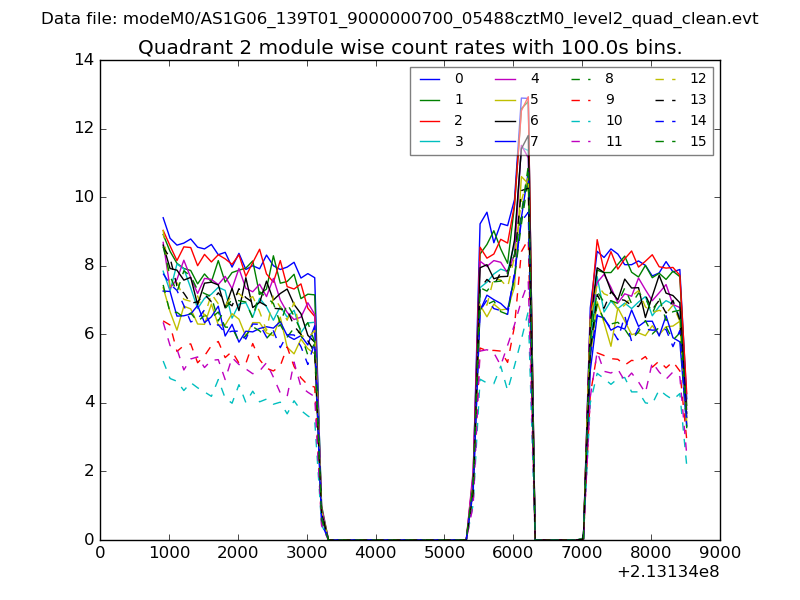
| Module-wise count rates for Quadrant B Data is divided into 100 sec bins |
 |
 |
| Module-wise count rates for Quadrant C Data is divided into 100 sec bins |
 |
 |
| Module-wise count rates for Quadrant D Data is divided into 100 sec bins |
 |
 |
| Parameter | Plot |
|---|---|
| CZT HV Monitor | 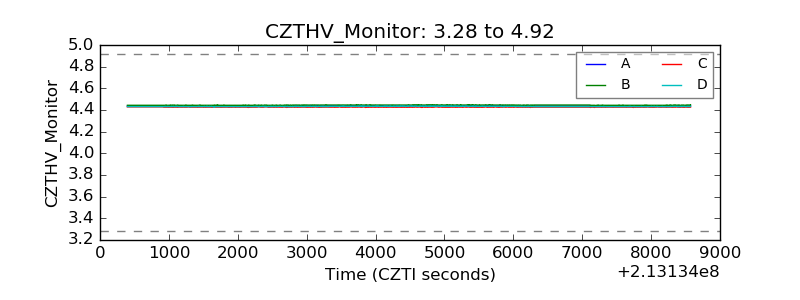 |
| D_VDD | 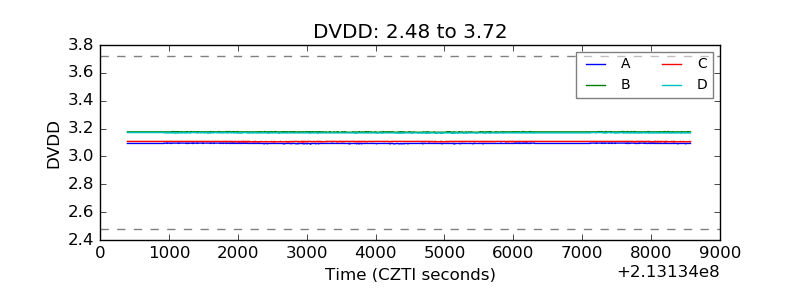 |
| Temperature 1 | 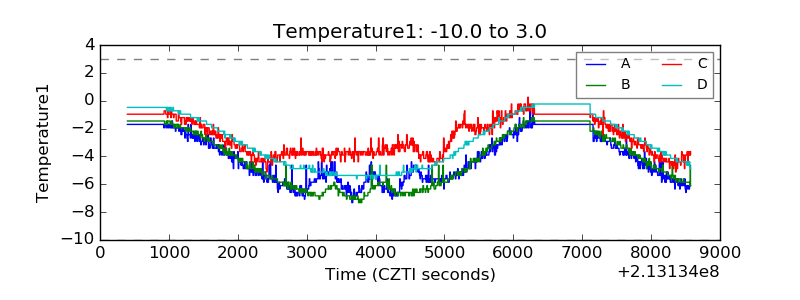 |
| Veto HV Monitor | 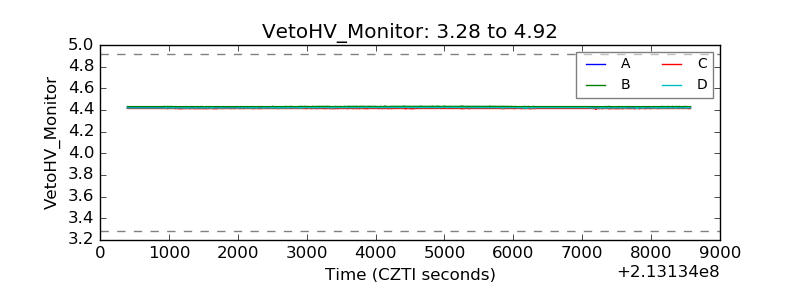 |
| Veto LLD | 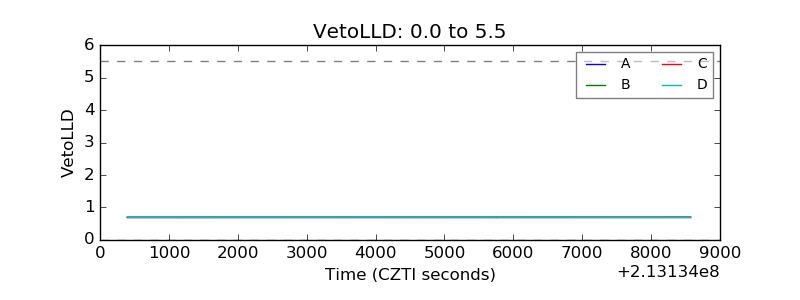 |
| Alpha Counter | 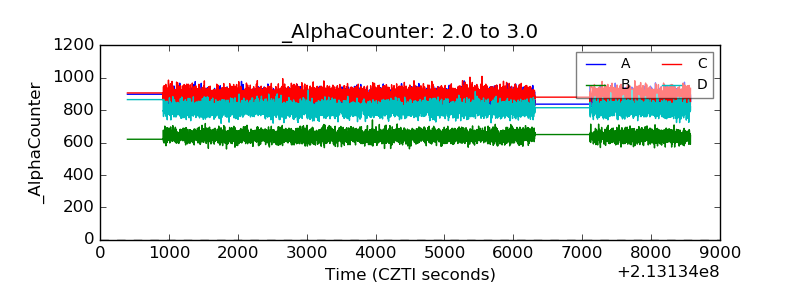 |
| _CPM_Rate | 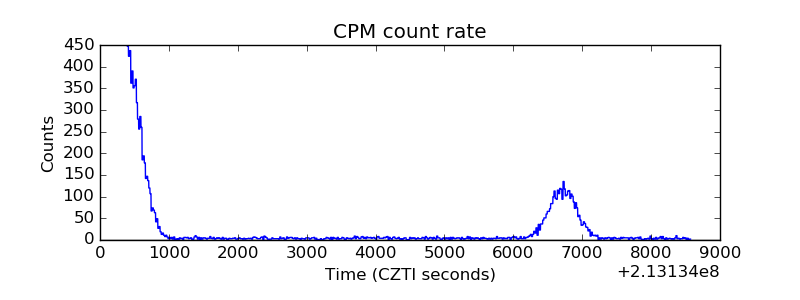 |
| CZT Counter | 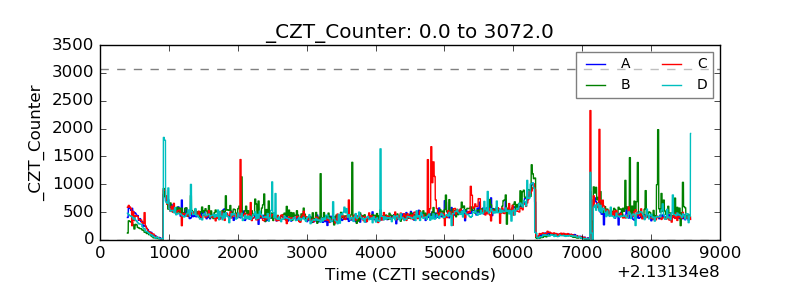 |
| +2.5 Volts monitor | 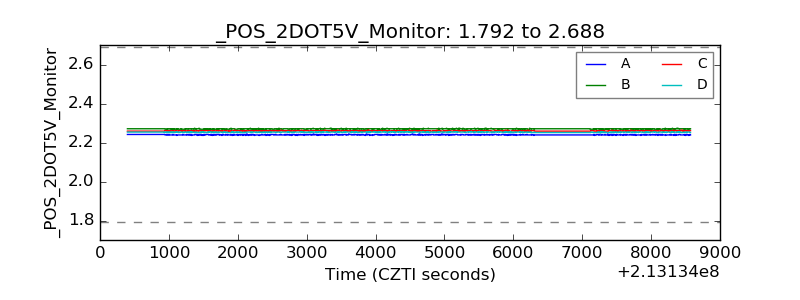 |
| +5 Volts monitor |  |
| _ROLL_ROT | 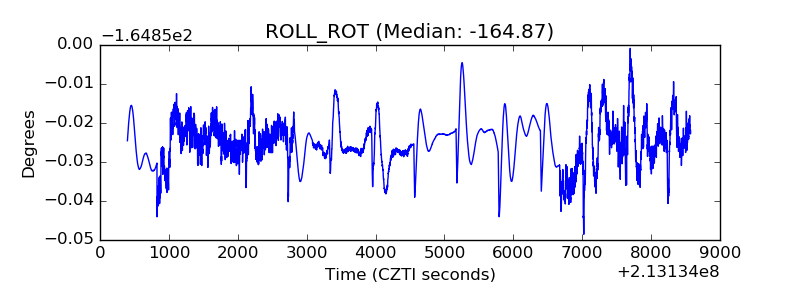 |
| _Roll_DEC | 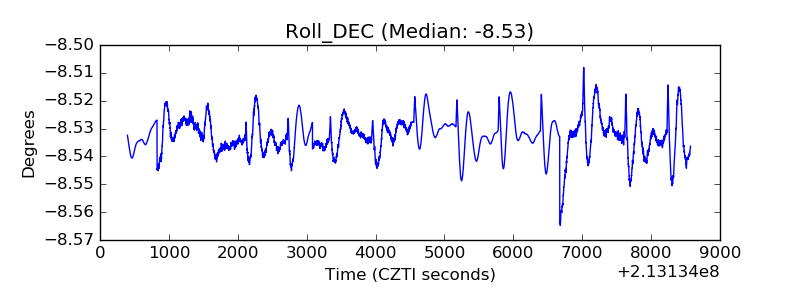 |
| _Roll_RA | 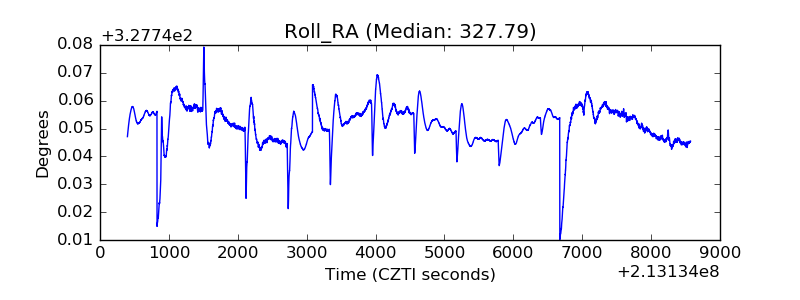 |
| Veto Counter | 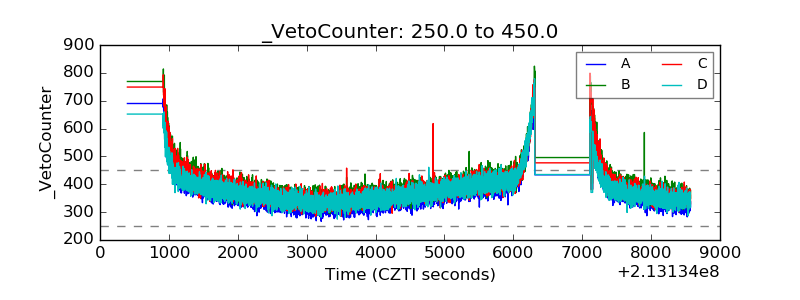 |