| Param | Original file | Final file |
|---|---|---|
| Filename | modeM0/AS1G06_139T01_9000000700_05489cztM0_level2.evt | modeM0/AS1G06_139T01_9000000700_05489cztM0_level2_quad_clean.evt |
| Size (bytes) | 119,332,800 | 27,780,480 |
| Size | 113.8 MB | 26.5 MB |
| Events in quadrant A | 791,800 | 179,851 |
| Events in quadrant B | 989,329 | 177,947 |
| Events in quadrant C | 847,585 | 181,626 |
| Events in quadrant D | 869,091 | 178,729 |
| Mode M9 | |||
|---|---|---|---|
| Quadrant | BADHDUFLAG | Total packets | Discarded packets |
| A | 0 | 8 | 0 |
| B | 0 | 8 | 0 |
| C | 0 | 8 | 0 |
| D | 0 | 8 | 0 |
| Mode SS | |||
|---|---|---|---|
| Quadrant | BADHDUFLAG | Total packets | Discarded packets |
| A | 0 | 36 | 0 |
| B | 0 | 36 | 0 |
| C | 0 | 36 | 0 |
| D | 0 | 36 | 0 |
| Mode M0 | |||
|---|---|---|---|
| Quadrant | BADHDUFLAG | Total packets | Discarded packets |
| A | 0 | 3569 | 11 |
| B | 0 | 4041 | 7 |
| C | 0 | 3744 | 7 |
| D | 0 | 3748 | 5 |
| Quadrant | Total seconds | Saturated seconds | Saturation percentage |
|---|---|---|---|
| A | 1665 | 47 | 2.822823% |
| B | 1666 | 73 | 4.381753% |
| C | 1666 | 34 | 2.040816% |
| D | 1667 | 33 | 1.979604% |
Noise dominated data is calculated using 1-second bins in cleaned event files. If a bin has >2000 counts, and if more than 50% of those come from <1% of pixels, then it is considered to be noise-dominated and hence unusable.
| Quadrant | # 1 sec bins | Bins with >0 counts | Bins with >2000 counts | High rate bins dominated by noise | Noise dominated (total time) | Noise dominated (detector-on time) | Marked lightcurve |
|---|---|---|---|---|---|---|---|
| A | 2494 | 1671 | 0 | 0 | 0.00% | 0.00% | 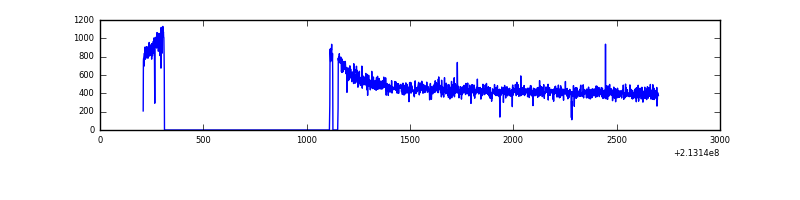 |
| B | 2494 | 1671 | 2 | 2 | 0.08% | 0.12% |  |
| C | 2494 | 1671 | 12 | 12 | 0.48% | 0.72% | 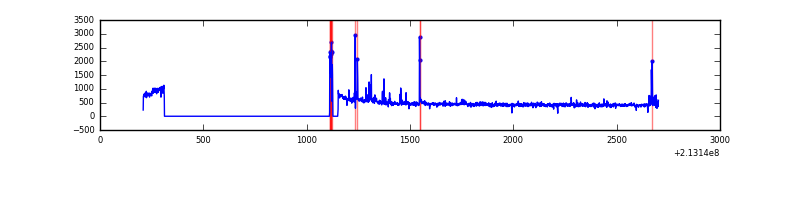 |
| D | 2494 | 1671 | 5 | 5 | 0.20% | 0.30% | 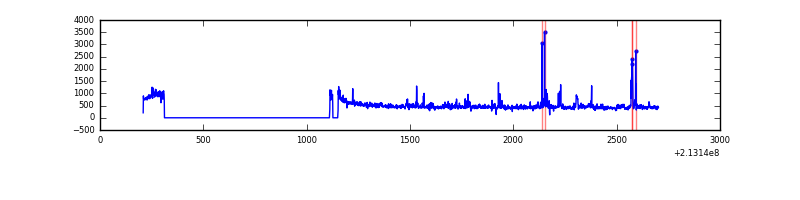 |
Top three noisy pixels from each quadrant. If the there are fewer than three noisy pixels in the level2.evt file, extra rows are filled as -1
| Pixel properties | Quadrant properties | ||||||
|---|---|---|---|---|---|---|---|
| Quadrant | DetID | PixID | Counts | Sigma | Mean | Median | Sigma |
| A | 13 | 6 | 2639 | 55.29 | 204 | 199 | 44.1 |
| A | 12 | 194 | 2095 | 42.96 | 204 | 199 | 44.1 |
| A | 0 | 226 | 2056 | 42.08 | 204 | 199 | 44.1 |
| B | 15 | 204 | 68020 | 1599.94 | 205 | 200 | 42.4 |
| B | 11 | 51 | 48569 | 1141.07 | 205 | 200 | 42.4 |
| B | 7 | 252 | 41694 | 978.88 | 205 | 200 | 42.4 |
| C | 9 | 247 | 68896 | 1453.7 | 195 | 196 | 47.3 |
| C | 1 | 16 | 14913 | 311.41 | 195 | 196 | 47.3 |
| C | 13 | 61 | 1572 | 29.12 | 195 | 196 | 47.3 |
| D | 2 | 152 | 34314 | 671.27 | 199 | 192 | 50.8 |
| D | 8 | 195 | 21786 | 424.81 | 199 | 192 | 50.8 |
| D | 2 | 136 | 15623 | 303.57 | 199 | 192 | 50.8 |
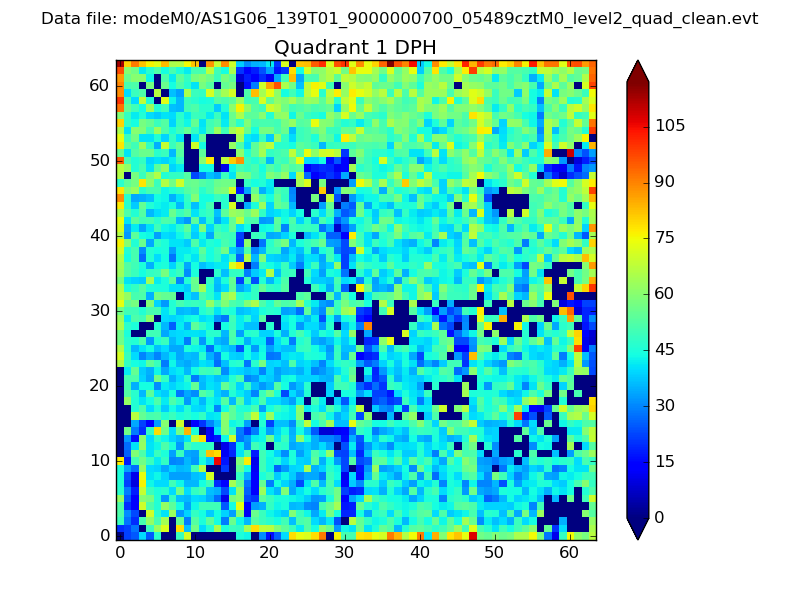
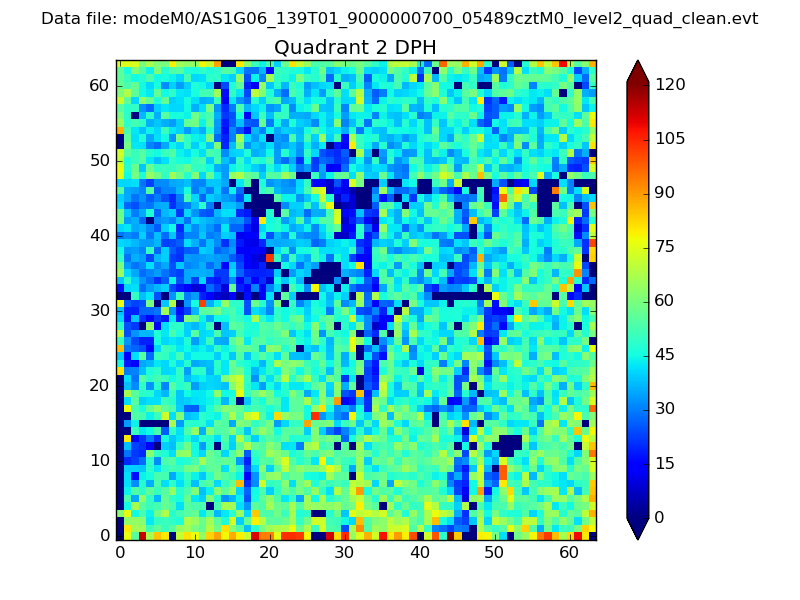
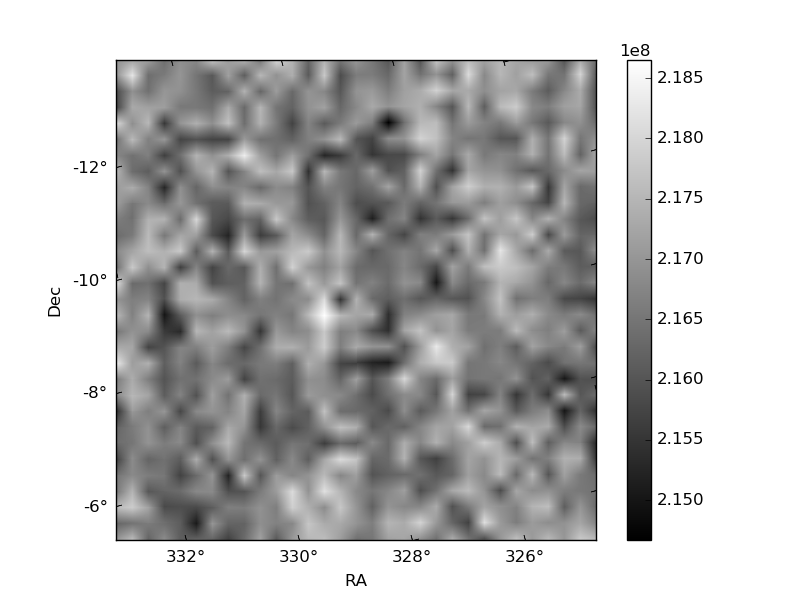
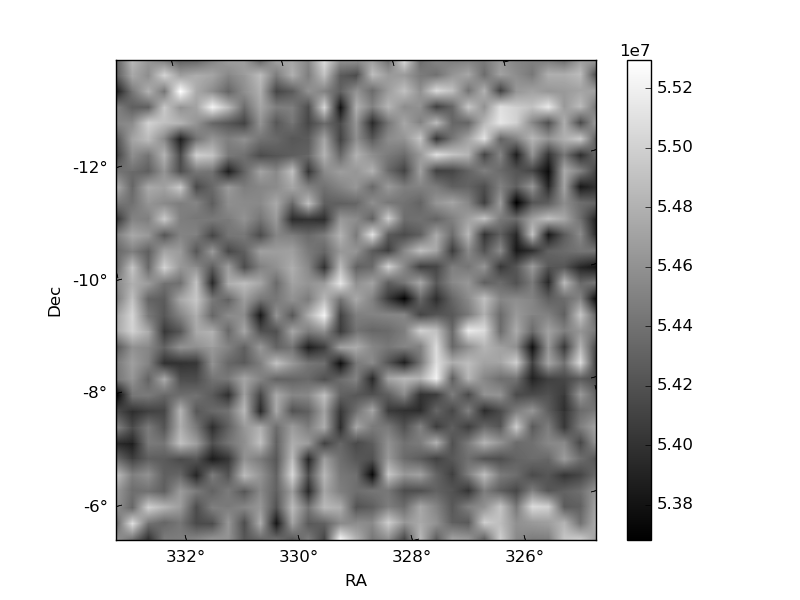
Histogram calculated using DETX and DETY for each event in the final _common_clean file
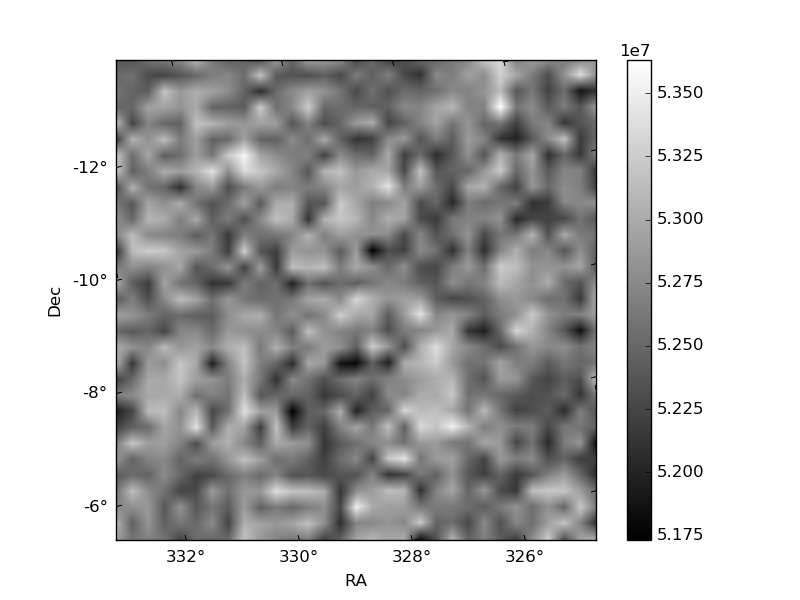
| Quadrant A | 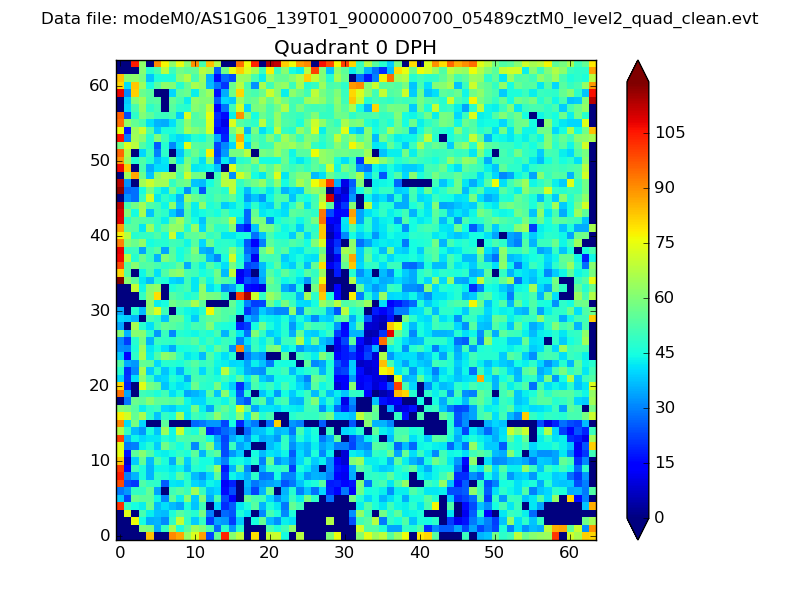 |
 |
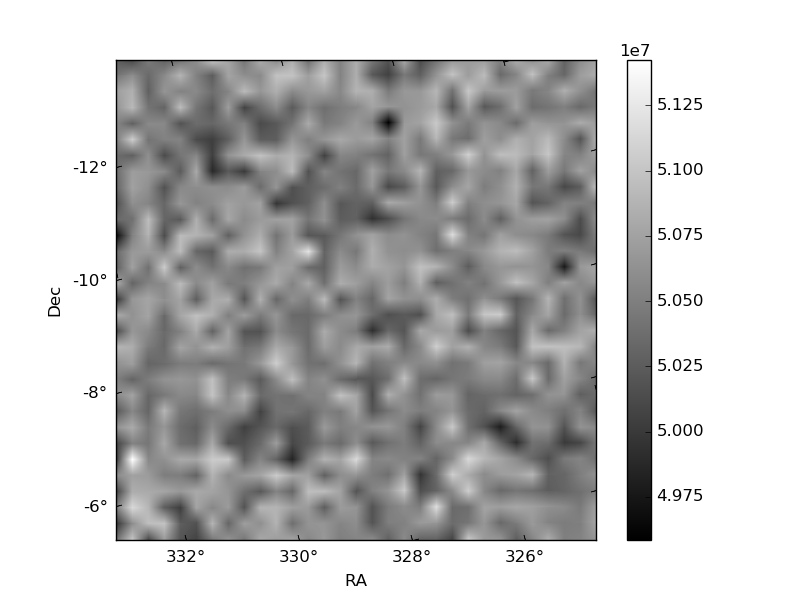
Quadrant B |
|---|---|---|---|
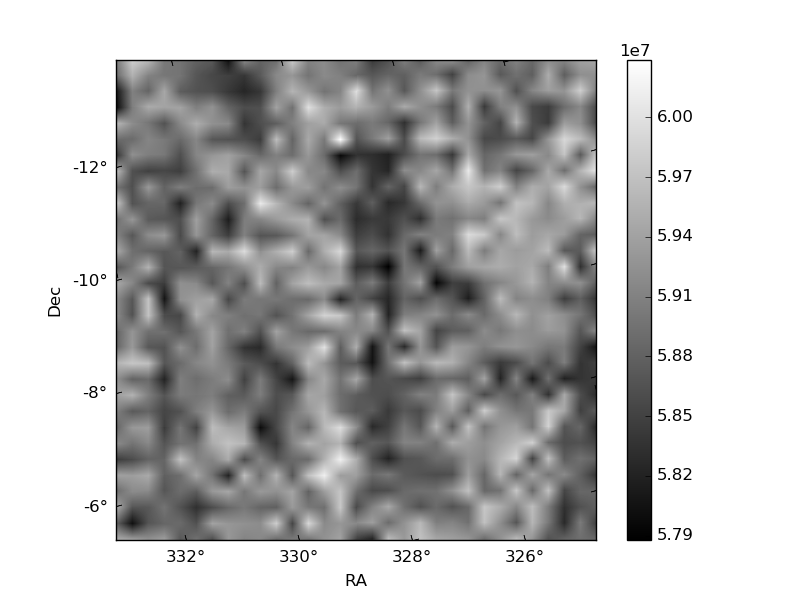
| Quadrant D | 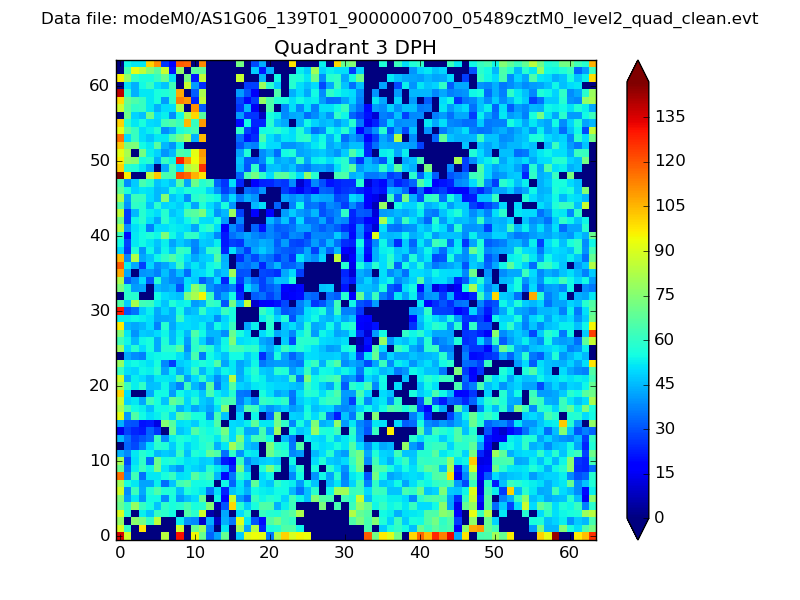 |
 |
Quadrant C |
| Plot type | Count rate plots | Images |
|---|---|---|
| Comparison with Poisson distribution Blue bars denote a histogram of data divided into 1 sec bins. Red curve is a Poisson curve with rate = median count rate of data. |
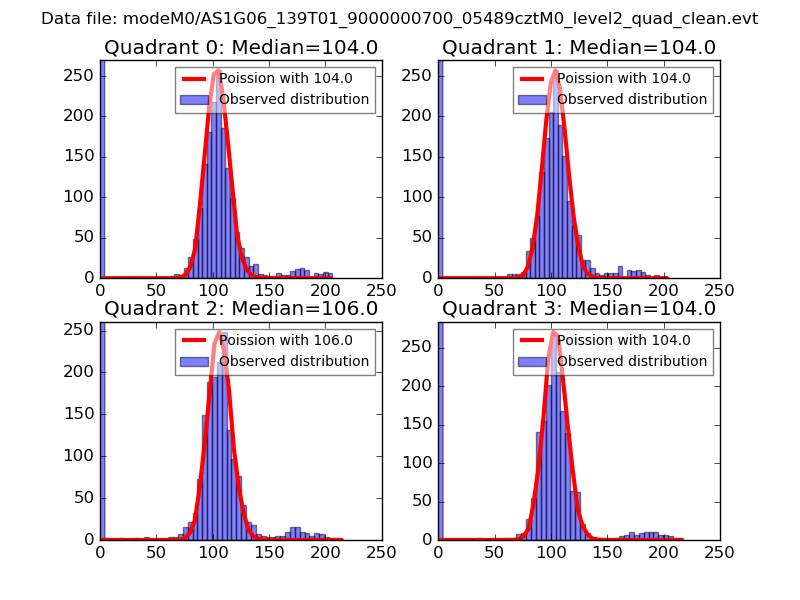 |
 |
| Quadrant-wise count rates Data is divided into 100 sec bins |
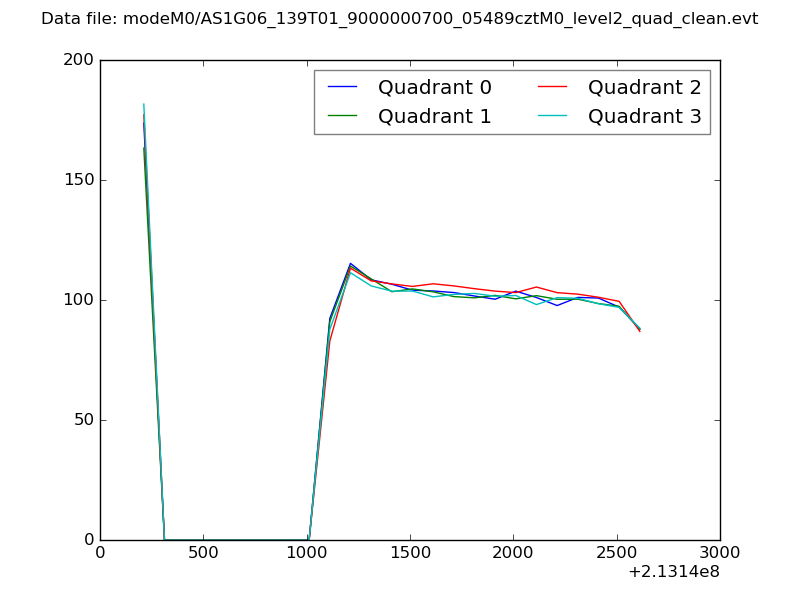 |
|
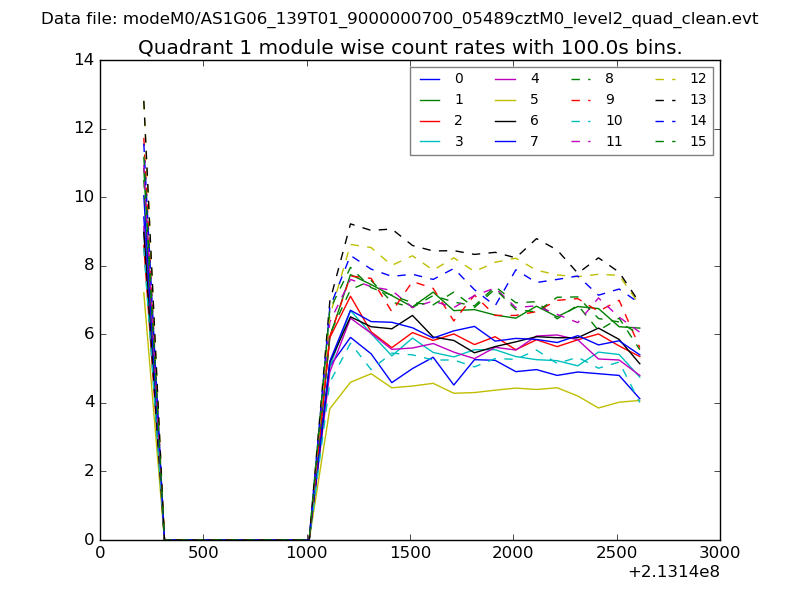
| Module-wise count rates for Quadrant A Data is divided into 100 sec bins |
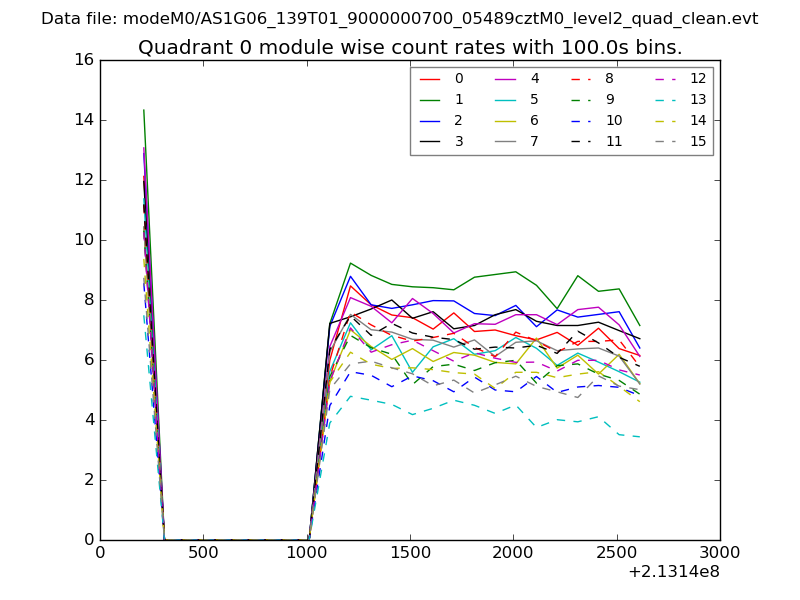 |
 |
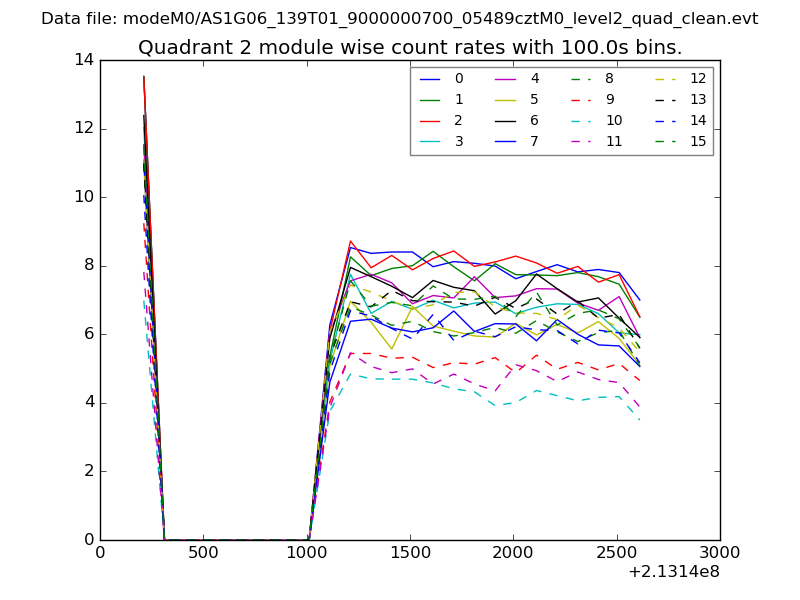
| Module-wise count rates for Quadrant B Data is divided into 100 sec bins |
 |
 |
| Module-wise count rates for Quadrant C Data is divided into 100 sec bins |
 |
 |
| Module-wise count rates for Quadrant D Data is divided into 100 sec bins |
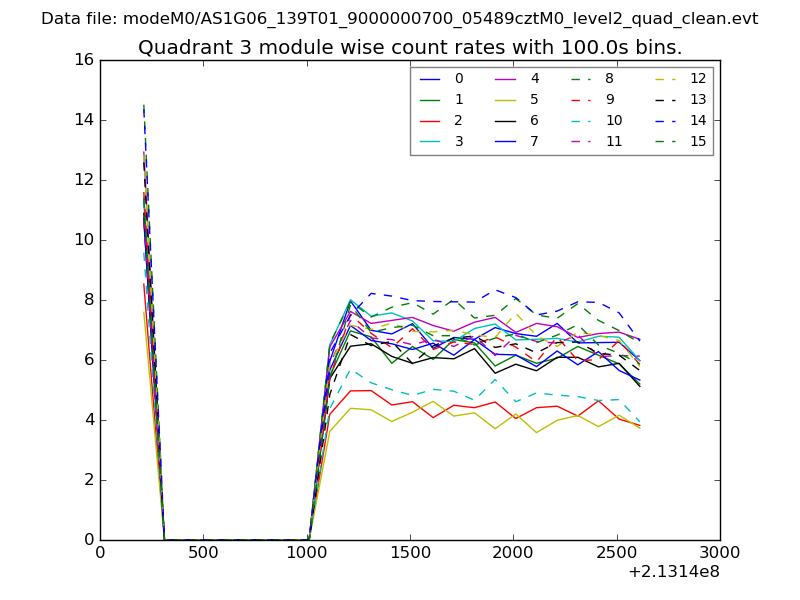 |
 |
| Parameter | Plot |
|---|---|
| CZT HV Monitor | 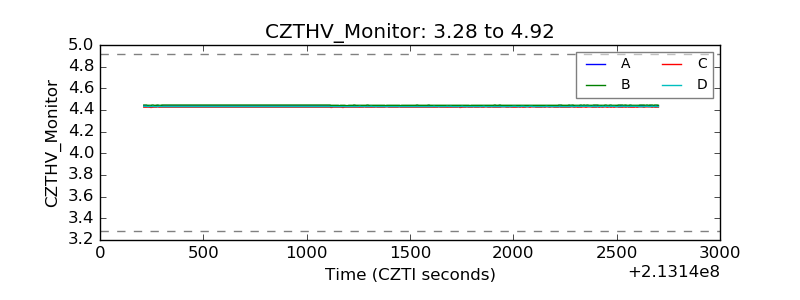 |
| D_VDD | 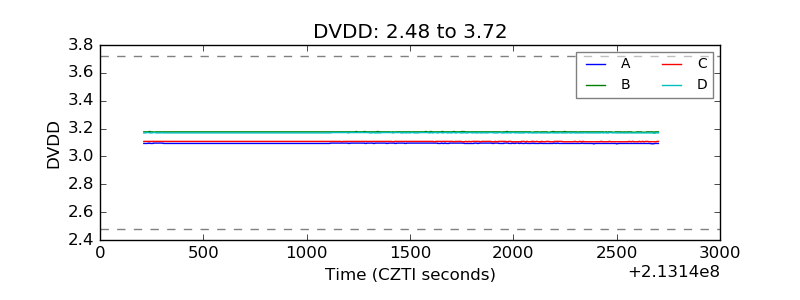 |
| Temperature 1 | 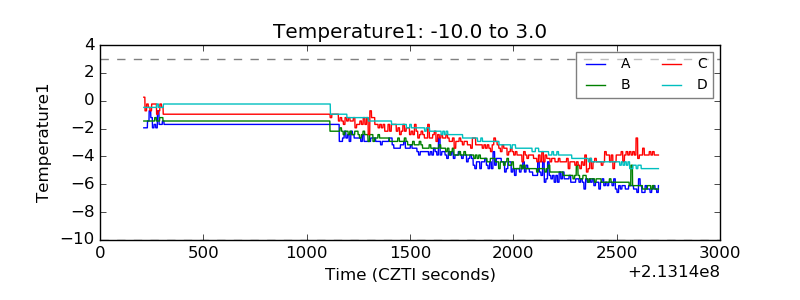 |
| Veto HV Monitor | 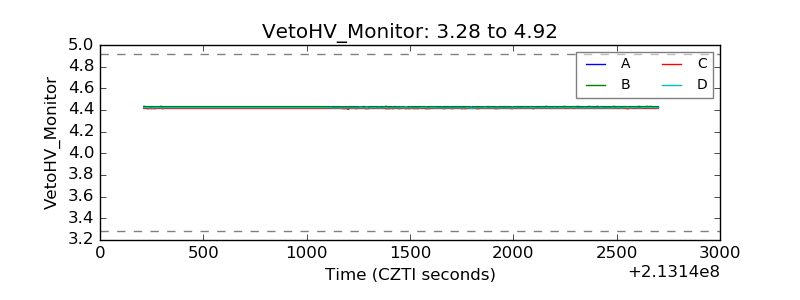 |
| Veto LLD | 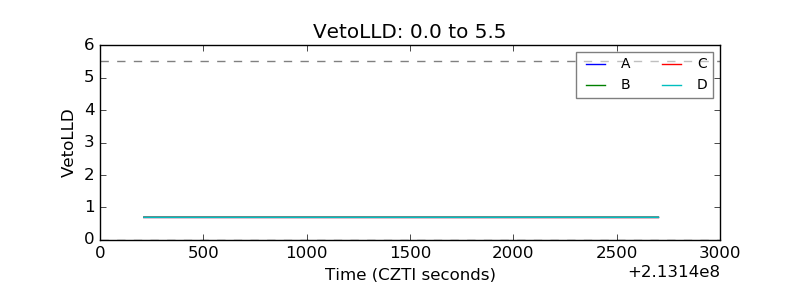 |
| Alpha Counter | 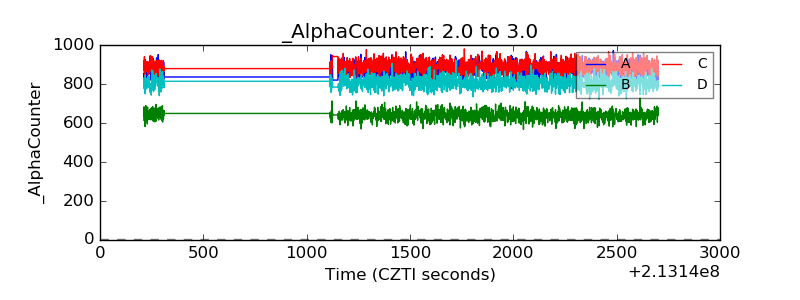 |
| _CPM_Rate | 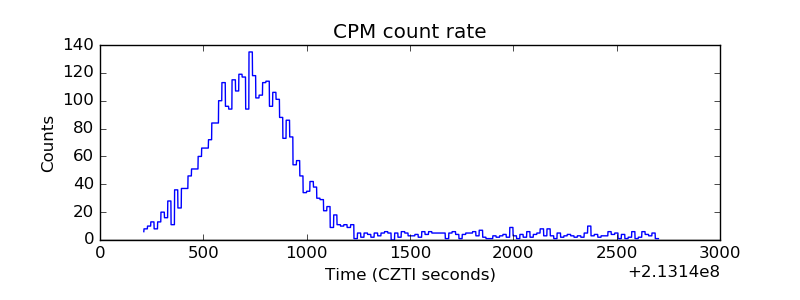 |
| CZT Counter | 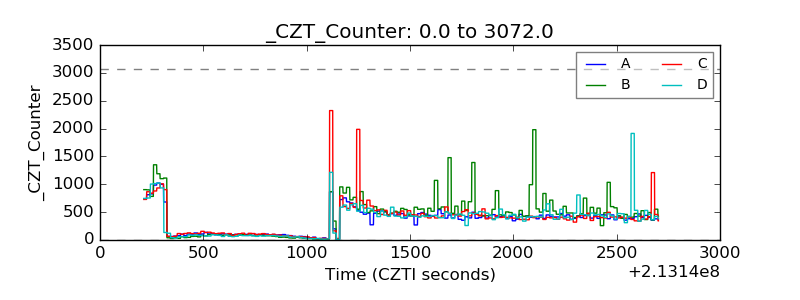 |
| +2.5 Volts monitor | 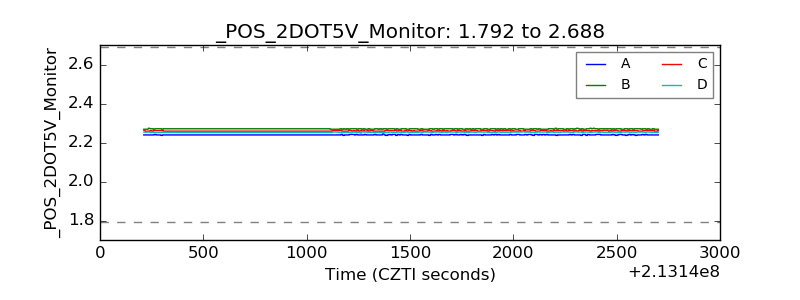 |
| +5 Volts monitor | 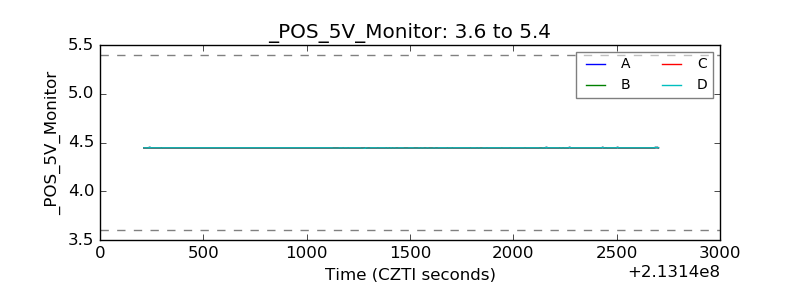 |
| _ROLL_ROT | 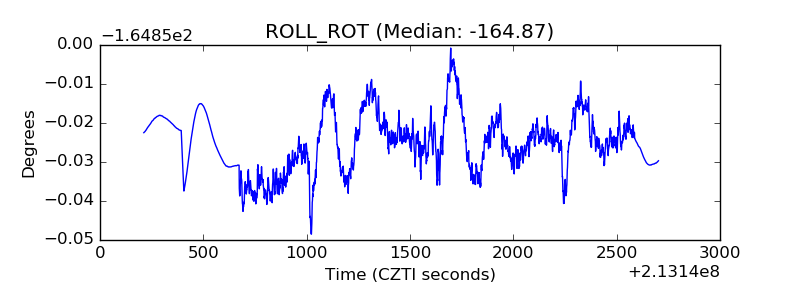 |
| _Roll_DEC | 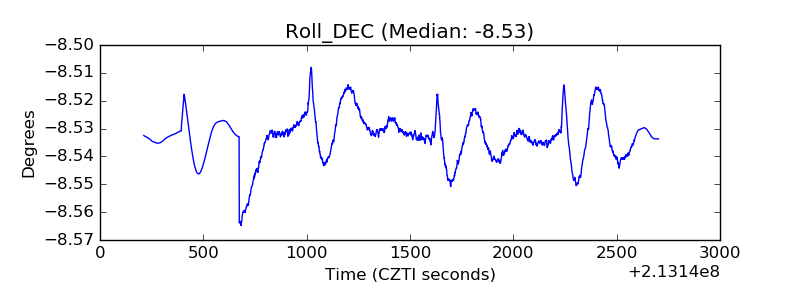 |
| _Roll_RA | 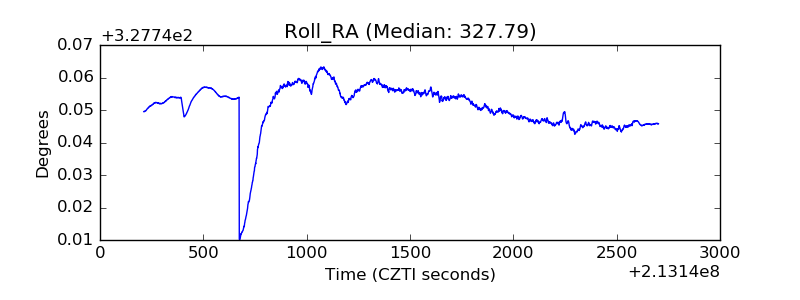 |
| Veto Counter | 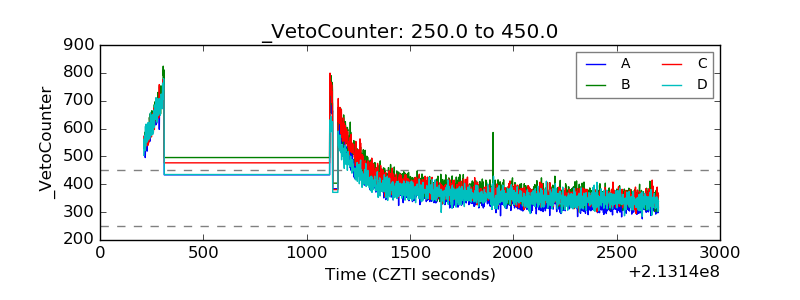 |