| Param | Original file | Final file |
|---|---|---|
| Filename | modeM0/AS1A02_162T01_9000000704_05498cztM0_level2.evt | modeM0/AS1A02_162T01_9000000704_05498cztM0_level2_quad_clean.evt |
| Size (bytes) | 220,812,480 | 31,052,160 |
| Size | 210.6 MB | 29.6 MB |
| Events in quadrant A | 1,413,275 | 189,260 |
| Events in quadrant B | 1,810,839 | 187,814 |
| Events in quadrant C | 1,680,619 | 184,249 |
| Events in quadrant D | 1,588,052 | 175,753 |
| Mode M0 | |||
|---|---|---|---|
| Quadrant | BADHDUFLAG | Total packets | Discarded packets |
| A | 0 | 5999 | 2 |
| B | 0 | 7303 | 1 |
| C | 0 | 6853 | 1 |
| D | 0 | 6523 | 1 |
| Mode SS | |||
|---|---|---|---|
| Quadrant | BADHDUFLAG | Total packets | Discarded packets |
| A | 0 | 58 | 0 |
| B | 0 | 58 | 0 |
| C | 0 | 58 | 0 |
| D | 0 | 58 | 0 |
| Mode M9 | |||
|---|---|---|---|
| Quadrant | BADHDUFLAG | Total packets | Discarded packets |
| A | 0 | 12 | 0 |
| B | 0 | 12 | 0 |
| C | 0 | 12 | 0 |
| D | 0 | 12 | 0 |
| Quadrant | Total seconds | Saturated seconds | Saturation percentage |
|---|---|---|---|
| A | 2839 | 35 | 1.232828% |
| B | 2839 | 40 | 1.408947% |
| C | 2839 | 35 | 1.232828% |
| D | 2839 | 35 | 1.232828% |
Noise dominated data is calculated using 1-second bins in cleaned event files. If a bin has >2000 counts, and if more than 50% of those come from <1% of pixels, then it is considered to be noise-dominated and hence unusable.
| Quadrant | # 1 sec bins | Bins with >0 counts | Bins with >2000 counts | High rate bins dominated by noise | Noise dominated (total time) | Noise dominated (detector-on time) | Marked lightcurve |
|---|---|---|---|---|---|---|---|
| A | 4029 | 2840 | 0 | 0 | 0.00% | 0.00% | 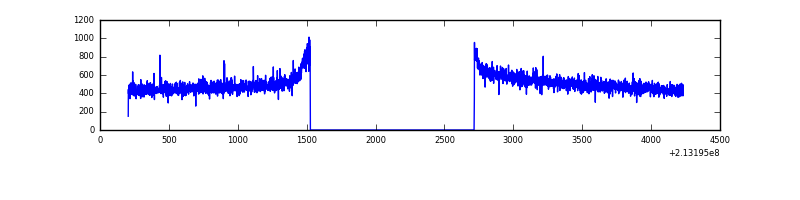 |
| B | 4029 | 2840 | 1 | 1 | 0.02% | 0.04% | 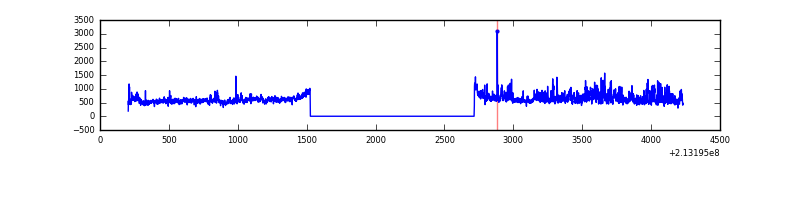 |
| C | 4029 | 2840 | 11 | 11 | 0.27% | 0.39% |  |
| D | 4029 | 2840 | 8 | 8 | 0.20% | 0.28% | 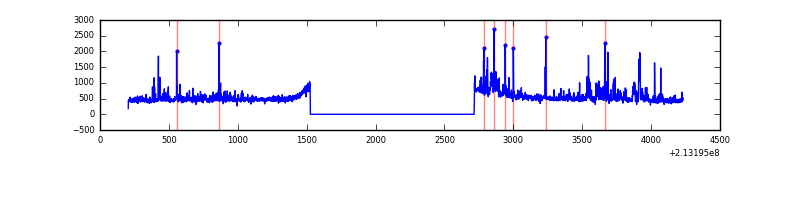 |
Top three noisy pixels from each quadrant. If the there are fewer than three noisy pixels in the level2.evt file, extra rows are filled as -1
| Pixel properties | Quadrant properties | ||||||
|---|---|---|---|---|---|---|---|
| Quadrant | DetID | PixID | Counts | Sigma | Mean | Median | Sigma |
| A | 12 | 194 | 3673 | 43.89 | 366 | 358 | 75.5 |
| A | 0 | 226 | 3668 | 43.83 | 366 | 358 | 75.5 |
| A | 13 | 6 | 3214 | 37.82 | 366 | 358 | 75.5 |
| B | 15 | 204 | 245904 | 3422.02 | 365 | 356 | 71.8 |
| B | 15 | 255 | 105365 | 1463.43 | 365 | 356 | 71.8 |
| B | 4 | 48 | 9811 | 131.77 | 365 | 356 | 71.8 |
| C | 9 | 247 | 156319 | 1906.44 | 347 | 349 | 81.8 |
| C | 1 | 16 | 114969 | 1401.01 | 347 | 349 | 81.8 |
| C | 1 | 241 | 50824 | 616.96 | 347 | 349 | 81.8 |
| D | 2 | 63 | 95949 | 1099.21 | 351 | 339 | 87.0 |
| D | 2 | 152 | 53443 | 610.53 | 351 | 339 | 87.0 |
| D | 2 | 136 | 40650 | 463.45 | 351 | 339 | 87.0 |
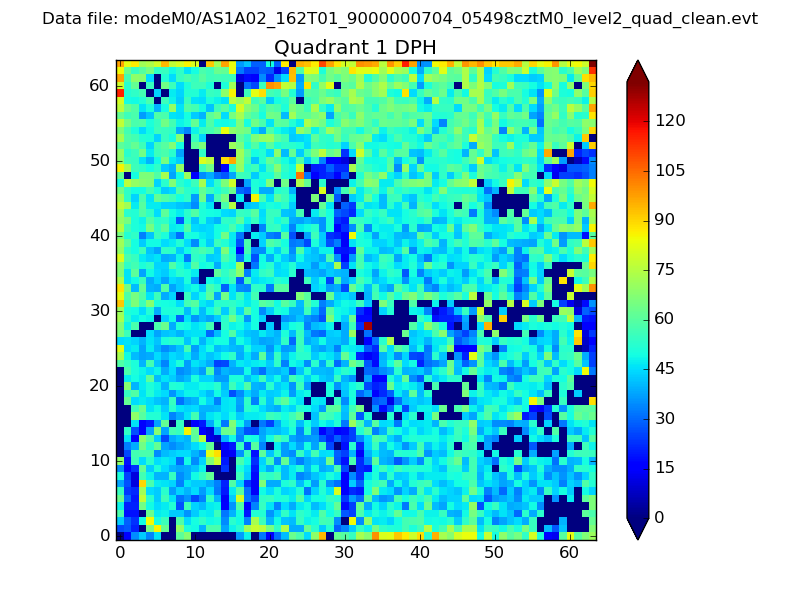
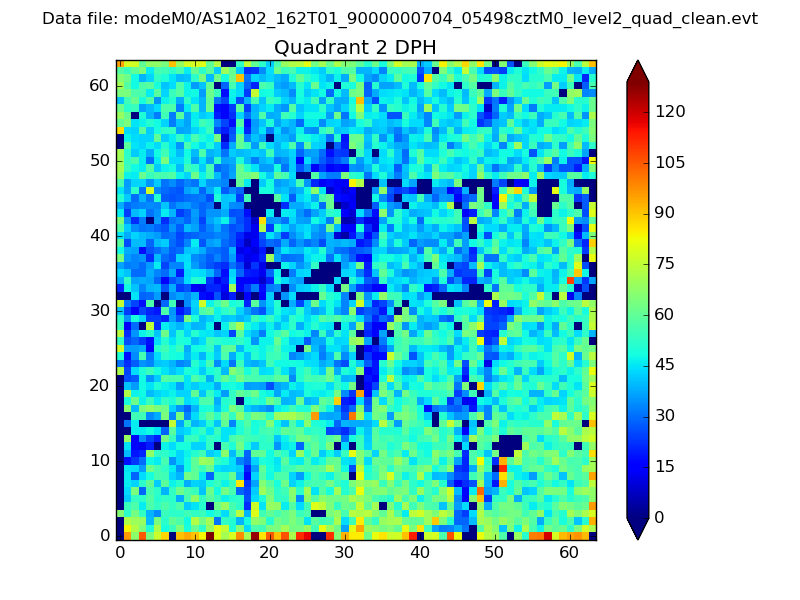
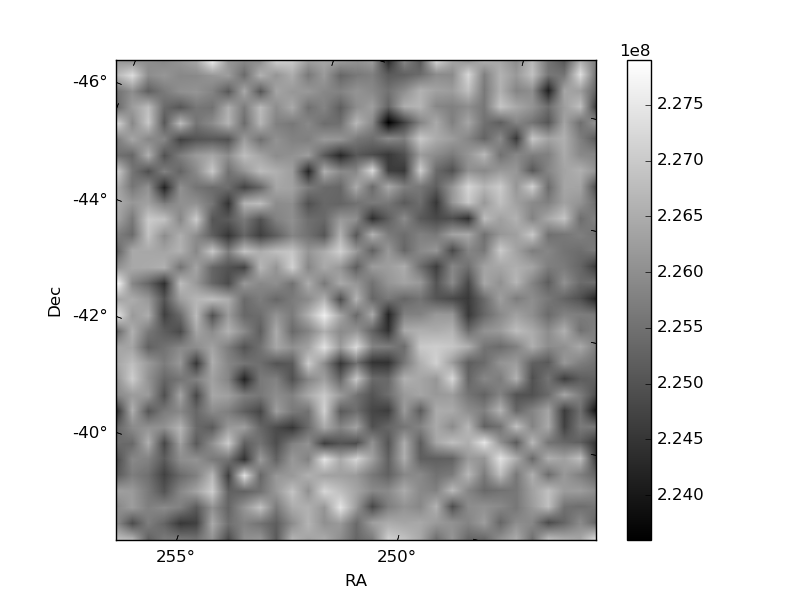
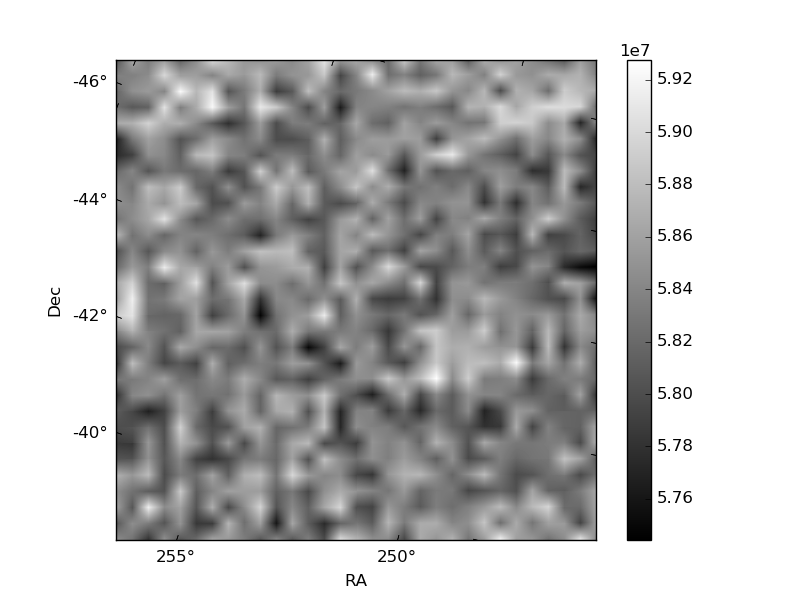
Histogram calculated using DETX and DETY for each event in the final _common_clean file
| Quadrant A | 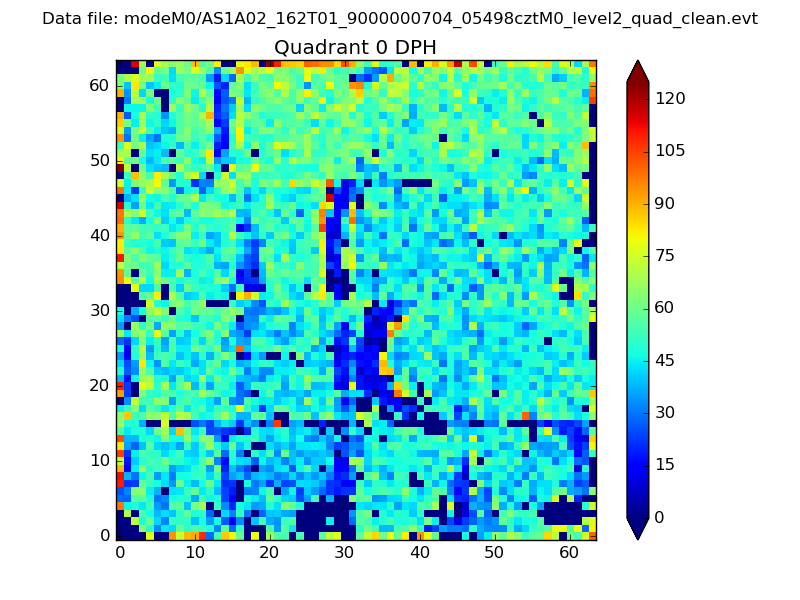 |
 |
Quadrant B |
|---|---|---|---|
| Quadrant D | 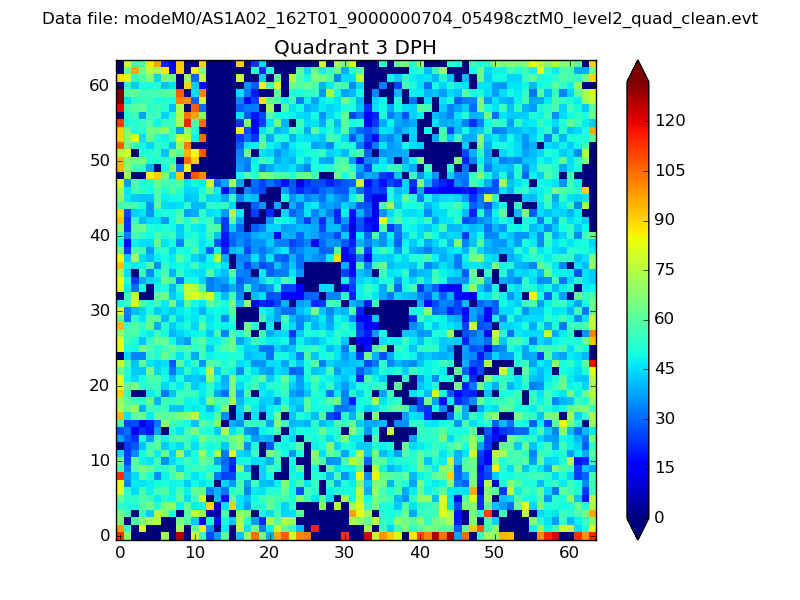 |
 |
Quadrant C |
| Plot type | Count rate plots | Images |
|---|---|---|
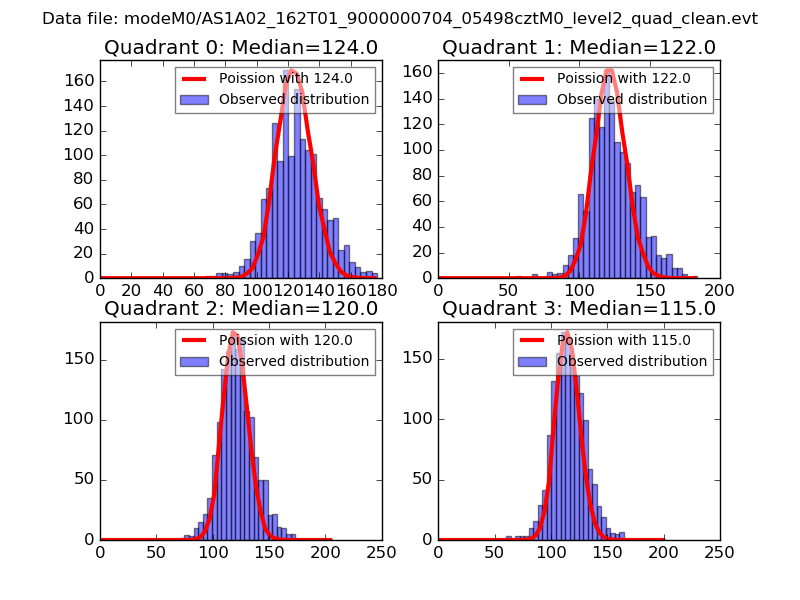
| Comparison with Poisson distribution Blue bars denote a histogram of data divided into 1 sec bins. Red curve is a Poisson curve with rate = median count rate of data. |
 |
 |
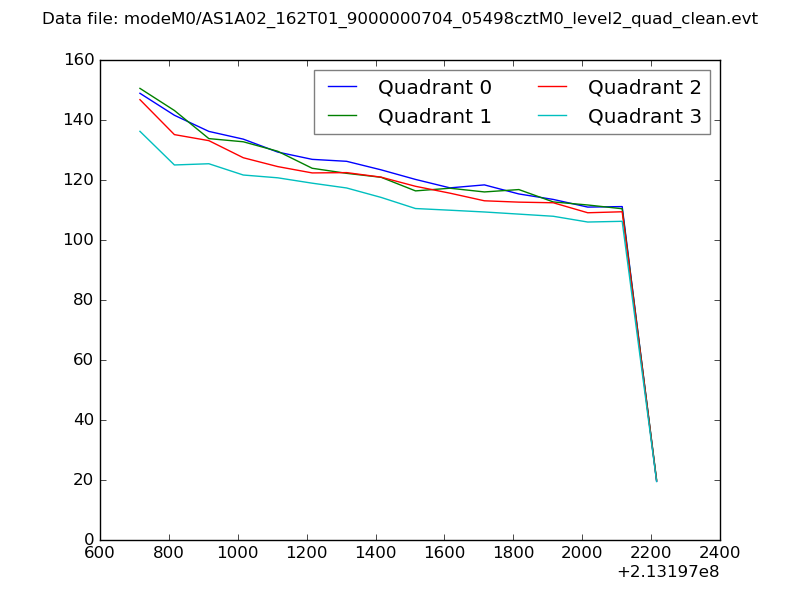
| Quadrant-wise count rates Data is divided into 100 sec bins |
 |
|
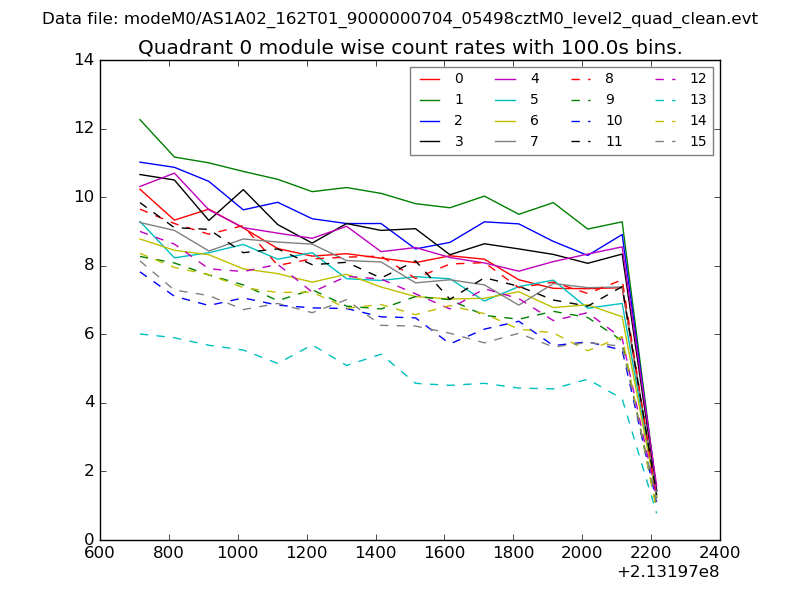
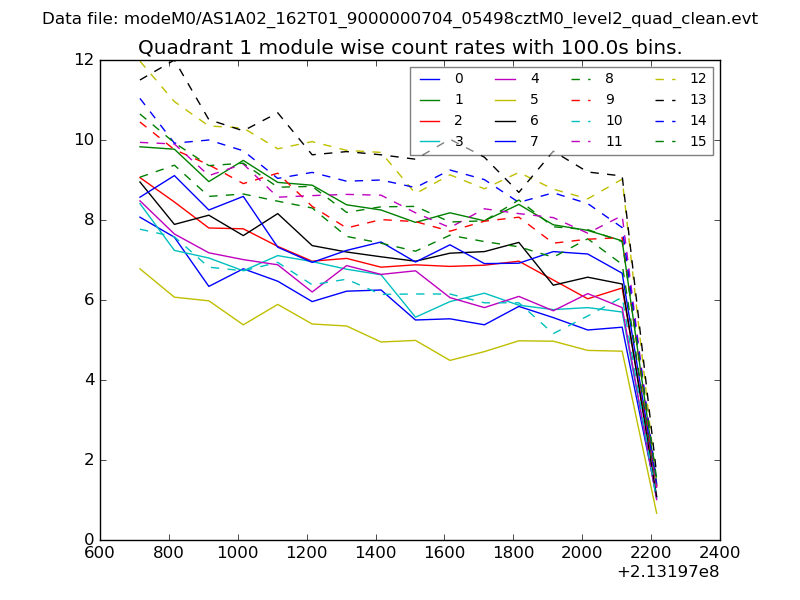
| Module-wise count rates for Quadrant A Data is divided into 100 sec bins |
 |
 |
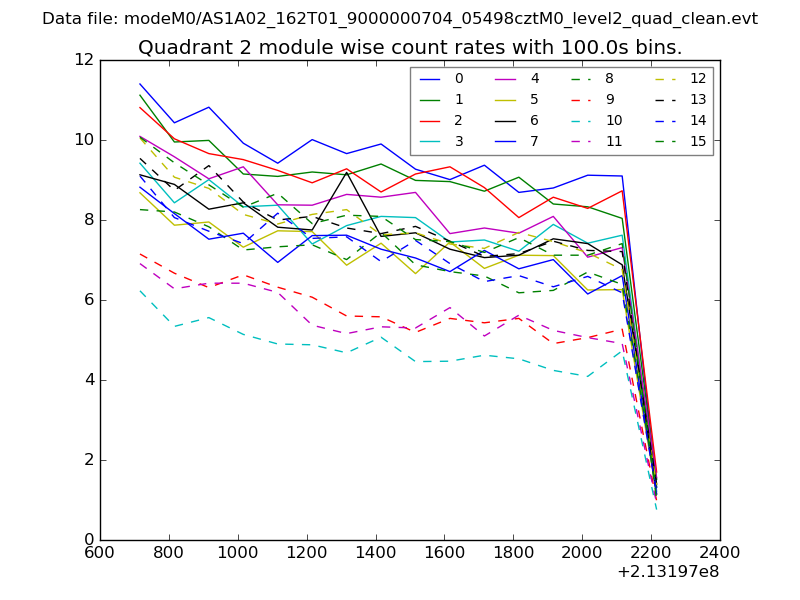
| Module-wise count rates for Quadrant B Data is divided into 100 sec bins |
 |
 |
| Module-wise count rates for Quadrant C Data is divided into 100 sec bins |
 |
 |
| Module-wise count rates for Quadrant D Data is divided into 100 sec bins |
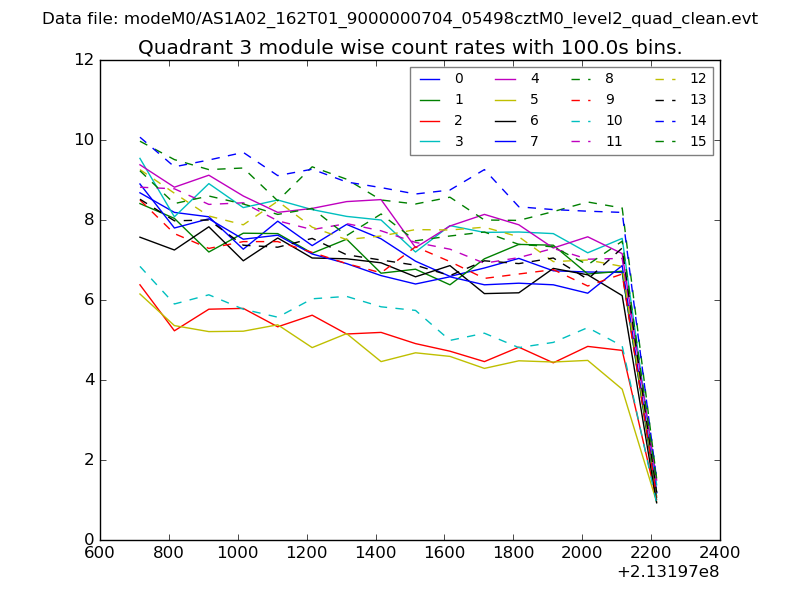 |
 |
| Parameter | Plot |
|---|---|
| CZT HV Monitor | 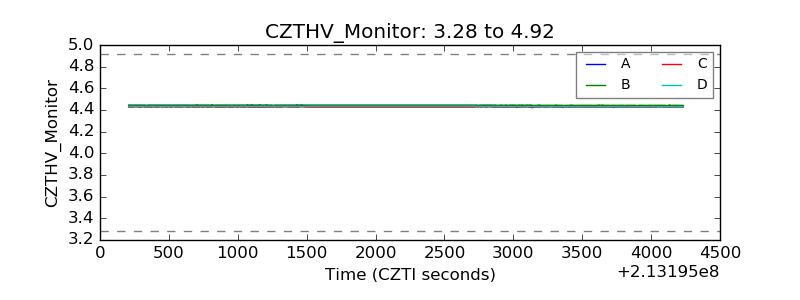 |
| D_VDD | 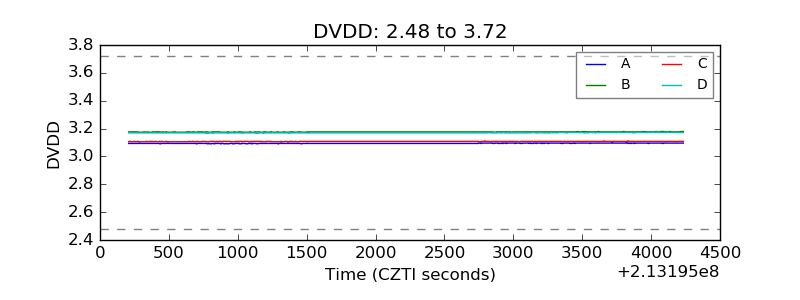 |
| Temperature 1 | 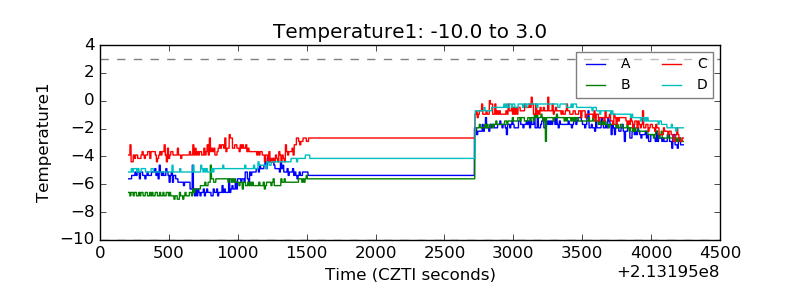 |
| Veto HV Monitor |  |
| Veto LLD | 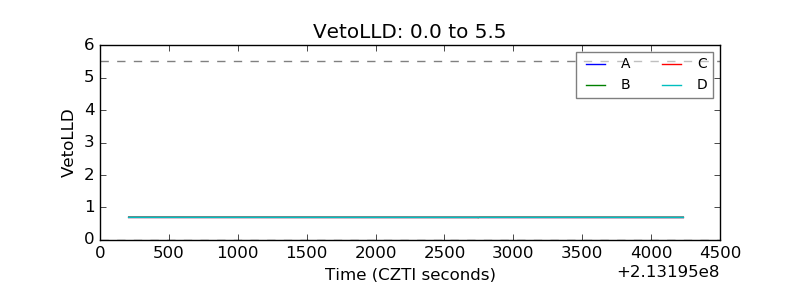 |
| Alpha Counter | 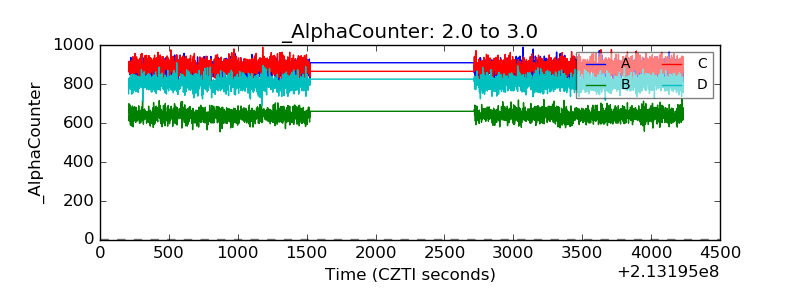 |
| _CPM_Rate | 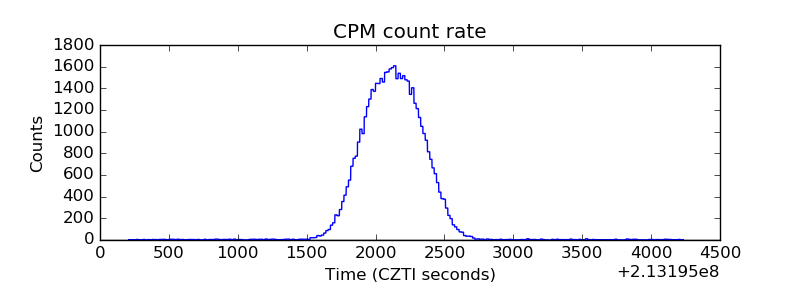 |
| CZT Counter | 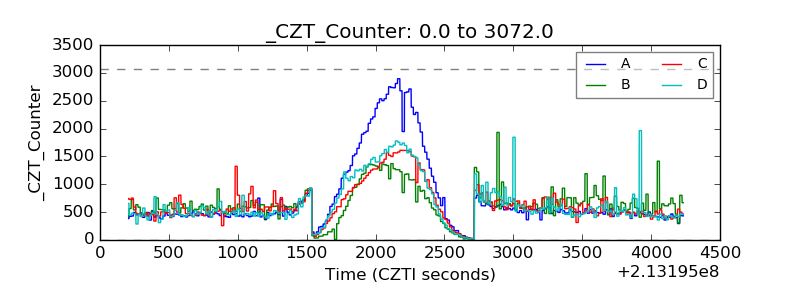 |
| +2.5 Volts monitor | 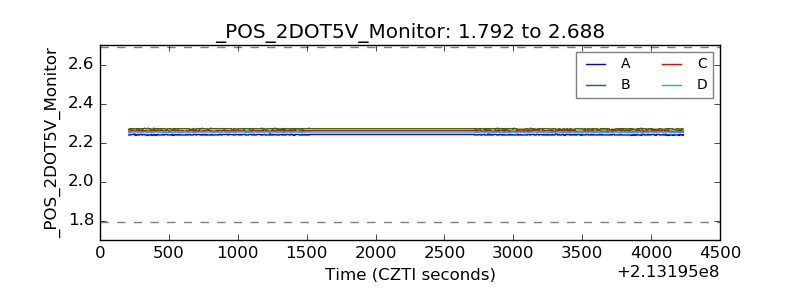 |
| +5 Volts monitor | 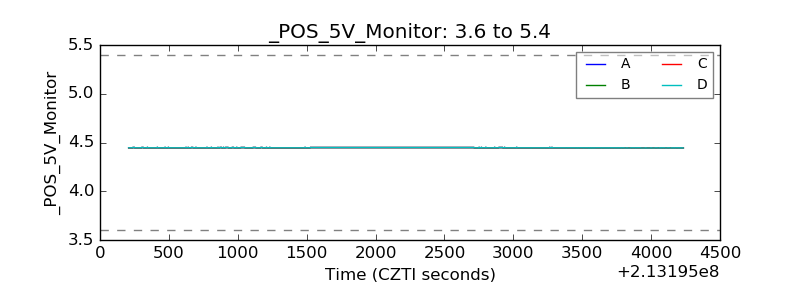 |
| _ROLL_ROT | 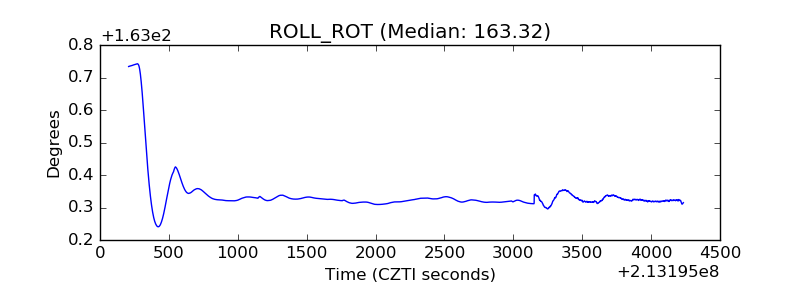 |
| _Roll_DEC | 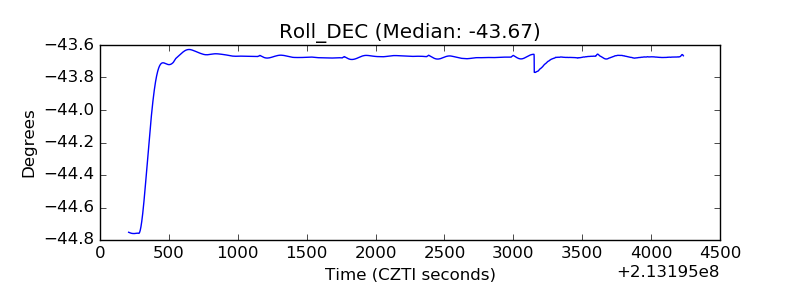 |
| _Roll_RA | 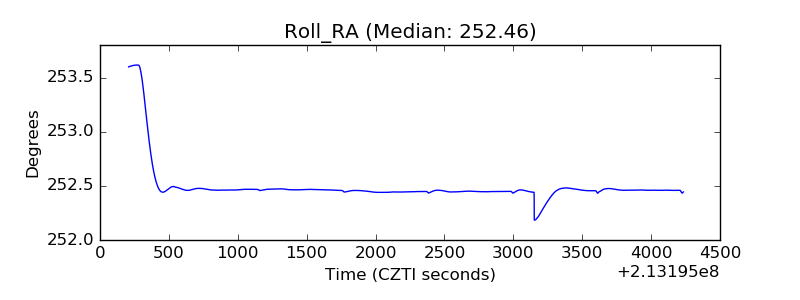 |
| Veto Counter | 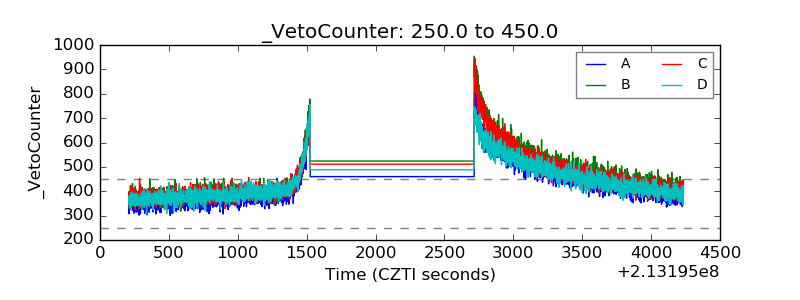 |