| Param | Original file | Final file |
|---|---|---|
| Filename | modeM0/AS1A02_162T01_9000000704_05500cztM0_level2.evt | modeM0/AS1A02_162T01_9000000704_05500cztM0_level2_quad_clean.evt |
| Size (bytes) | 468,498,240 | 66,804,480 |
| Size | 446.8 MB | 63.7 MB |
| Events in quadrant A | 3,250,010 | 409,642 |
| Events in quadrant B | 3,014,237 | 423,397 |
| Events in quadrant C | 3,319,841 | 408,507 |
| Events in quadrant D | 4,217,492 | 382,502 |
| Mode M0 | |||
|---|---|---|---|
| Quadrant | BADHDUFLAG | Total packets | Discarded packets |
| A | 0 | 13629 | 2 |
| B | 0 | 12700 | 1 |
| C | 0 | 13712 | 1 |
| D | 0 | 16444 | 1 |
| Mode SS | |||
|---|---|---|---|
| Quadrant | BADHDUFLAG | Total packets | Discarded packets |
| A | 0 | 116 | 0 |
| B | 0 | 116 | 0 |
| C | 0 | 116 | 0 |
| D | 0 | 116 | 0 |
| Mode M9 | |||
|---|---|---|---|
| Quadrant | BADHDUFLAG | Total packets | Discarded packets |
| A | 0 | 13 | 0 |
| B | 0 | 13 | 0 |
| C | 0 | 13 | 0 |
| D | 0 | 13 | 0 |
| Quadrant | Total seconds | Saturated seconds | Saturation percentage |
|---|---|---|---|
| A | 5699 | 189 | 3.316371% |
| B | 5699 | 64 | 1.123004% |
| C | 5699 | 157 | 2.754869% |
| D | 5699 | 258 | 4.527110% |
Noise dominated data is calculated using 1-second bins in cleaned event files. If a bin has >2000 counts, and if more than 50% of those come from <1% of pixels, then it is considered to be noise-dominated and hence unusable.
| Quadrant | # 1 sec bins | Bins with >0 counts | Bins with >2000 counts | High rate bins dominated by noise | Noise dominated (total time) | Noise dominated (detector-on time) | Marked lightcurve |
|---|---|---|---|---|---|---|---|
| A | 6979 | 5700 | 129 | 129 | 1.85% | 2.26% | 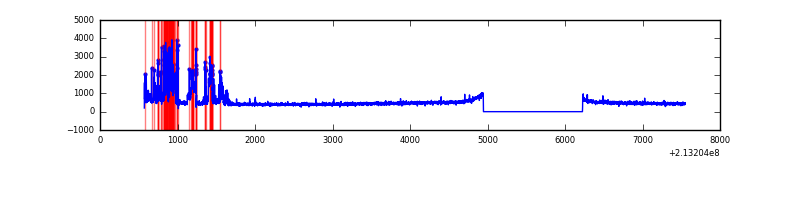 |
| B | 6979 | 5700 | 9 | 9 | 0.13% | 0.16% | 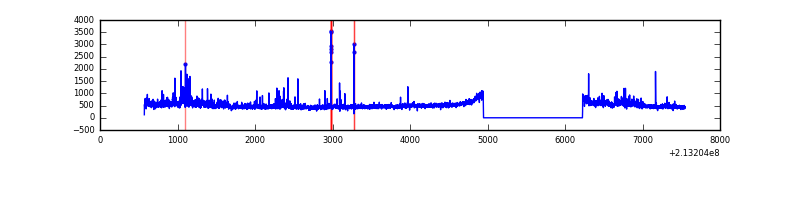 |
| C | 6979 | 5700 | 104 | 104 | 1.49% | 1.82% | 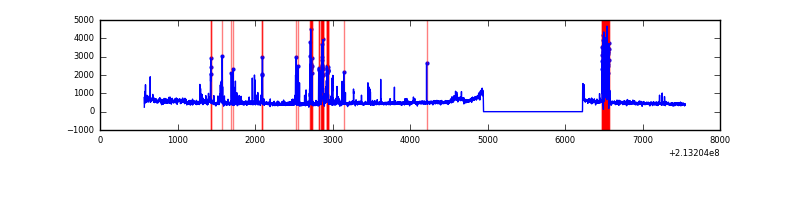 |
| D | 6979 | 5700 | 218 | 218 | 3.12% | 3.82% | 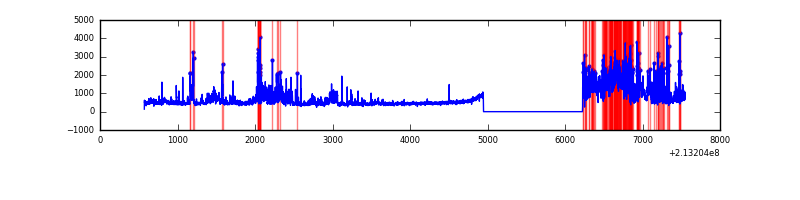 |
Top three noisy pixels from each quadrant. If the there are fewer than three noisy pixels in the level2.evt file, extra rows are filled as -1
| Pixel properties | Quadrant properties | ||||||
|---|---|---|---|---|---|---|---|
| Quadrant | DetID | PixID | Counts | Sigma | Mean | Median | Sigma |
| A | 0 | 50 | 665197 | 4881.29 | 667 | 653 | 136.1 |
| A | 13 | 6 | 7623 | 51.2 | 667 | 653 | 136.1 |
| A | 12 | 194 | 6686 | 44.31 | 667 | 653 | 136.1 |
| B | 15 | 204 | 144730 | 1111.22 | 683 | 668 | 129.6 |
| B | 0 | 219 | 104299 | 799.36 | 683 | 668 | 129.6 |
| B | 4 | 48 | 72956 | 557.59 | 683 | 668 | 129.6 |
| C | 9 | 247 | 611928 | 4125.84 | 638 | 641 | 148.2 |
| C | 1 | 16 | 163815 | 1101.33 | 638 | 641 | 148.2 |
| C | 1 | 241 | 30379 | 200.71 | 638 | 641 | 148.2 |
| D | 2 | 63 | 1149346 | 7344.15 | 634 | 613 | 156.4 |
| D | 2 | 136 | 394358 | 2517.31 | 634 | 613 | 156.4 |
| D | 2 | 33 | 98944 | 628.65 | 634 | 613 | 156.4 |
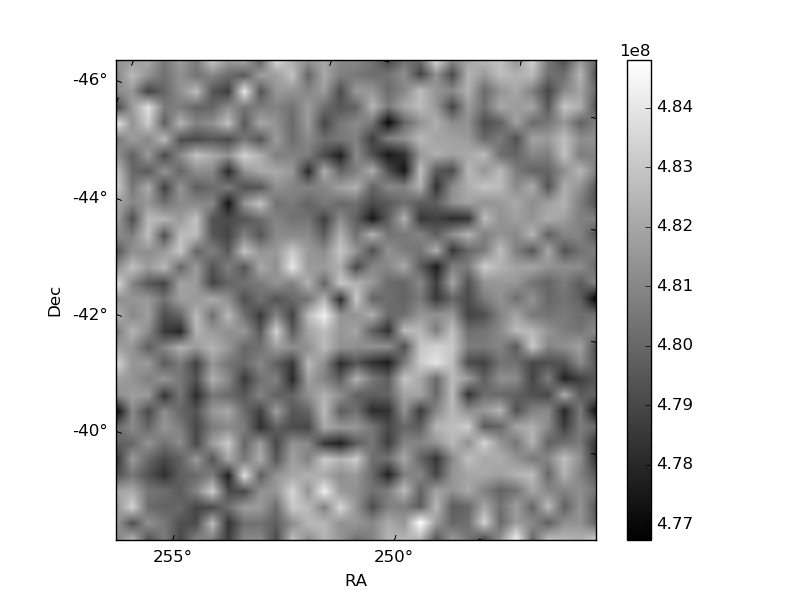
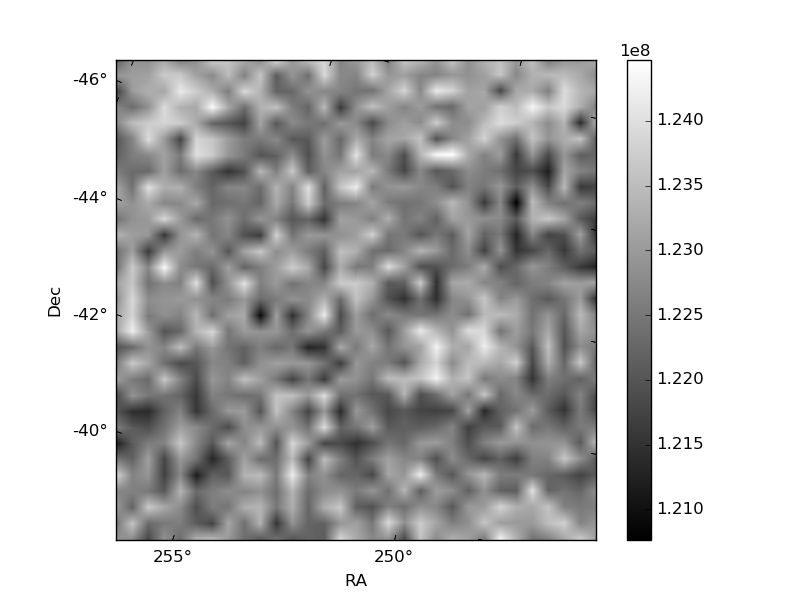
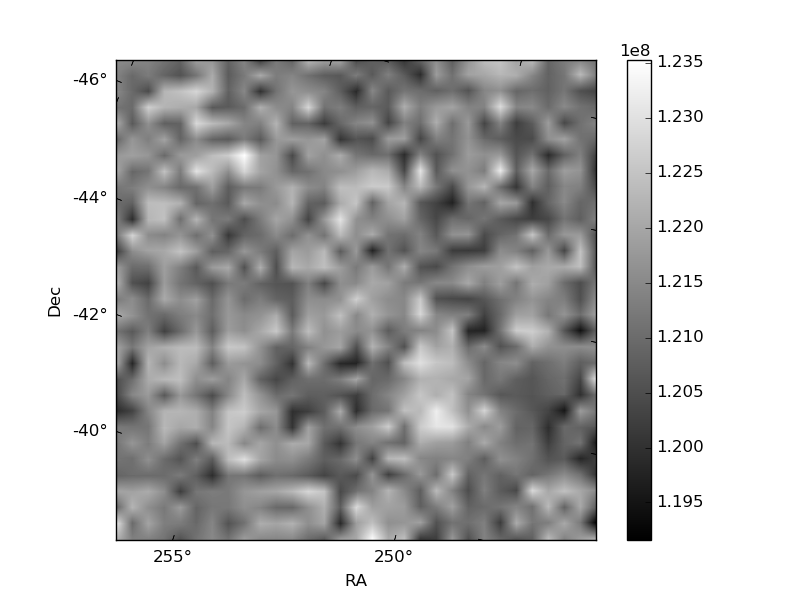
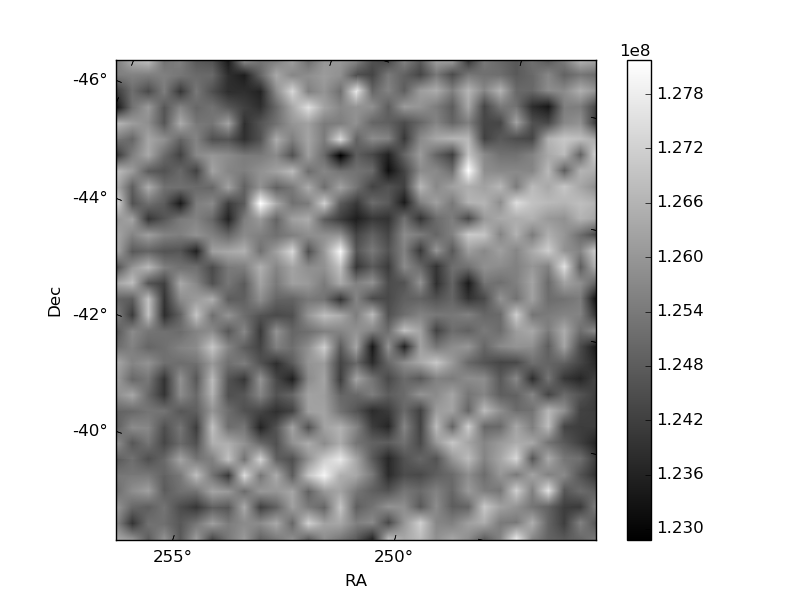
Histogram calculated using DETX and DETY for each event in the final _common_clean file
| Quadrant A | 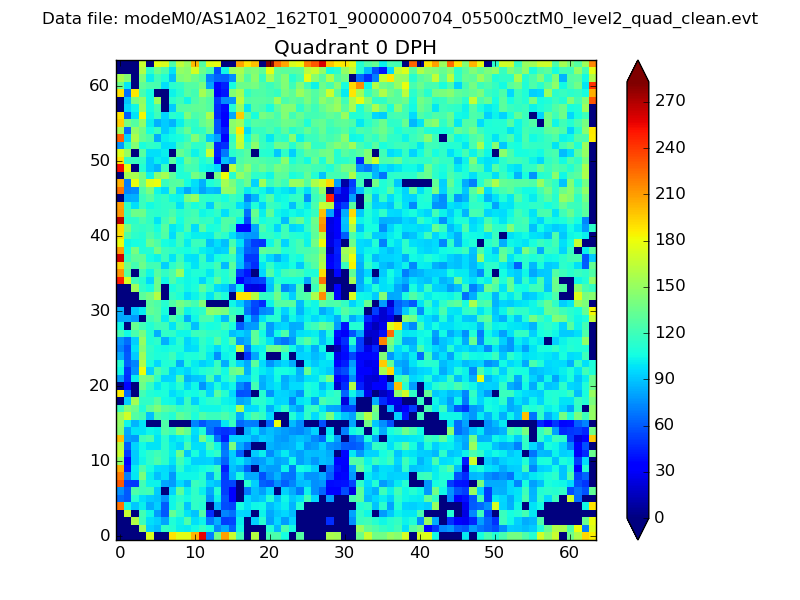 |
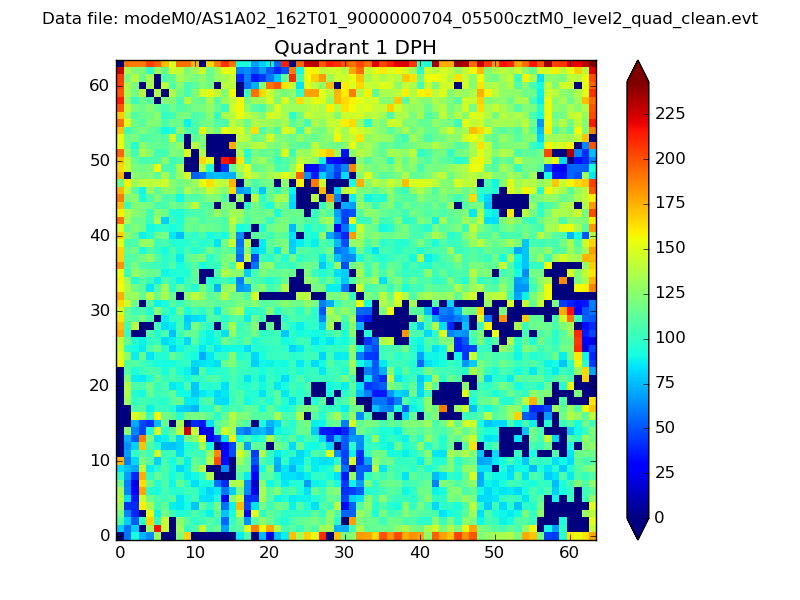 |
Quadrant B |
|---|---|---|---|
| Quadrant D | 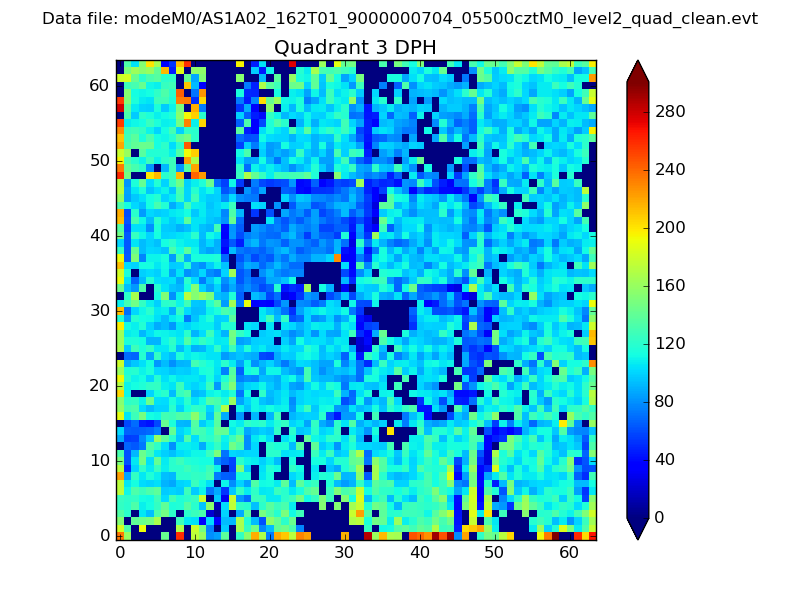 |
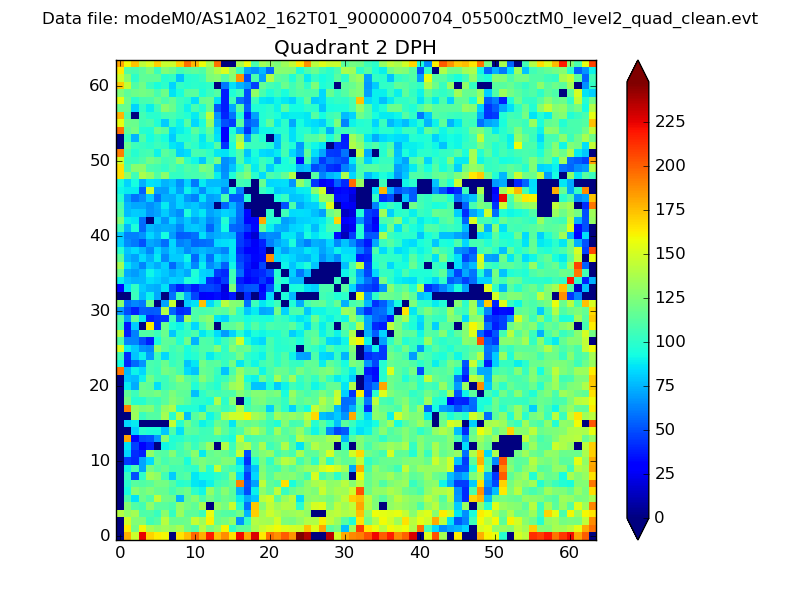 |
Quadrant C |
| Plot type | Count rate plots | Images |
|---|---|---|
| Comparison with Poisson distribution Blue bars denote a histogram of data divided into 1 sec bins. Red curve is a Poisson curve with rate = median count rate of data. |
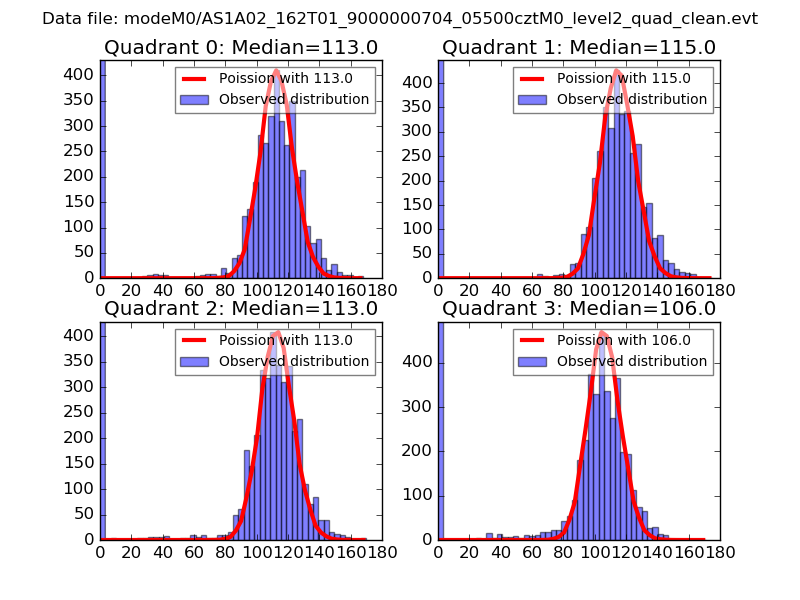 |
 |
| Quadrant-wise count rates Data is divided into 100 sec bins |
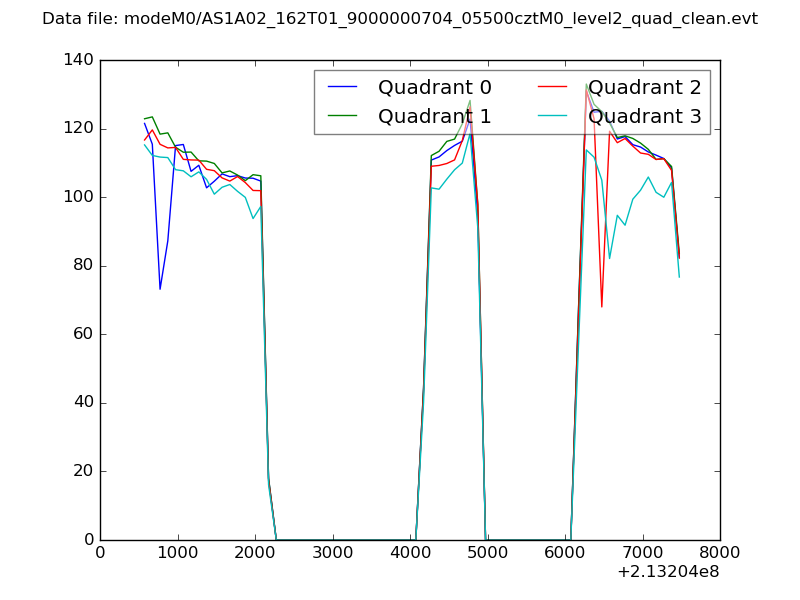 |
|
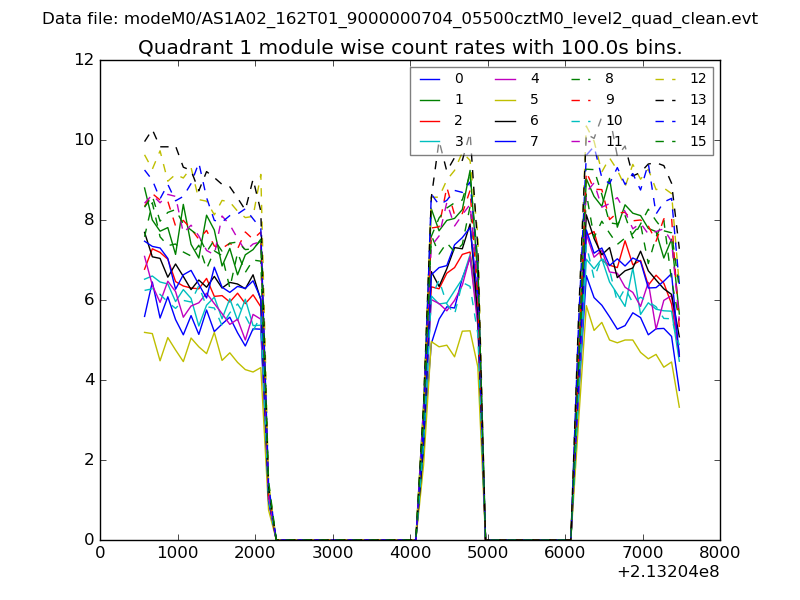
| Module-wise count rates for Quadrant A Data is divided into 100 sec bins |
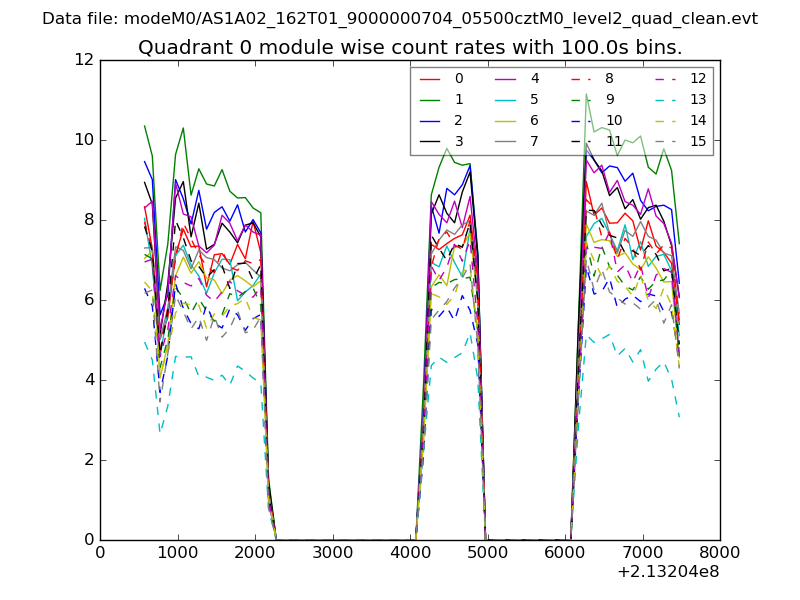 |
 |
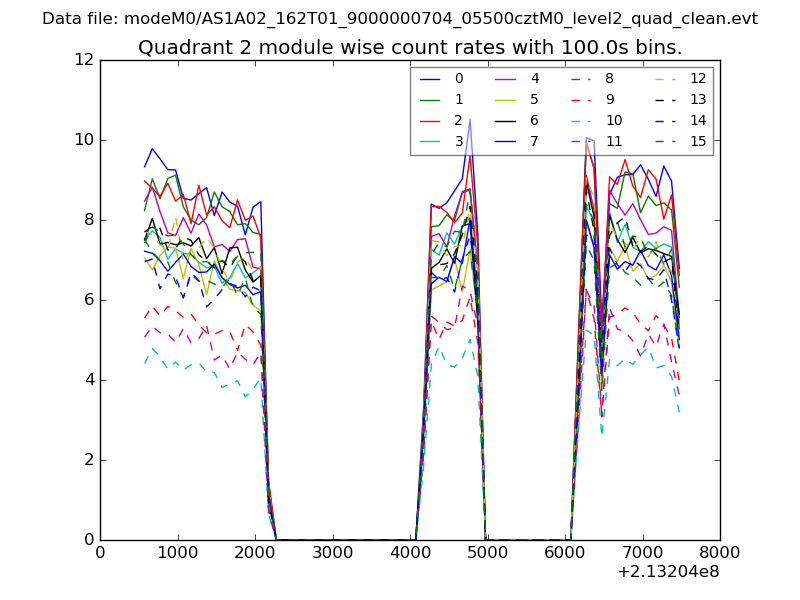
| Module-wise count rates for Quadrant B Data is divided into 100 sec bins |
 |
 |
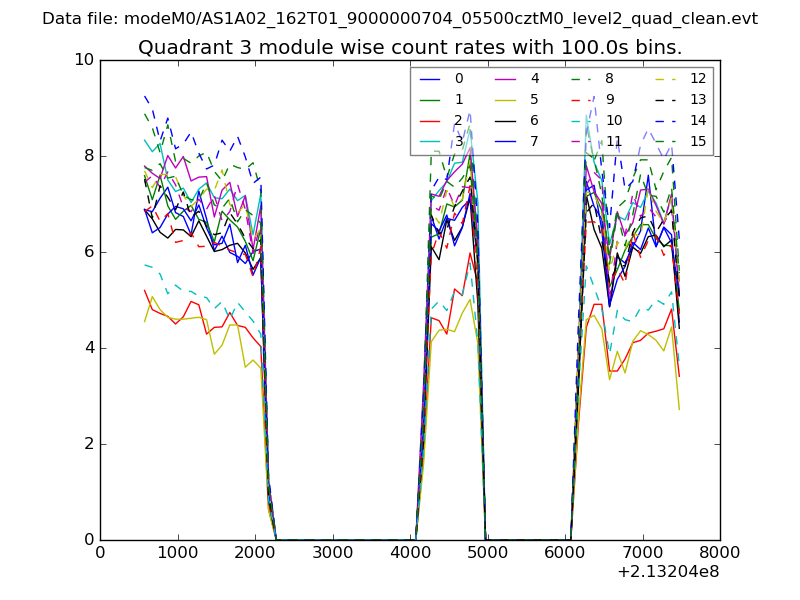
| Module-wise count rates for Quadrant C Data is divided into 100 sec bins |
 |
 |
| Module-wise count rates for Quadrant D Data is divided into 100 sec bins |
 |
 |
| Parameter | Plot |
|---|---|
| CZT HV Monitor | 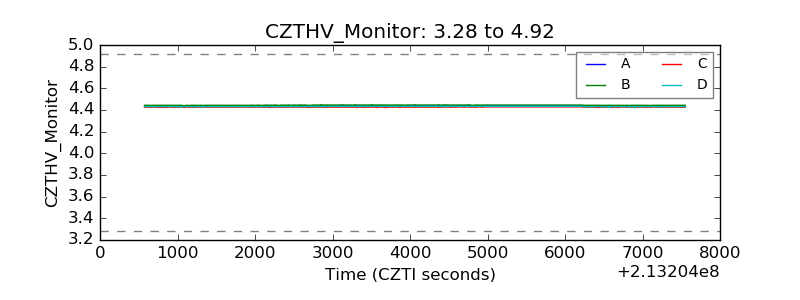 |
| D_VDD |  |
| Temperature 1 | 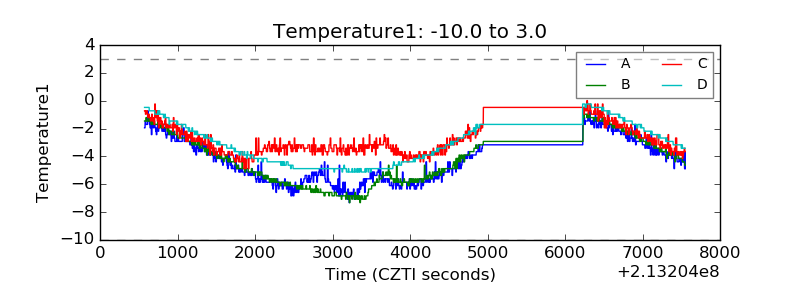 |
| Veto HV Monitor |  |
| Veto LLD | 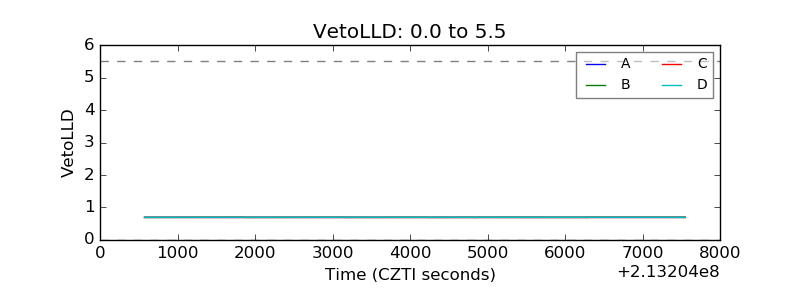 |
| Alpha Counter | 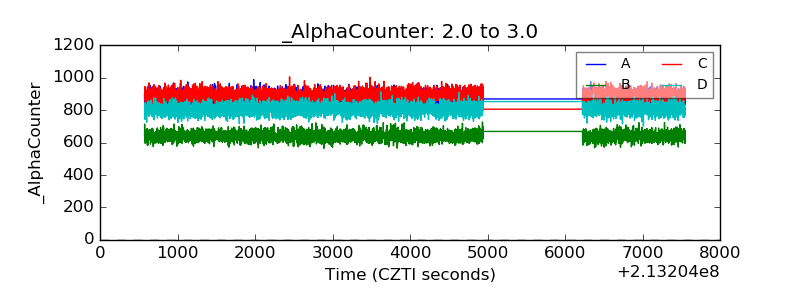 |
| _CPM_Rate | 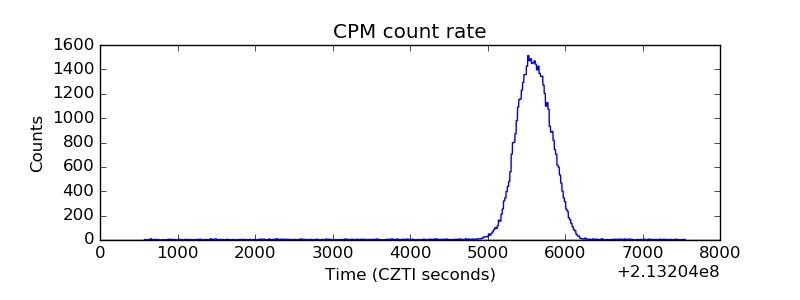 |
| CZT Counter | 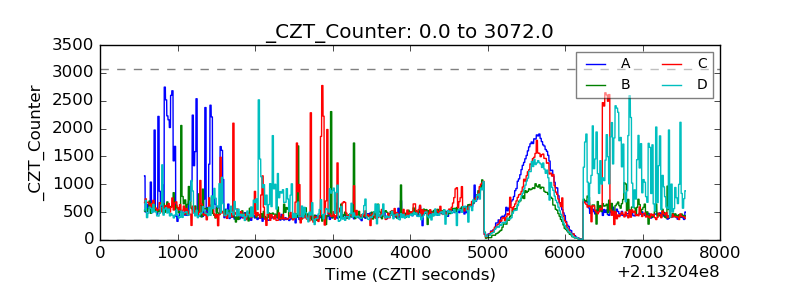 |
| +2.5 Volts monitor |  |
| +5 Volts monitor |  |
| _ROLL_ROT | 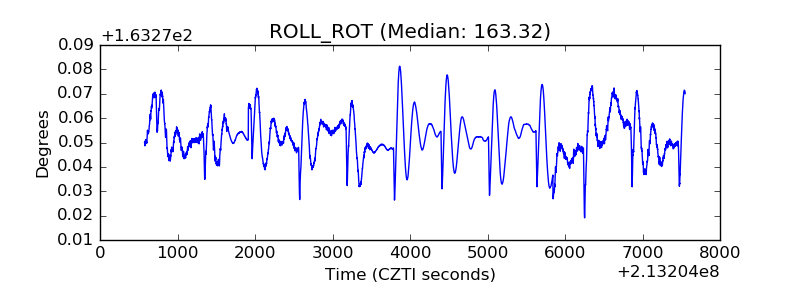 |
| _Roll_DEC | 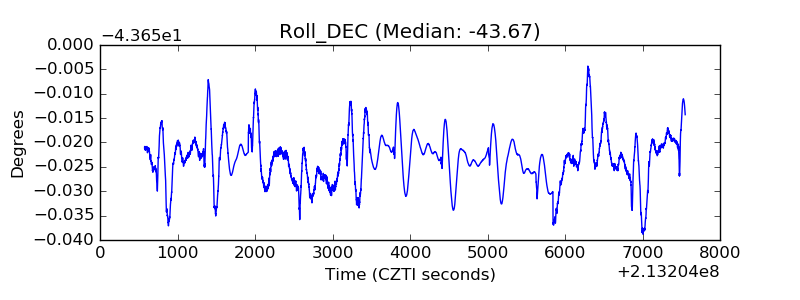 |
| _Roll_RA | 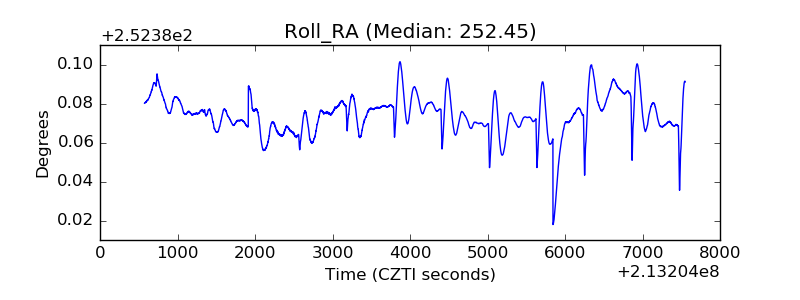 |
| Veto Counter | 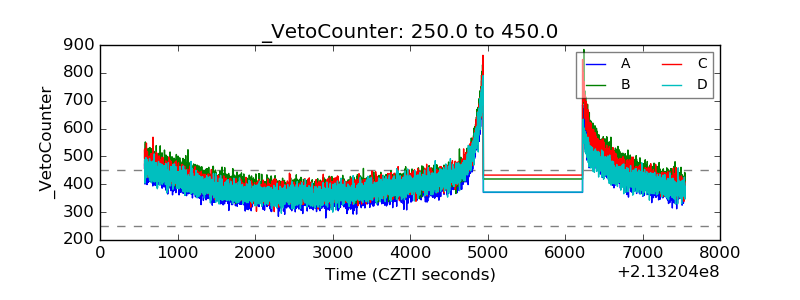 |