| Param | Original file | Final file |
|---|---|---|
| Filename | modeM0/AS1A02_162T01_9000000704_05502cztM0_level2.evt | modeM0/AS1A02_162T01_9000000704_05502cztM0_level2_quad_clean.evt |
| Size (bytes) | 678,994,560 | 74,589,120 |
| Size | 647.5 MB | 71.1 MB |
| Events in quadrant A | 3,016,377 | 469,055 |
| Events in quadrant B | 4,549,432 | 463,266 |
| Events in quadrant C | 6,964,672 | 429,486 |
| Events in quadrant D | 5,581,923 | 431,102 |
| Mode M0 | |||
|---|---|---|---|
| Quadrant | BADHDUFLAG | Total packets | Discarded packets |
| A | 0 | 13755 | 3 |
| B | 0 | 17968 | 4 |
| C | 0 | 25275 | 4 |
| D | 0 | 21075 | 8 |
| Mode SS | |||
|---|---|---|---|
| Quadrant | BADHDUFLAG | Total packets | Discarded packets |
| A | 0 | 134 | 0 |
| B | 0 | 134 | 0 |
| C | 0 | 134 | 0 |
| D | 0 | 134 | 0 |
| Mode M9 | |||
|---|---|---|---|
| Quadrant | BADHDUFLAG | Total packets | Discarded packets |
| A | 0 | 12 | 0 |
| B | 0 | 12 | 0 |
| C | 0 | 12 | 0 |
| D | 0 | 13 | 0 |
| Quadrant | Total seconds | Saturated seconds | Saturation percentage |
|---|---|---|---|
| A | 6677 | 59 | 0.883630% |
| B | 6676 | 229 | 3.430198% |
| C | 6676 | 1440 | 21.569802% |
| D | 6675 | 323 | 4.838951% |
Noise dominated data is calculated using 1-second bins in cleaned event files. If a bin has >2000 counts, and if more than 50% of those come from <1% of pixels, then it is considered to be noise-dominated and hence unusable.
| Quadrant | # 1 sec bins | Bins with >0 counts | Bins with >2000 counts | High rate bins dominated by noise | Noise dominated (total time) | Noise dominated (detector-on time) | Marked lightcurve |
|---|---|---|---|---|---|---|---|
| A | 7652 | 6678 | 6 | 6 | 0.08% | 0.09% | 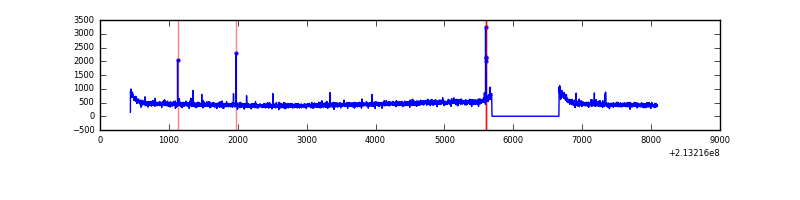 |
| B | 7652 | 6678 | 53 | 53 | 0.69% | 0.79% | 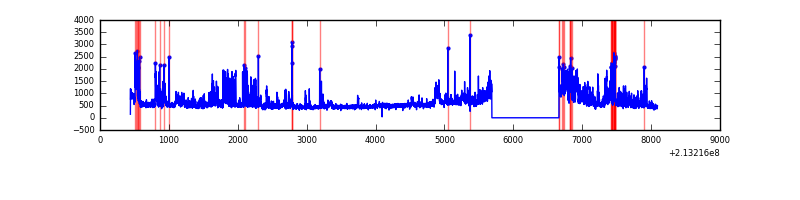 |
| C | 7652 | 6677 | 1206 | 1206 | 15.76% | 18.06% | 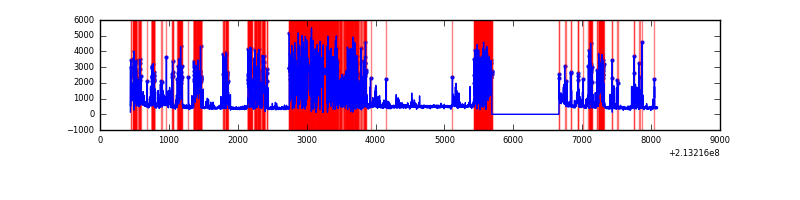 |
| D | 7652 | 6678 | 202 | 202 | 2.64% | 3.02% | 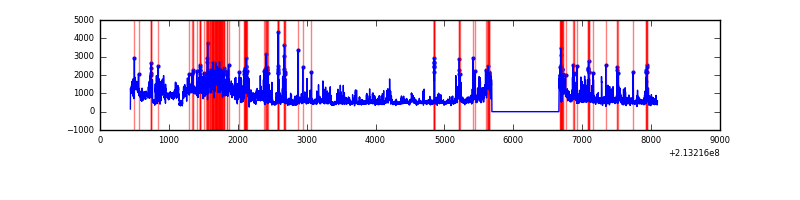 |
Top three noisy pixels from each quadrant. If the there are fewer than three noisy pixels in the level2.evt file, extra rows are filled as -1
| Pixel properties | Quadrant properties | ||||||
|---|---|---|---|---|---|---|---|
| Quadrant | DetID | PixID | Counts | Sigma | Mean | Median | Sigma |
| A | 15 | 174 | 18850 | 112.6 | 775 | 759 | 160.7 |
| A | 0 | 50 | 14518 | 85.64 | 775 | 759 | 160.7 |
| A | 0 | 226 | 7679 | 43.07 | 775 | 759 | 160.7 |
| B | 15 | 255 | 1145758 | 7700.76 | 779 | 761 | 148.7 |
| B | 15 | 204 | 166155 | 1112.37 | 779 | 761 | 148.7 |
| B | 0 | 219 | 74705 | 497.32 | 779 | 761 | 148.7 |
| C | 1 | 241 | 2695391 | 17789.51 | 655 | 658 | 151.5 |
| C | 9 | 247 | 1645911 | 10861.28 | 655 | 658 | 151.5 |
| C | 1 | 16 | 59727 | 389.95 | 655 | 658 | 151.5 |
| D | 2 | 63 | 2190115 | 12215.73 | 730 | 708 | 179.2 |
| D | 2 | 152 | 212523 | 1181.81 | 730 | 708 | 179.2 |
| D | 2 | 136 | 116089 | 643.76 | 730 | 708 | 179.2 |
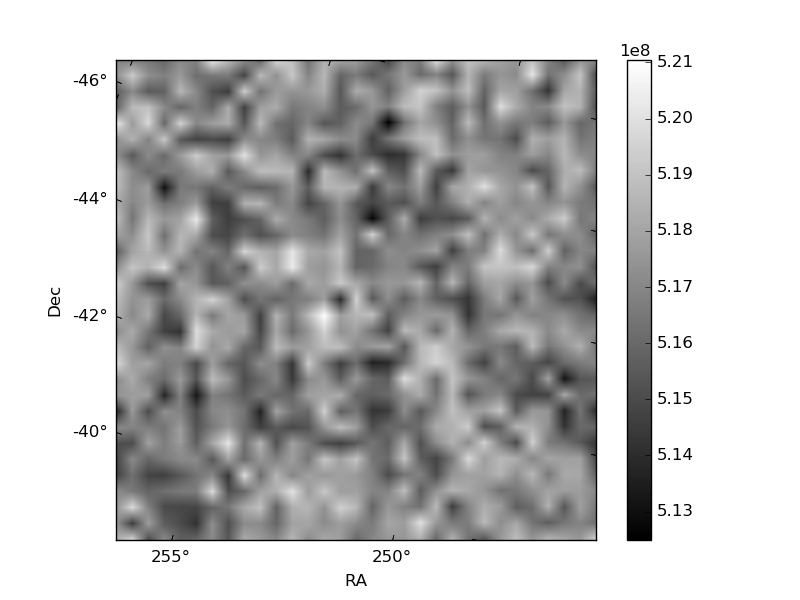
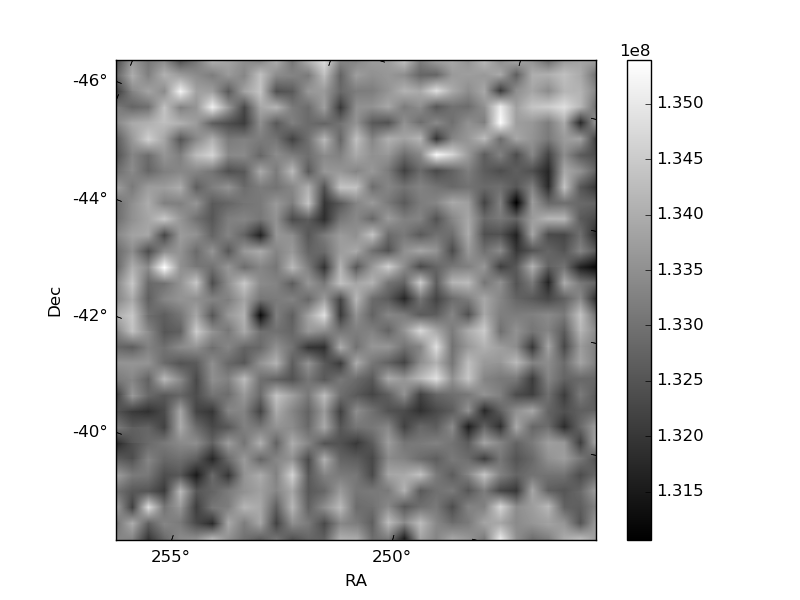
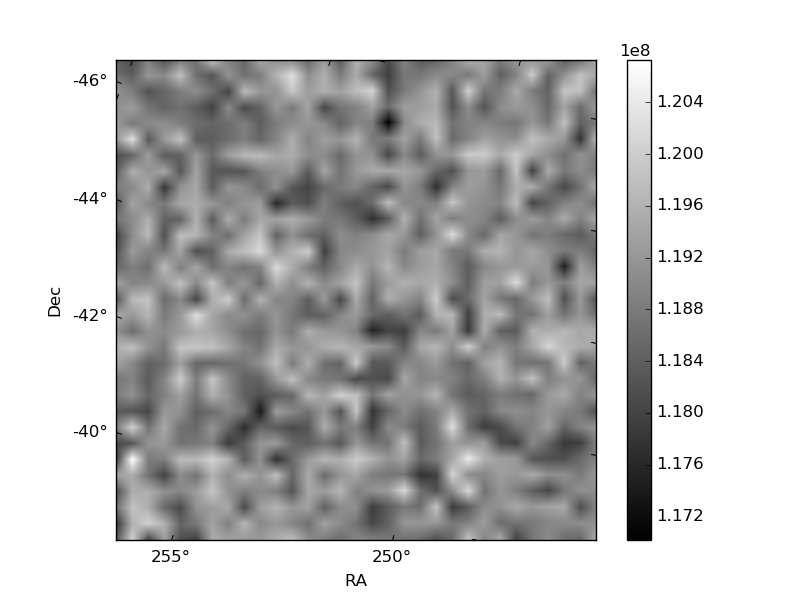
Histogram calculated using DETX and DETY for each event in the final _common_clean file
| Quadrant A | 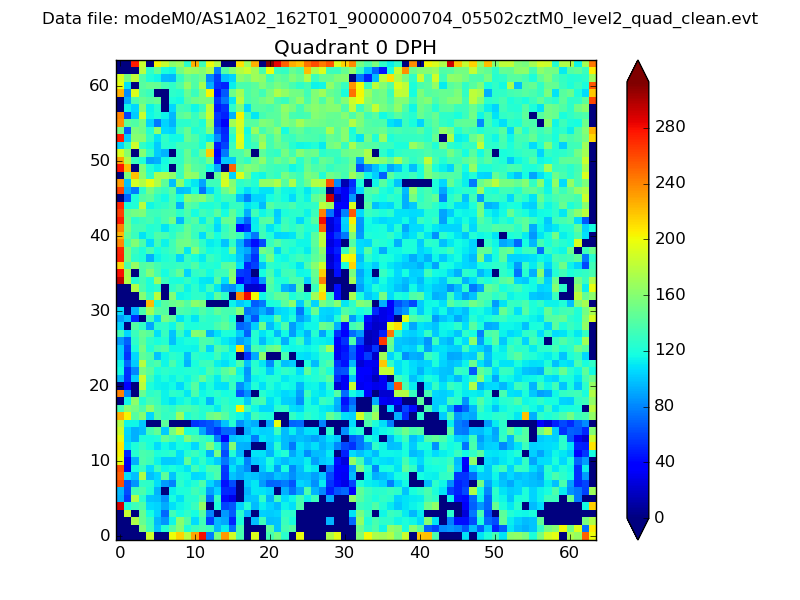 |
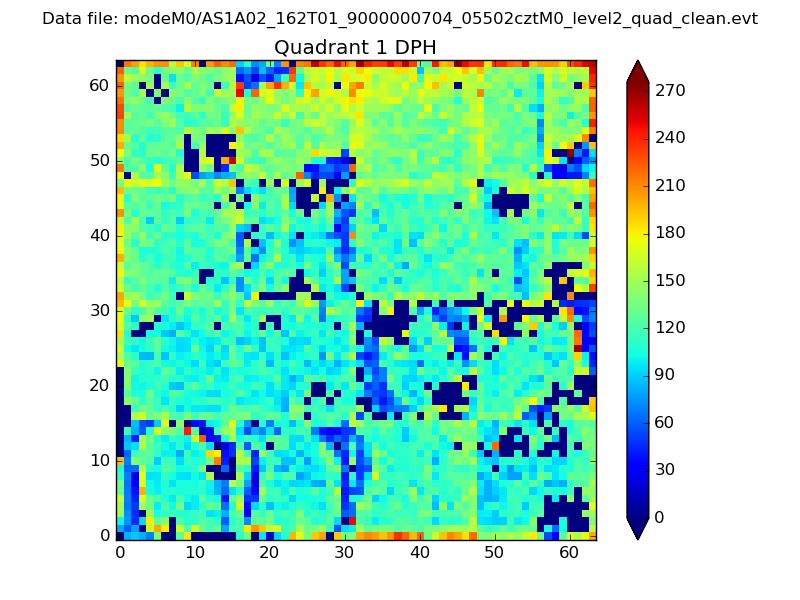 |
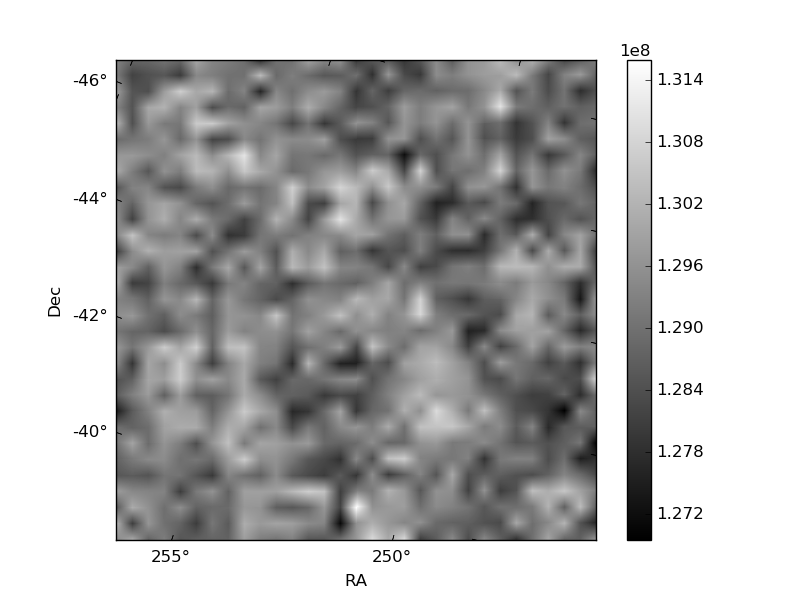
Quadrant B |
|---|---|---|---|
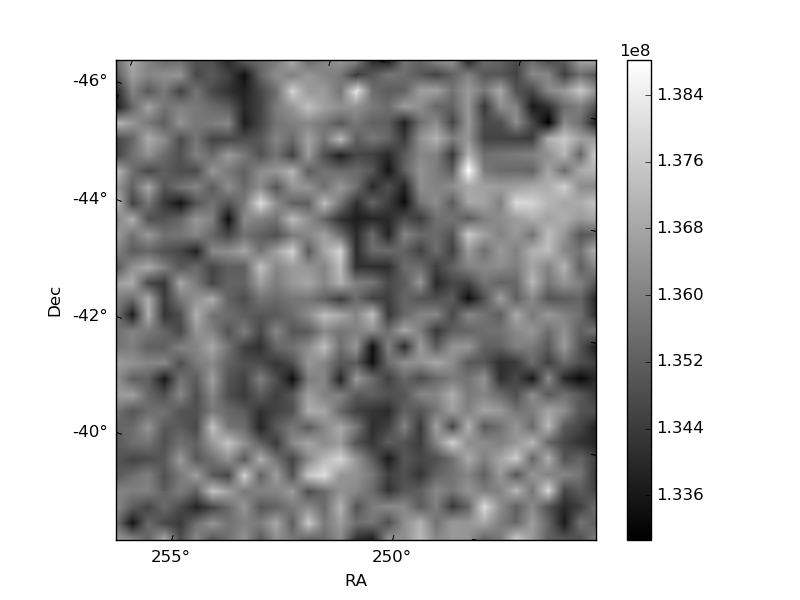
| Quadrant D | 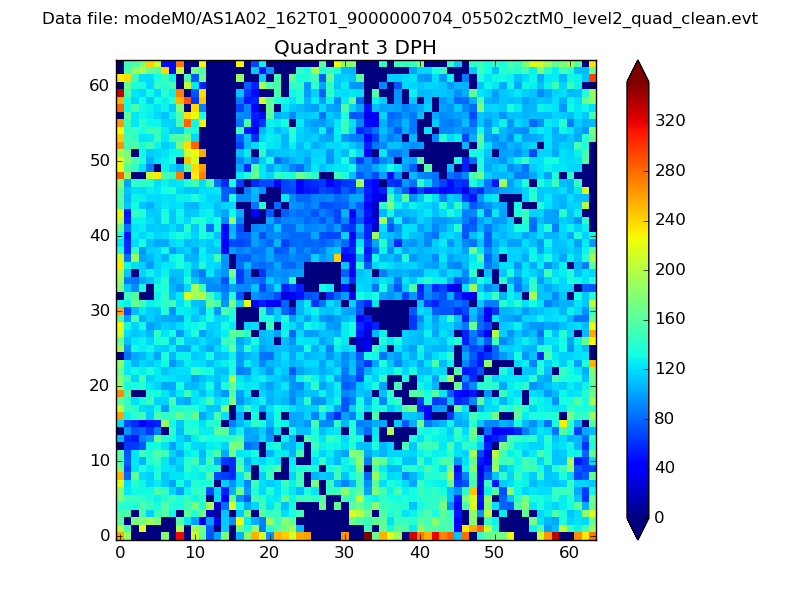 |
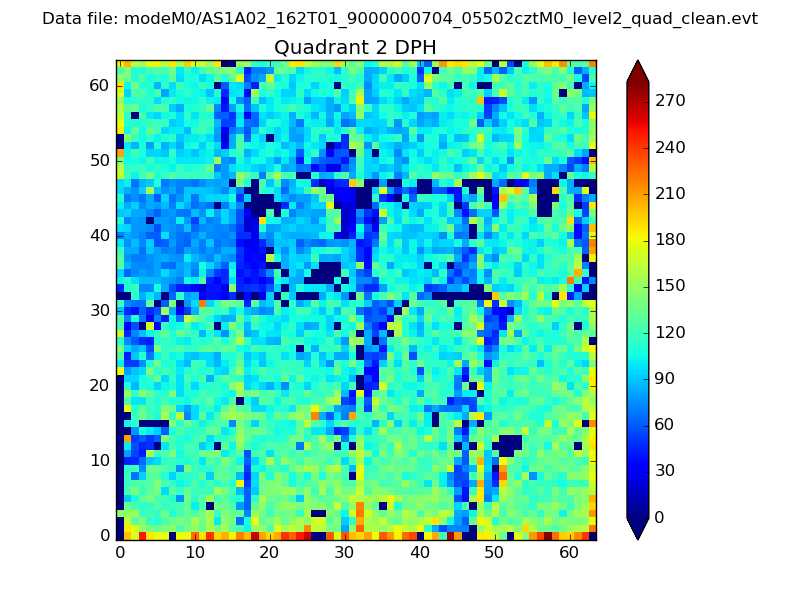 |
Quadrant C |
| Plot type | Count rate plots | Images |
|---|---|---|
| Comparison with Poisson distribution Blue bars denote a histogram of data divided into 1 sec bins. Red curve is a Poisson curve with rate = median count rate of data. |
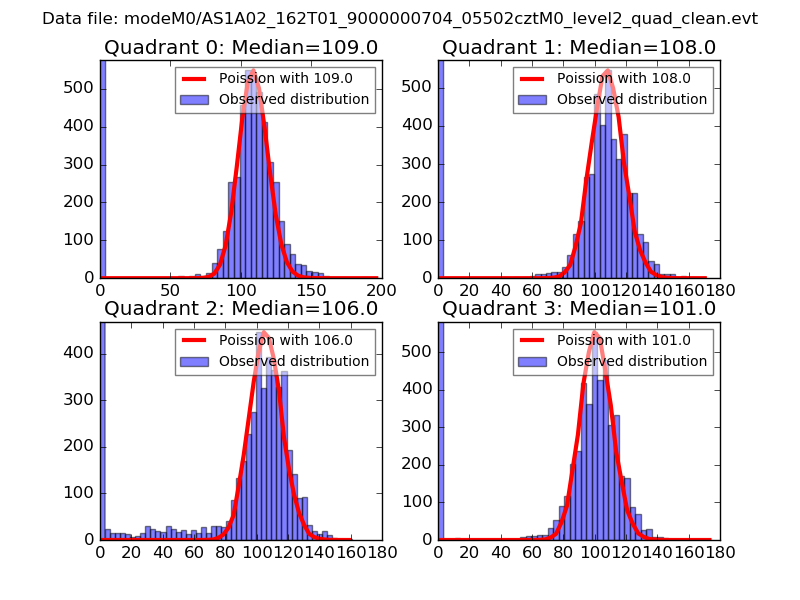 |
 |
| Quadrant-wise count rates Data is divided into 100 sec bins |
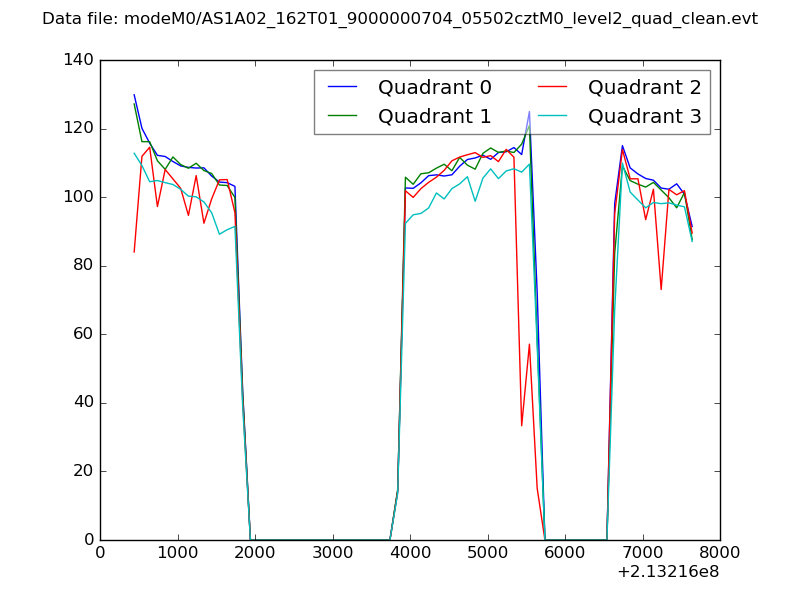 |
|
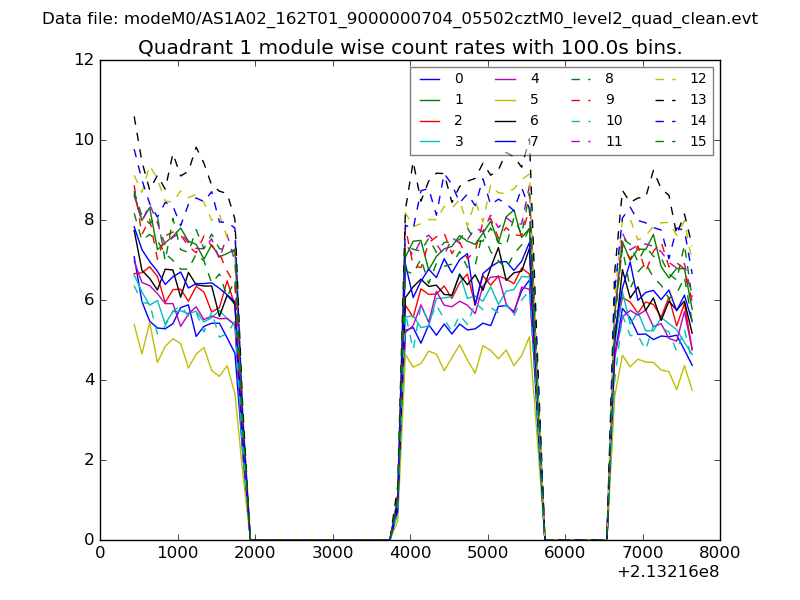
| Module-wise count rates for Quadrant A Data is divided into 100 sec bins |
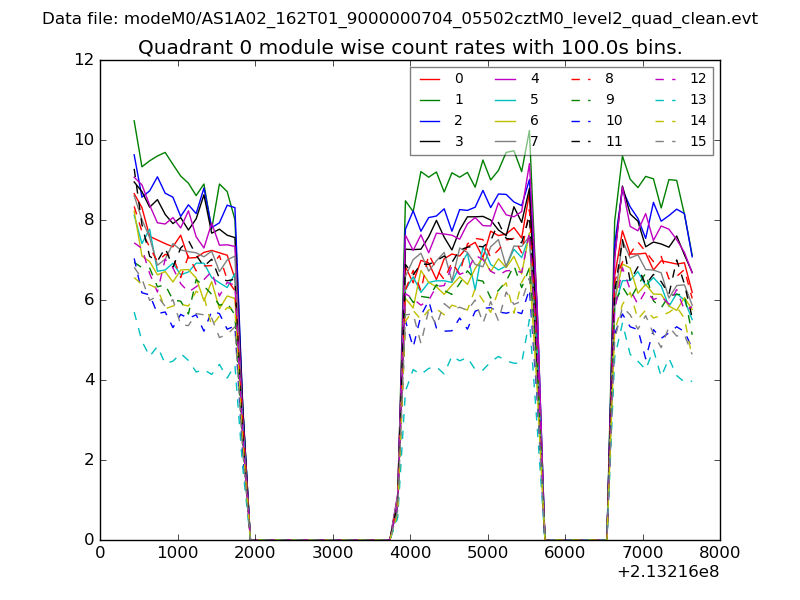 |
 |
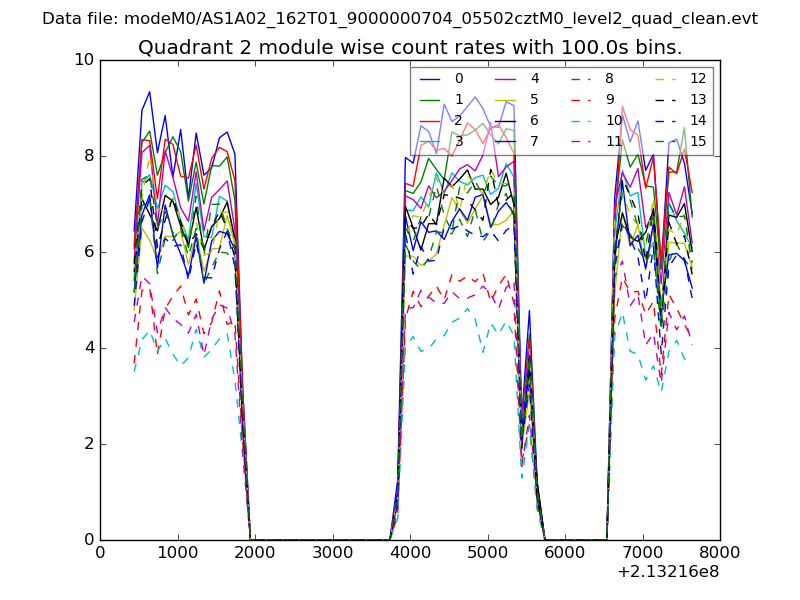
| Module-wise count rates for Quadrant B Data is divided into 100 sec bins |
 |
 |
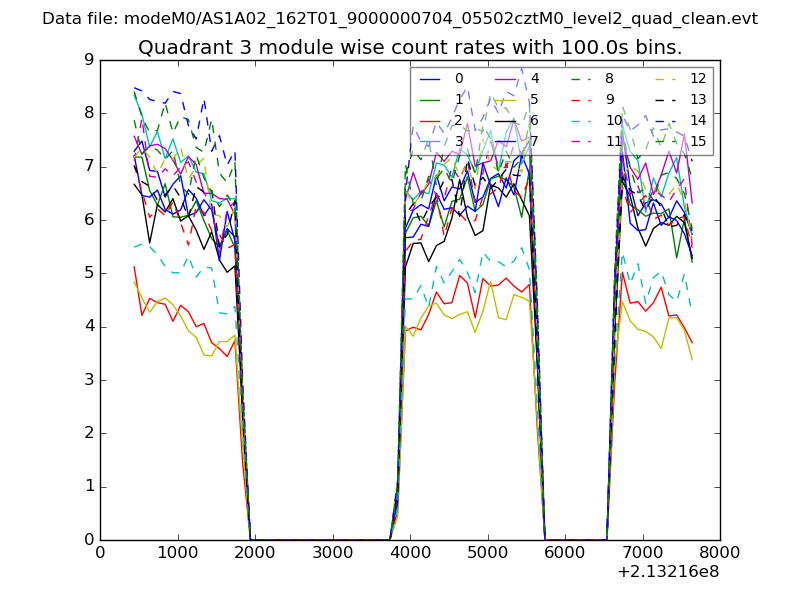
| Module-wise count rates for Quadrant C Data is divided into 100 sec bins |
 |
 |
| Module-wise count rates for Quadrant D Data is divided into 100 sec bins |
 |
 |
| Parameter | Plot |
|---|---|
| CZT HV Monitor | 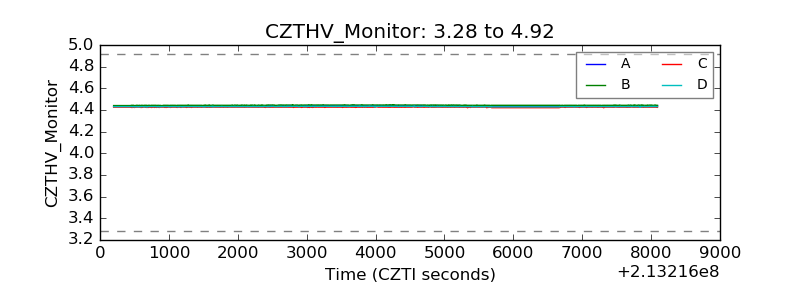 |
| D_VDD | 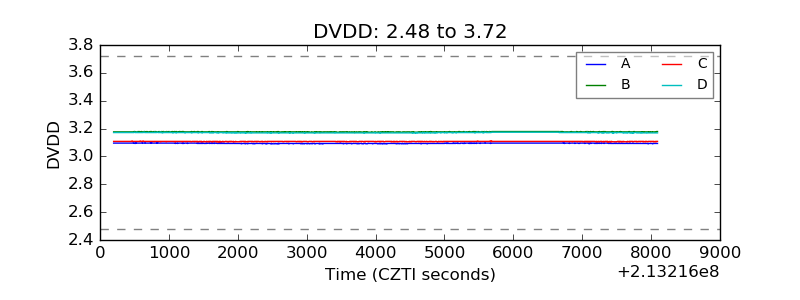 |
| Temperature 1 | 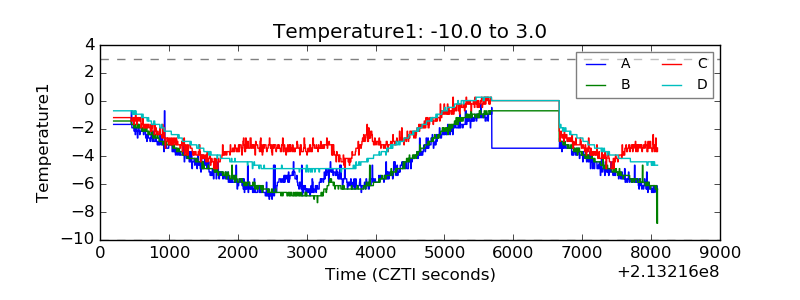 |
| Veto HV Monitor | 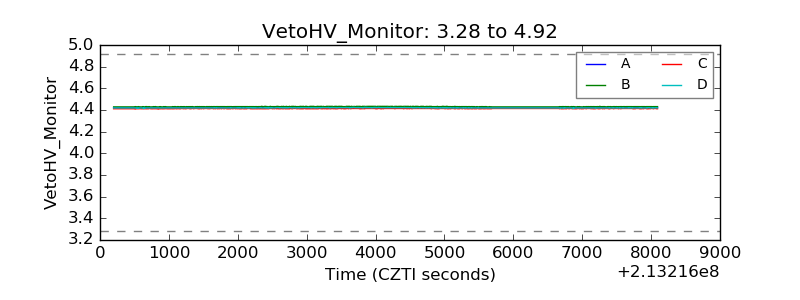 |
| Veto LLD | 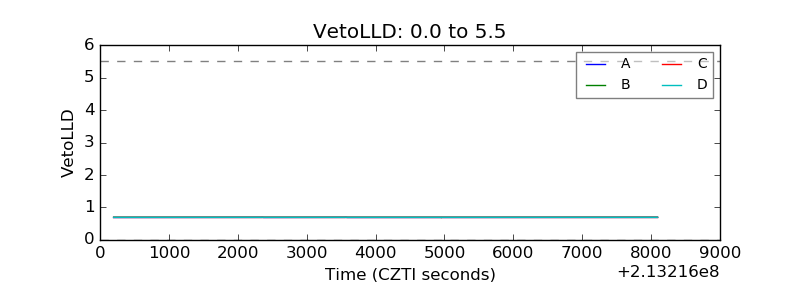 |
| Alpha Counter | 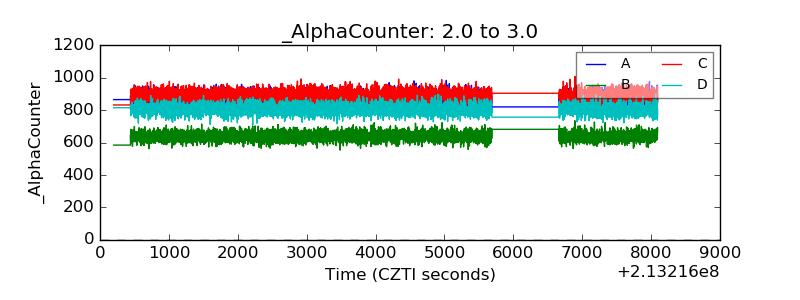 |
| _CPM_Rate | 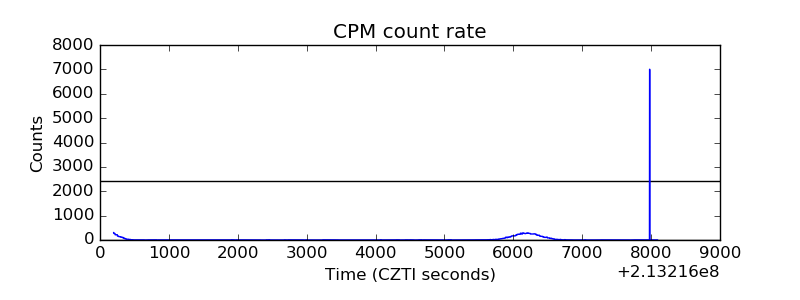 |
| CZT Counter | 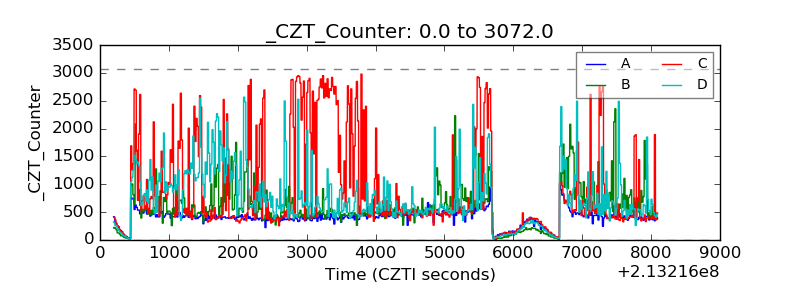 |
| +2.5 Volts monitor |  |
| +5 Volts monitor |  |
| _ROLL_ROT | 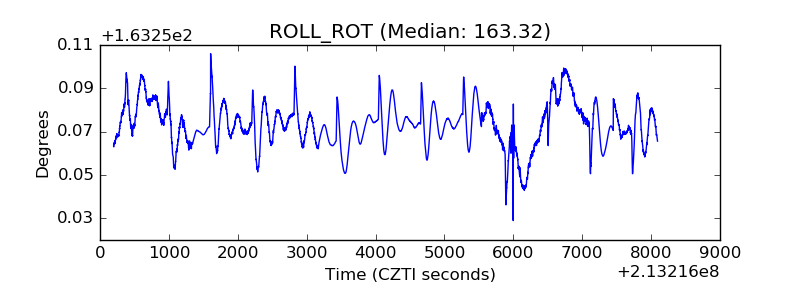 |
| _Roll_DEC | 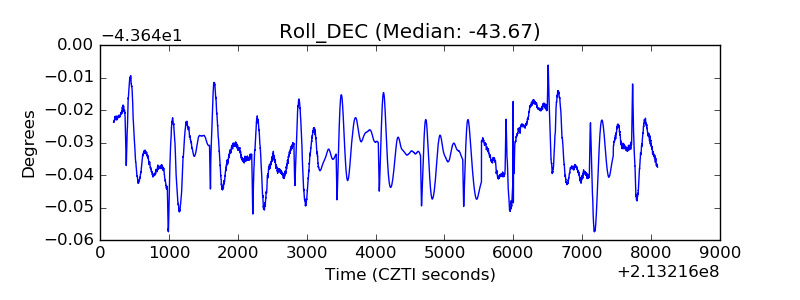 |
| _Roll_RA | 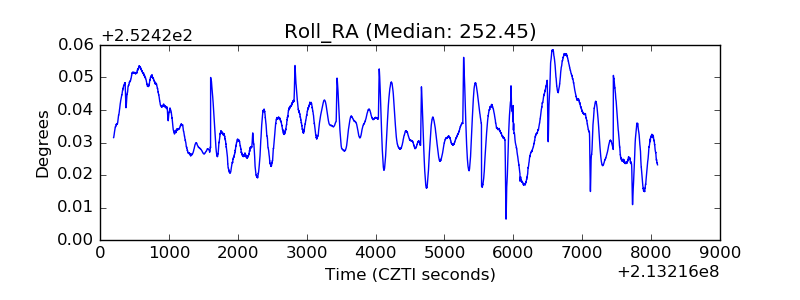 |
| Veto Counter | 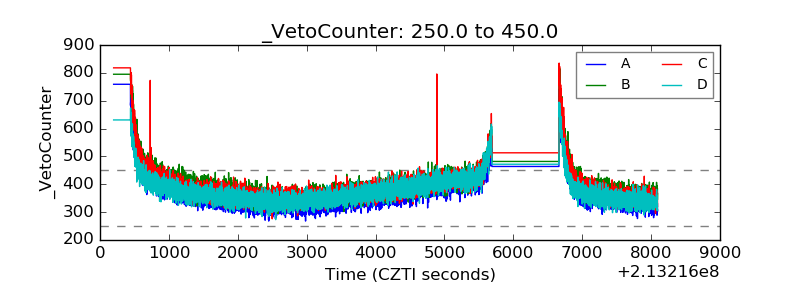 |