| Param | Original file | Final file |
|---|---|---|
| Filename | modeM0/AS1A02_162T01_9000000704_05503cztM0_level2.evt | modeM0/AS1A02_162T01_9000000704_05503cztM0_level2_quad_clean.evt |
| Size (bytes) | 589,887,360 | 74,125,440 |
| Size | 562.6 MB | 70.7 MB |
| Events in quadrant A | 3,153,693 | 450,779 |
| Events in quadrant B | 5,246,611 | 435,856 |
| Events in quadrant C | 4,190,725 | 441,120 |
| Events in quadrant D | 4,800,855 | 429,988 |
| Mode M0 | |||
|---|---|---|---|
| Quadrant | BADHDUFLAG | Total packets | Discarded packets |
| A | 0 | 14476 | 3 |
| B | 0 | 20404 | 2 |
| C | 0 | 17345 | 2 |
| D | 0 | 19129 | 2 |
| Mode SS | |||
|---|---|---|---|
| Quadrant | BADHDUFLAG | Total packets | Discarded packets |
| A | 0 | 140 | 0 |
| B | 0 | 140 | 0 |
| C | 0 | 140 | 0 |
| D | 0 | 140 | 0 |
| Mode M9 | |||
|---|---|---|---|
| Quadrant | BADHDUFLAG | Total packets | Discarded packets |
| A | 0 | 13 | 0 |
| B | 0 | 13 | 0 |
| C | 0 | 13 | 0 |
| D | 0 | 14 | 0 |
| Quadrant | Total seconds | Saturated seconds | Saturation percentage |
|---|---|---|---|
| A | 6988 | 73 | 1.044648% |
| B | 6988 | 372 | 5.323412% |
| C | 6988 | 275 | 3.935318% |
| D | 6988 | 183 | 2.618775% |
Noise dominated data is calculated using 1-second bins in cleaned event files. If a bin has >2000 counts, and if more than 50% of those come from <1% of pixels, then it is considered to be noise-dominated and hence unusable.
| Quadrant | # 1 sec bins | Bins with >0 counts | Bins with >2000 counts | High rate bins dominated by noise | Noise dominated (total time) | Noise dominated (detector-on time) | Marked lightcurve |
|---|---|---|---|---|---|---|---|
| A | 7628 | 6989 | 10 | 10 | 0.13% | 0.14% | 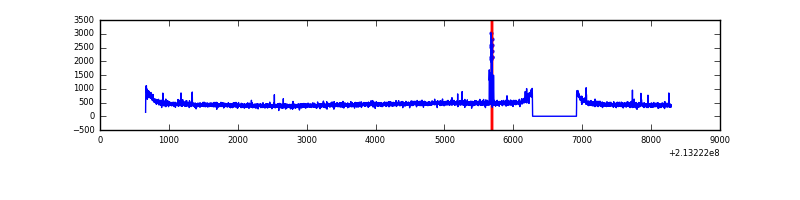 |
| B | 7628 | 6989 | 121 | 121 | 1.59% | 1.73% | 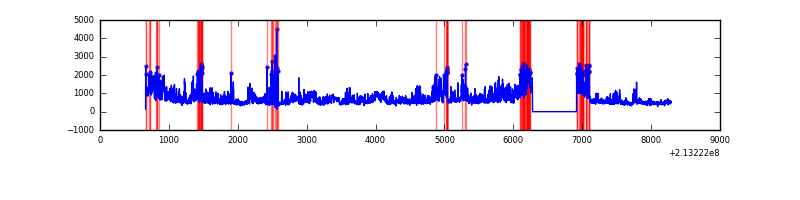 |
| C | 7628 | 6989 | 183 | 183 | 2.40% | 2.62% | 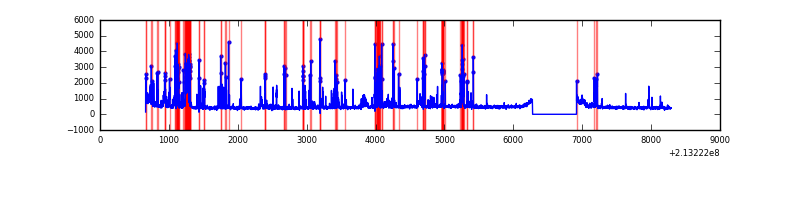 |
| D | 7628 | 6989 | 135 | 135 | 1.77% | 1.93% | 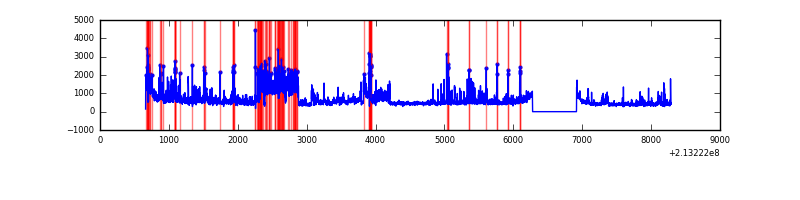 |
Top three noisy pixels from each quadrant. If the there are fewer than three noisy pixels in the level2.evt file, extra rows are filled as -1
| Pixel properties | Quadrant properties | ||||||
|---|---|---|---|---|---|---|---|
| Quadrant | DetID | PixID | Counts | Sigma | Mean | Median | Sigma |
| A | 15 | 174 | 42978 | 256.1 | 802 | 783 | 164.8 |
| A | 0 | 50 | 13889 | 79.54 | 802 | 783 | 164.8 |
| A | 13 | 6 | 9408 | 52.35 | 802 | 783 | 164.8 |
| B | 15 | 255 | 1662484 | 10826.29 | 799 | 780 | 153.5 |
| B | 15 | 204 | 255871 | 1661.96 | 799 | 780 | 153.5 |
| B | 0 | 219 | 75770 | 488.57 | 799 | 780 | 153.5 |
| C | 1 | 241 | 565331 | 3169.88 | 766 | 770 | 178.1 |
| C | 9 | 247 | 480076 | 2691.19 | 766 | 770 | 178.1 |
| C | 1 | 16 | 146773 | 819.77 | 766 | 770 | 178.1 |
| D | 2 | 63 | 1320716 | 6950.98 | 768 | 743 | 189.9 |
| D | 2 | 152 | 229592 | 1205.12 | 768 | 743 | 189.9 |
| D | 12 | 233 | 85140 | 444.43 | 768 | 743 | 189.9 |
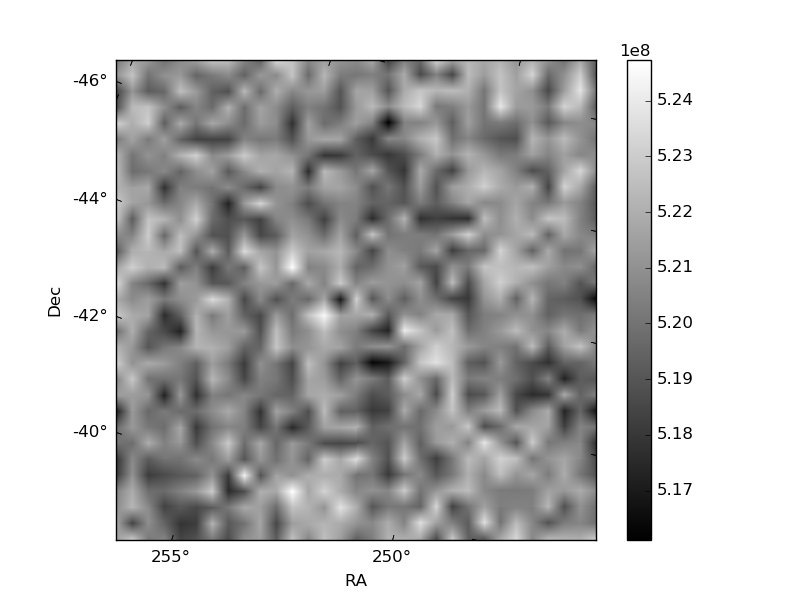
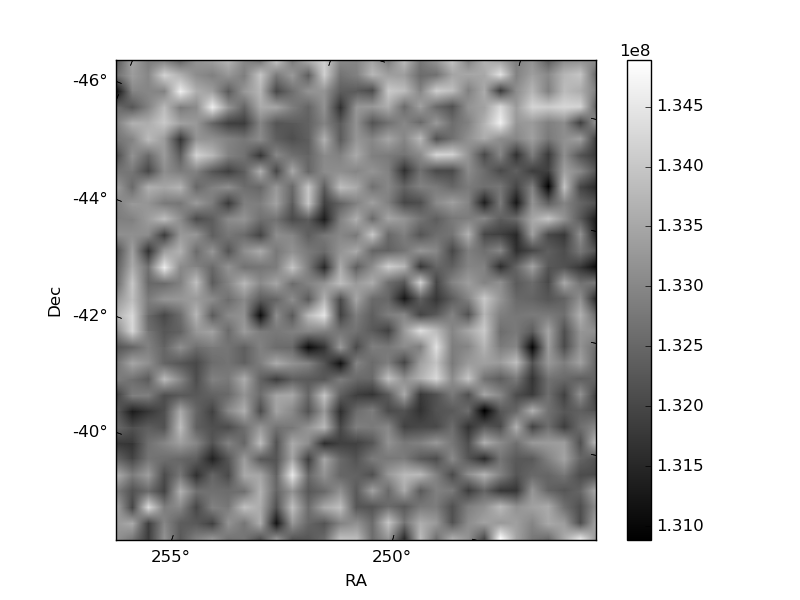
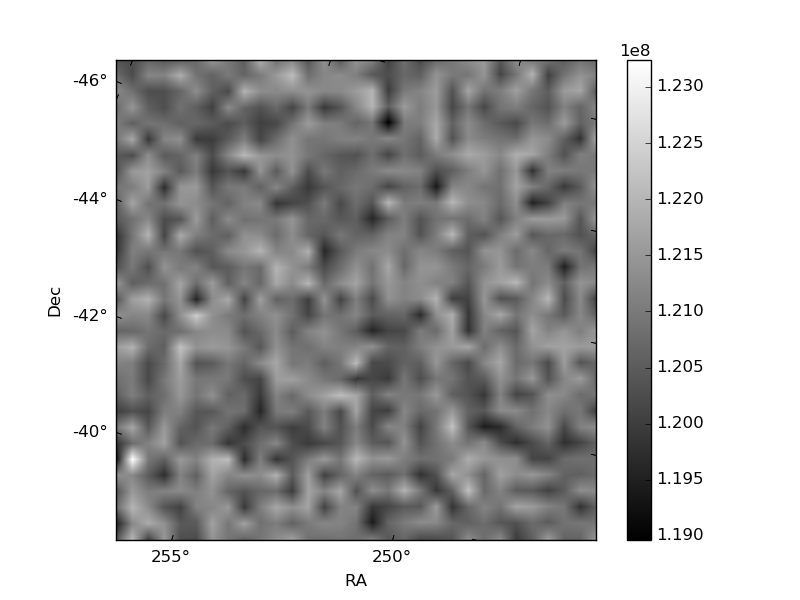
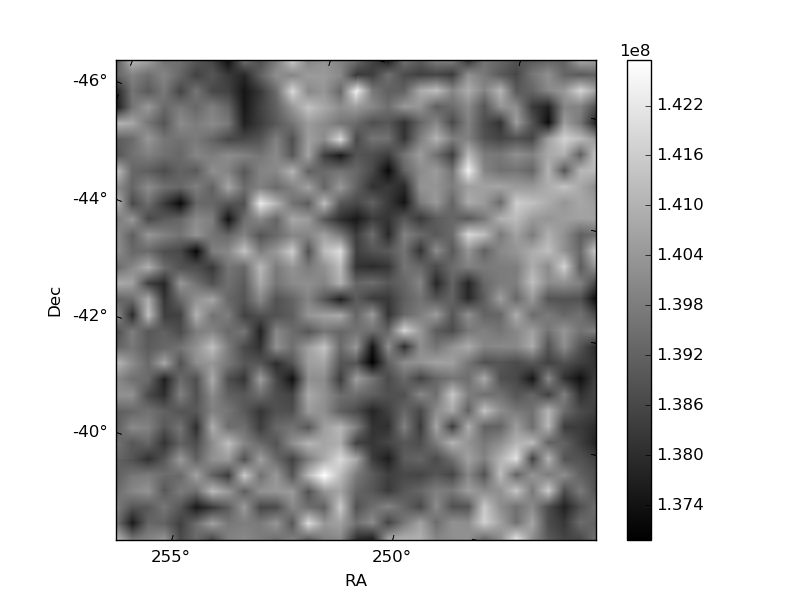
Histogram calculated using DETX and DETY for each event in the final _common_clean file
| Quadrant A | 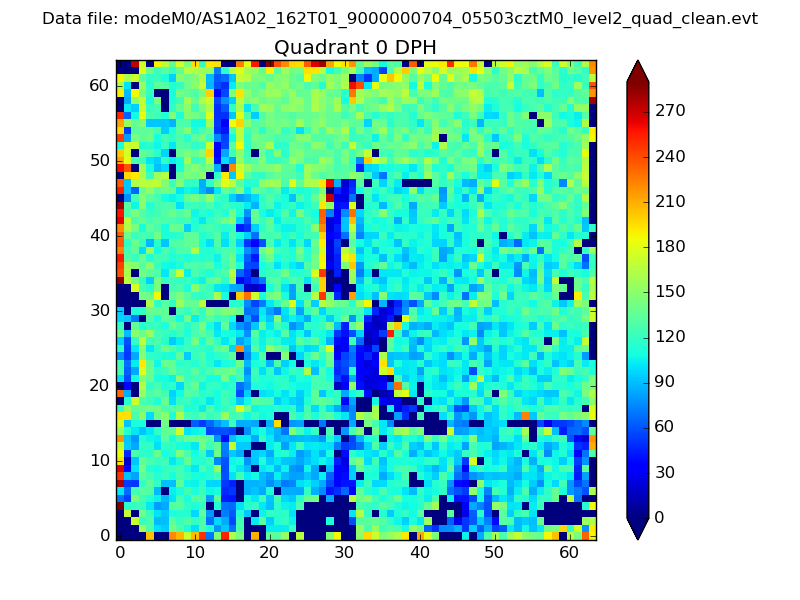 |
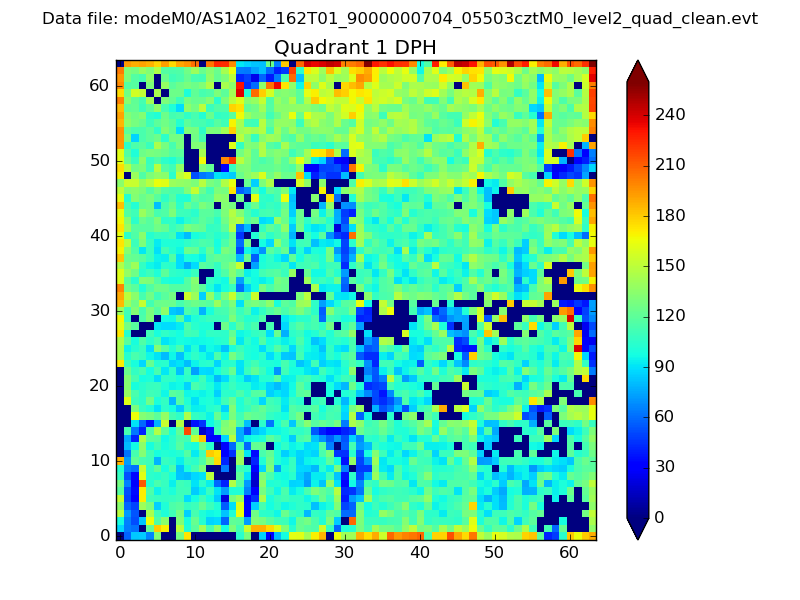 |
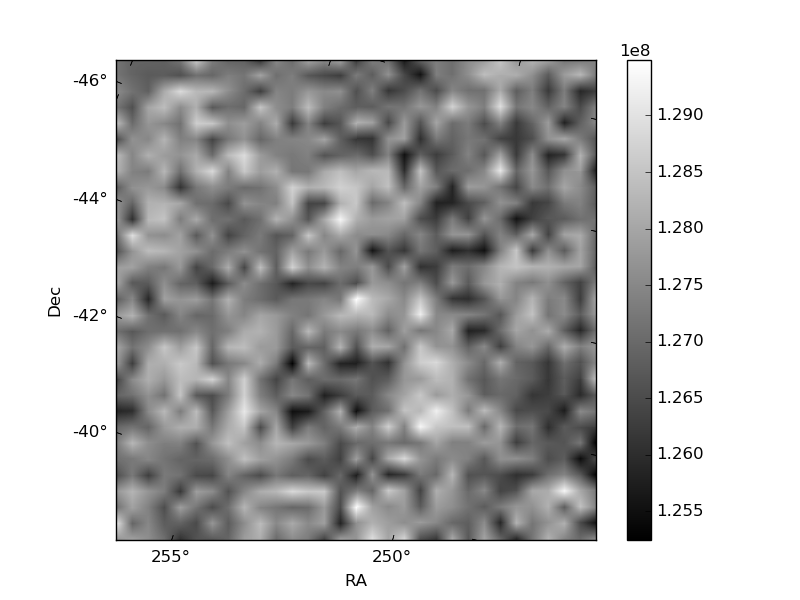
Quadrant B |
|---|---|---|---|
| Quadrant D | 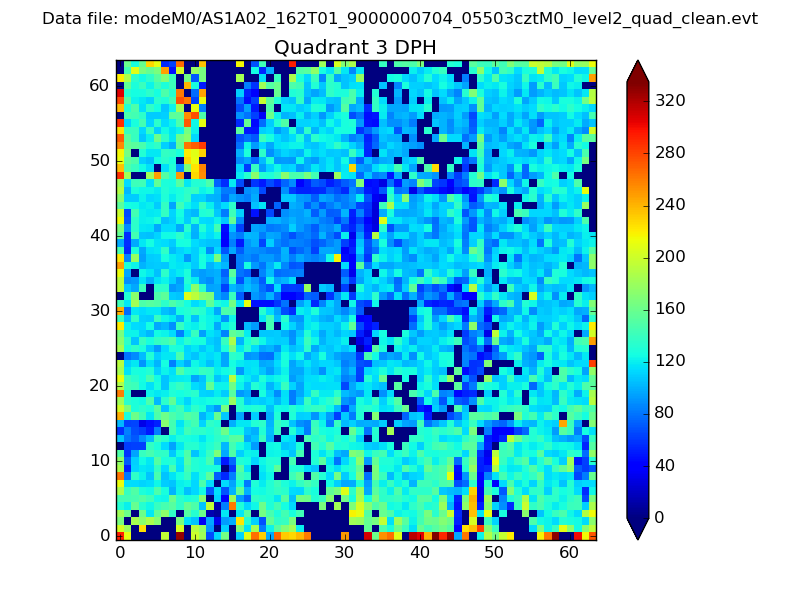 |
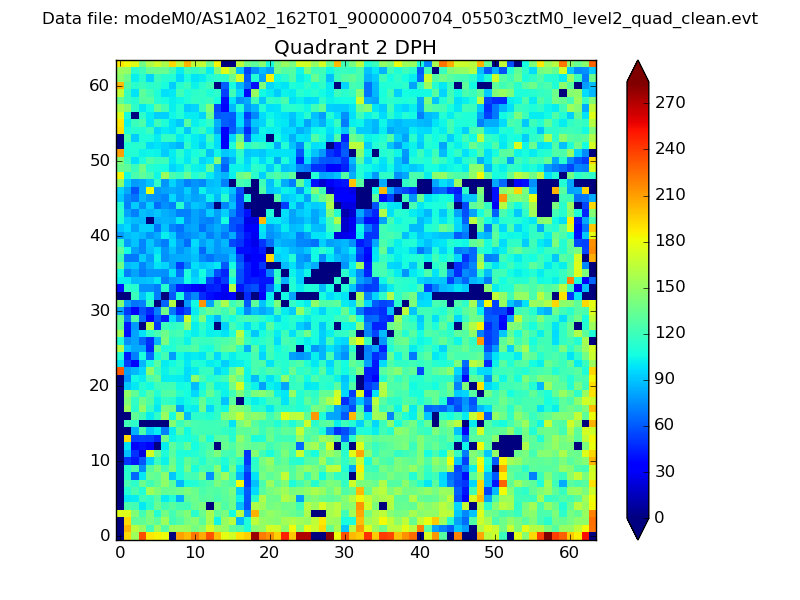 |
Quadrant C |
| Plot type | Count rate plots | Images |
|---|---|---|
| Comparison with Poisson distribution Blue bars denote a histogram of data divided into 1 sec bins. Red curve is a Poisson curve with rate = median count rate of data. |
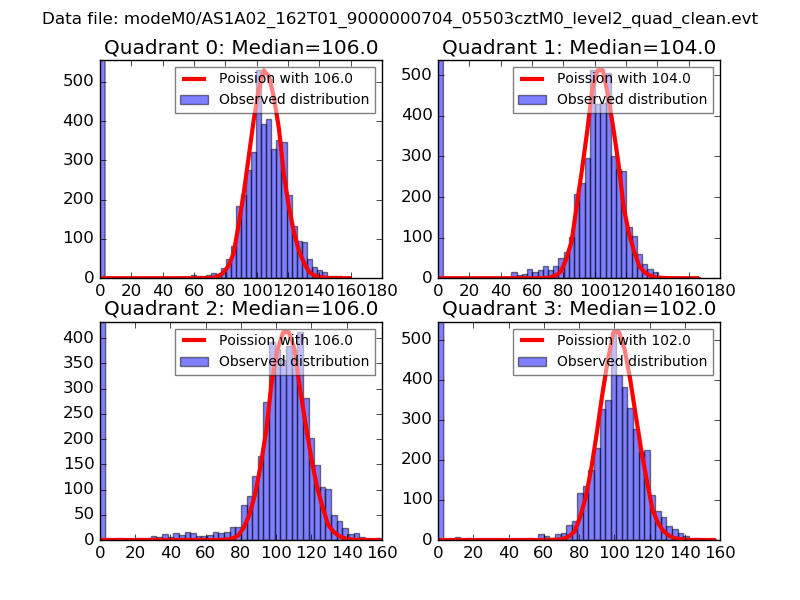 |
 |
| Quadrant-wise count rates Data is divided into 100 sec bins |
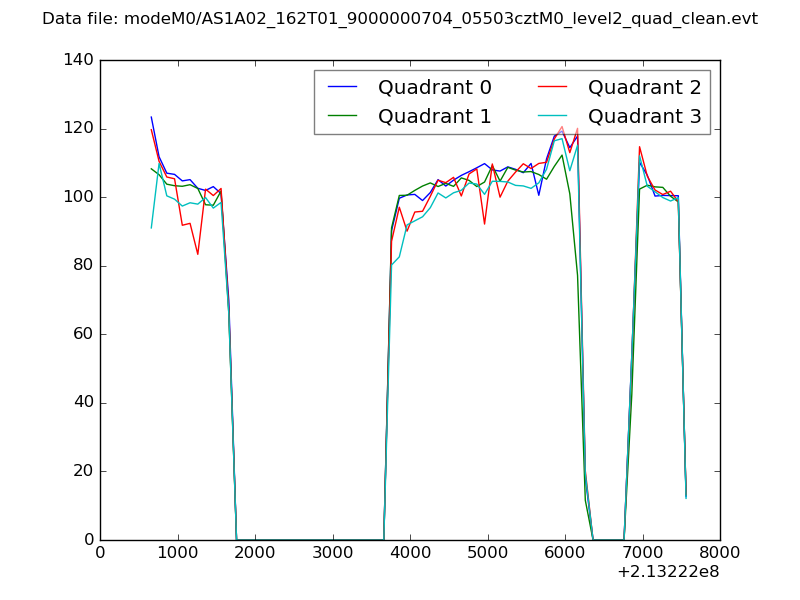 |
|
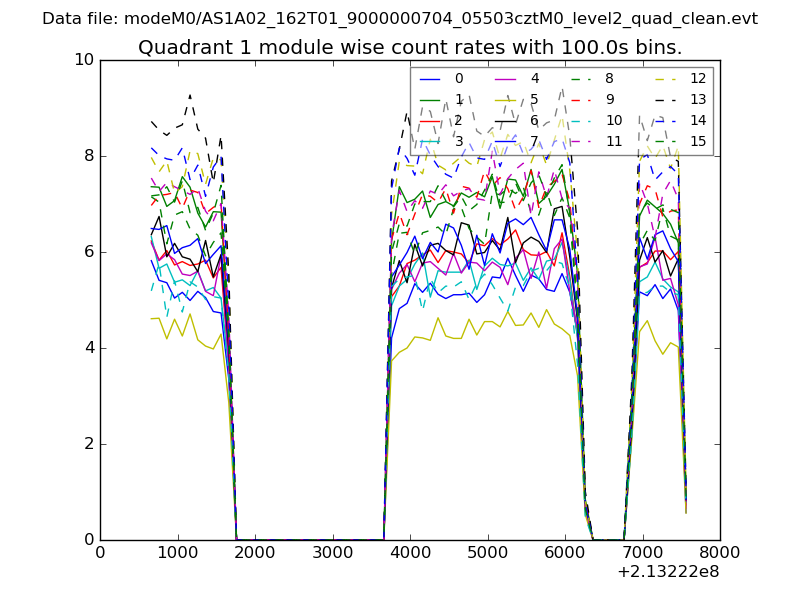
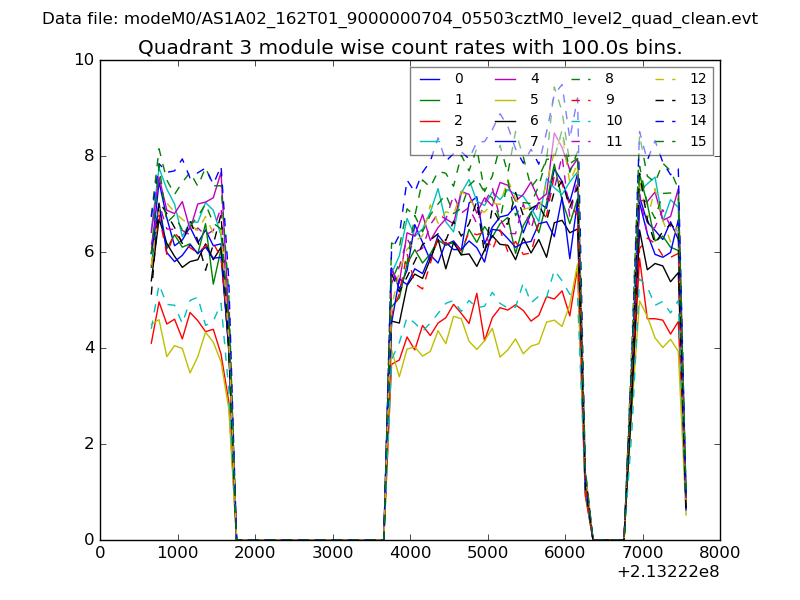
| Module-wise count rates for Quadrant A Data is divided into 100 sec bins |
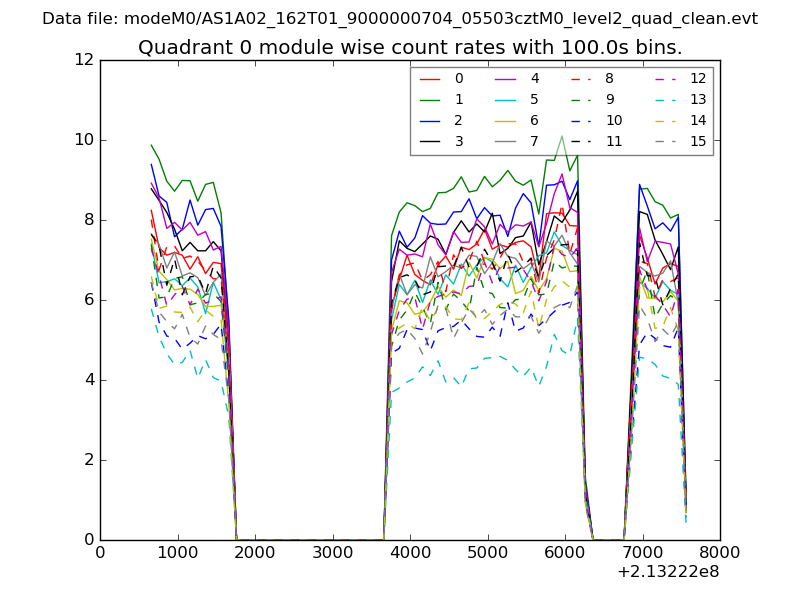 |
 |
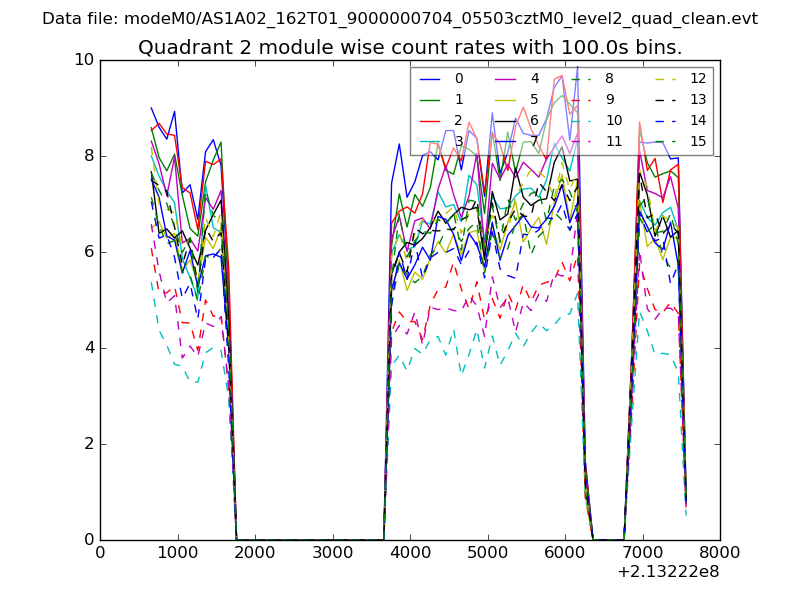
| Module-wise count rates for Quadrant B Data is divided into 100 sec bins |
 |
 |
| Module-wise count rates for Quadrant C Data is divided into 100 sec bins |
 |
 |
| Module-wise count rates for Quadrant D Data is divided into 100 sec bins |
 |
 |
| Parameter | Plot |
|---|---|
| CZT HV Monitor | 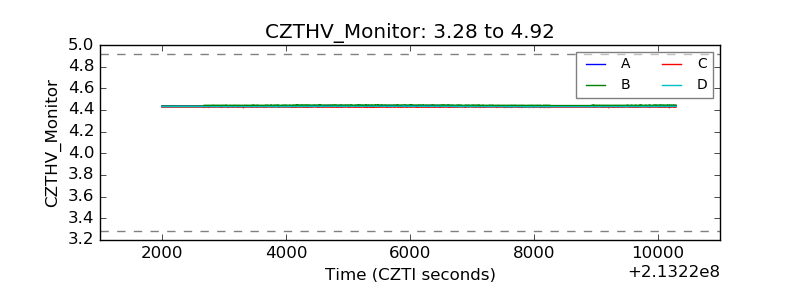 |
| D_VDD | 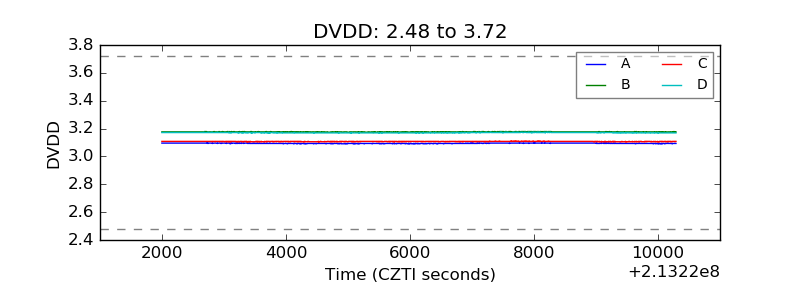 |
| Temperature 1 | 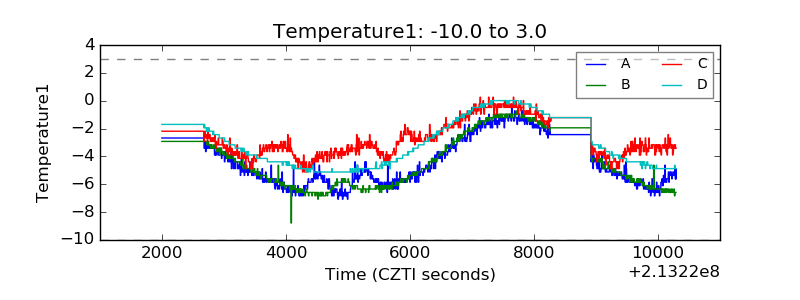 |
| Veto HV Monitor | 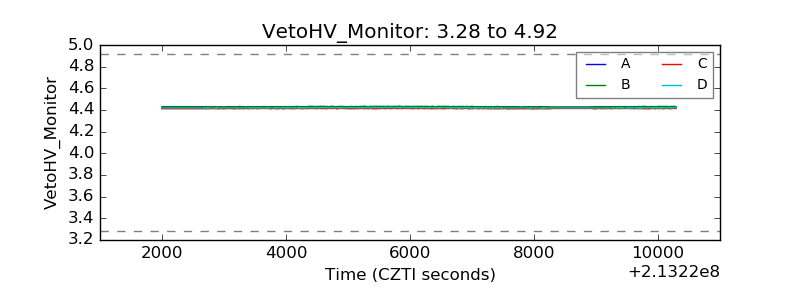 |
| Veto LLD | 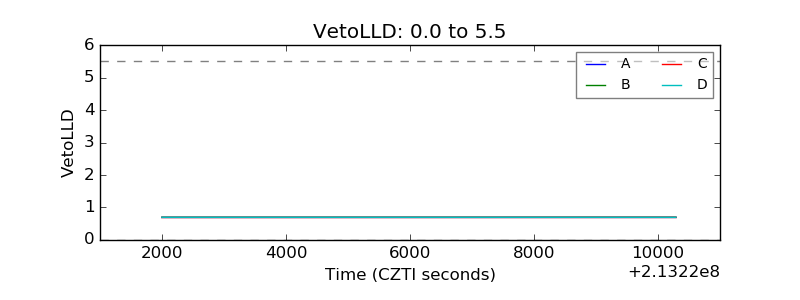 |
| Alpha Counter | 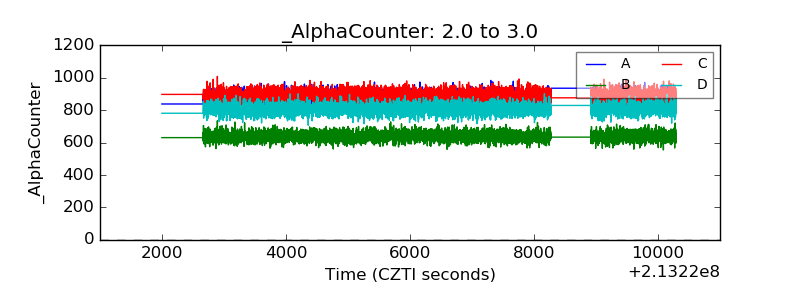 |
| _CPM_Rate | 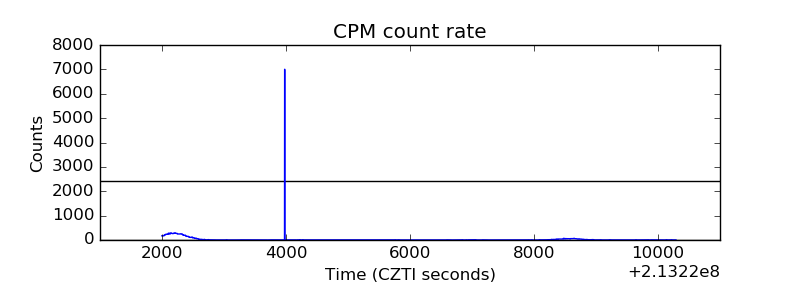 |
| CZT Counter | 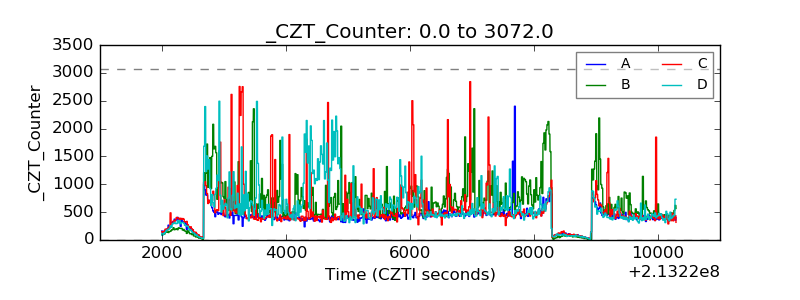 |
| +2.5 Volts monitor | 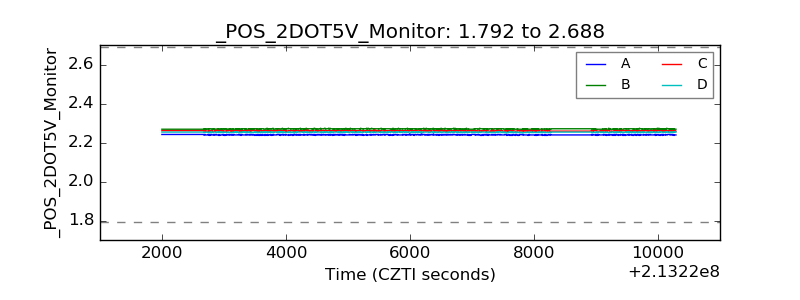 |
| +5 Volts monitor | 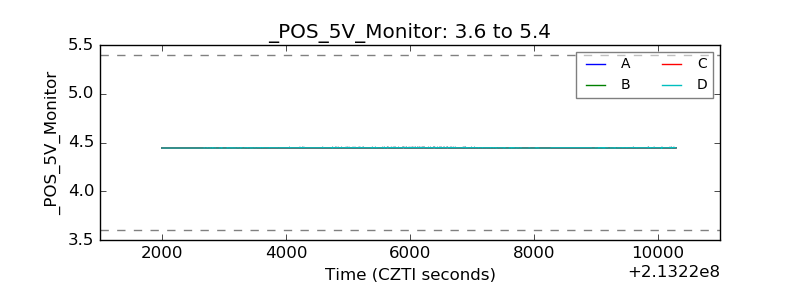 |
| _ROLL_ROT | 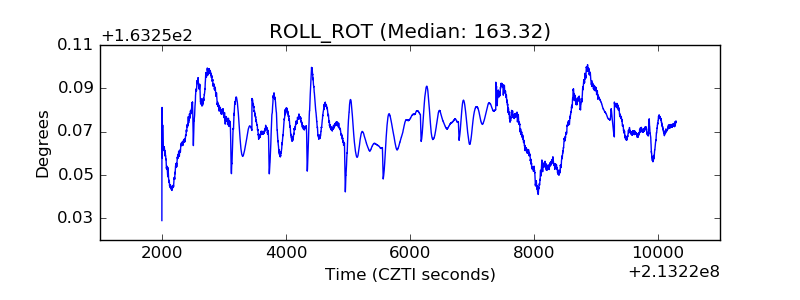 |
| _Roll_DEC | 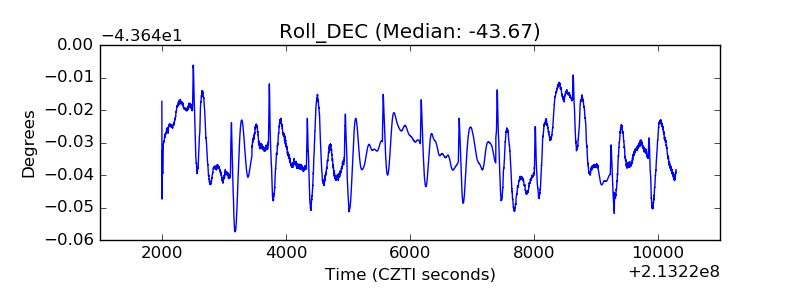 |
| _Roll_RA | 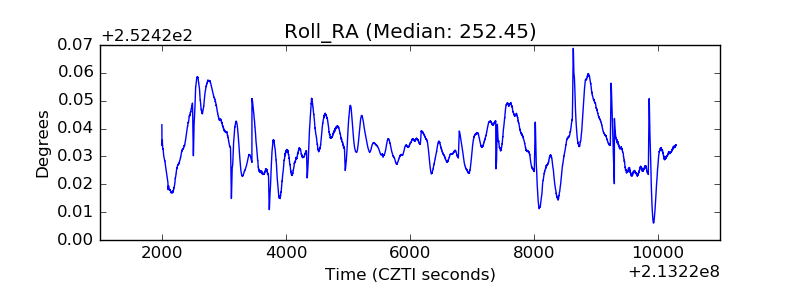 |
| Veto Counter | 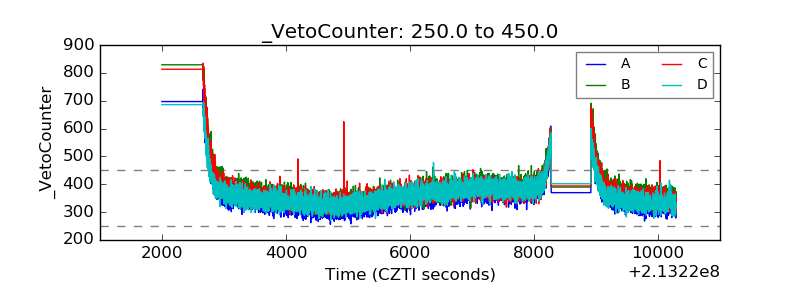 |