| Param | Original file | Final file |
|---|---|---|
| Filename | modeM0/AS1A02_162T01_9000000704_05504cztM0_level2.evt | modeM0/AS1A02_162T01_9000000704_05504cztM0_level2_quad_clean.evt |
| Size (bytes) | 633,528,000 | 80,386,560 |
| Size | 604.2 MB | 76.7 MB |
| Events in quadrant A | 3,601,780 | 483,912 |
| Events in quadrant B | 7,158,427 | 447,621 |
| Events in quadrant C | 3,843,931 | 487,580 |
| Events in quadrant D | 4,045,957 | 464,496 |
| Mode M0 | |||
|---|---|---|---|
| Quadrant | BADHDUFLAG | Total packets | Discarded packets |
| A | 0 | 16502 | 4 |
| B | 0 | 26627 | 3 |
| C | 0 | 17173 | 5 |
| D | 0 | 17855 | 3 |
| Mode SS | |||
|---|---|---|---|
| Quadrant | BADHDUFLAG | Total packets | Discarded packets |
| A | 0 | 164 | 0 |
| B | 0 | 164 | 0 |
| C | 0 | 164 | 0 |
| D | 0 | 164 | 0 |
| Mode M9 | |||
|---|---|---|---|
| Quadrant | BADHDUFLAG | Total packets | Discarded packets |
| A | 0 | 9 | 0 |
| B | 0 | 9 | 0 |
| C | 0 | 9 | 0 |
| D | 0 | 9 | 0 |
| Quadrant | Total seconds | Saturated seconds | Saturation percentage |
|---|---|---|---|
| A | 7913 | 113 | 1.428030% |
| B | 7913 | 948 | 11.980286% |
| C | 7912 | 121 | 1.529323% |
| D | 7913 | 194 | 2.451662% |
Noise dominated data is calculated using 1-second bins in cleaned event files. If a bin has >2000 counts, and if more than 50% of those come from <1% of pixels, then it is considered to be noise-dominated and hence unusable.
| Quadrant | # 1 sec bins | Bins with >0 counts | Bins with >2000 counts | High rate bins dominated by noise | Noise dominated (total time) | Noise dominated (detector-on time) | Marked lightcurve |
|---|---|---|---|---|---|---|---|
| A | 8793 | 7916 | 3 | 3 | 0.03% | 0.04% | 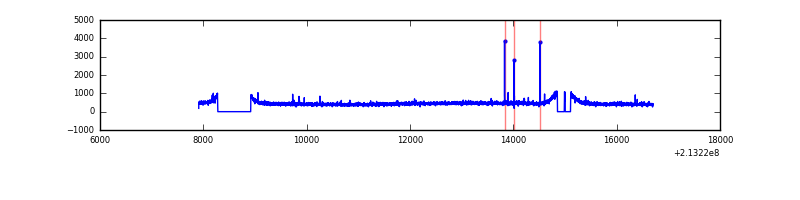 |
| B | 8793 | 7916 | 480 | 480 | 5.46% | 6.06% | 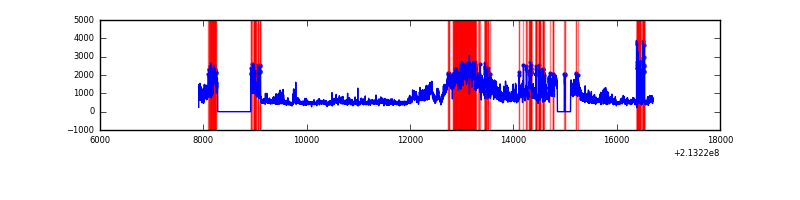 |
| C | 8793 | 7916 | 23 | 23 | 0.26% | 0.29% | 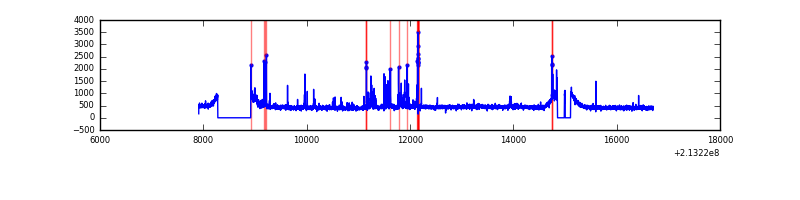 |
| D | 8793 | 7916 | 69 | 69 | 0.78% | 0.87% | 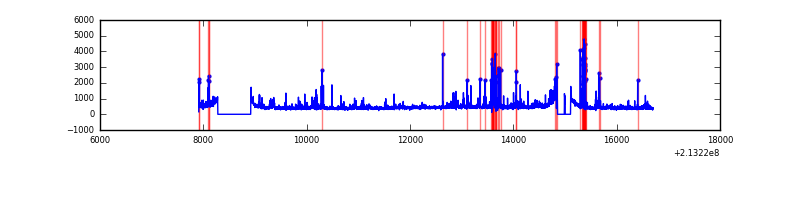 |
Top three noisy pixels from each quadrant. If the there are fewer than three noisy pixels in the level2.evt file, extra rows are filled as -1
| Pixel properties | Quadrant properties | ||||||
|---|---|---|---|---|---|---|---|
| Quadrant | DetID | PixID | Counts | Sigma | Mean | Median | Sigma |
| A | 0 | 50 | 21286 | 106.16 | 926 | 902 | 192.0 |
| A | 13 | 6 | 11490 | 55.14 | 926 | 902 | 192.0 |
| A | 12 | 194 | 9186 | 43.14 | 926 | 902 | 192.0 |
| B | 15 | 255 | 2808918 | 16054.13 | 900 | 878 | 174.9 |
| B | 15 | 204 | 624856 | 3567.41 | 900 | 878 | 174.9 |
| B | 4 | 48 | 157246 | 893.99 | 900 | 878 | 174.9 |
| C | 9 | 247 | 276487 | 1315.73 | 896 | 899 | 209.5 |
| C | 1 | 16 | 57107 | 268.35 | 896 | 899 | 209.5 |
| C | 13 | 61 | 7291 | 30.52 | 896 | 899 | 209.5 |
| D | 2 | 152 | 417239 | 1891.24 | 890 | 861 | 220.2 |
| D | 11 | 192 | 50034 | 223.35 | 890 | 861 | 220.2 |
| D | 2 | 136 | 48235 | 215.18 | 890 | 861 | 220.2 |
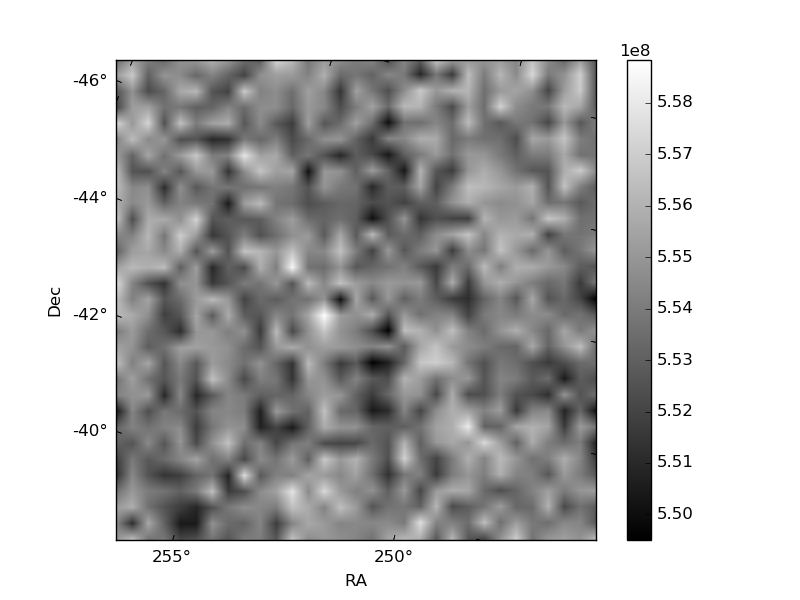
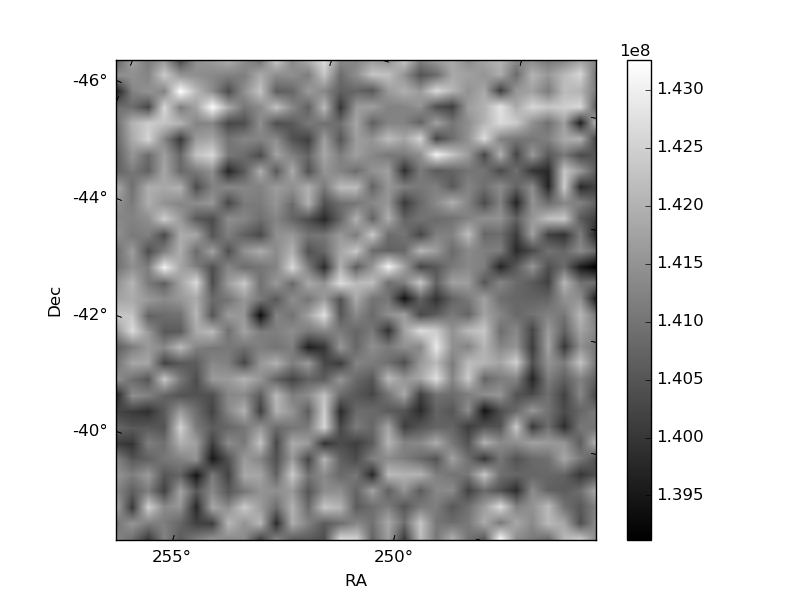
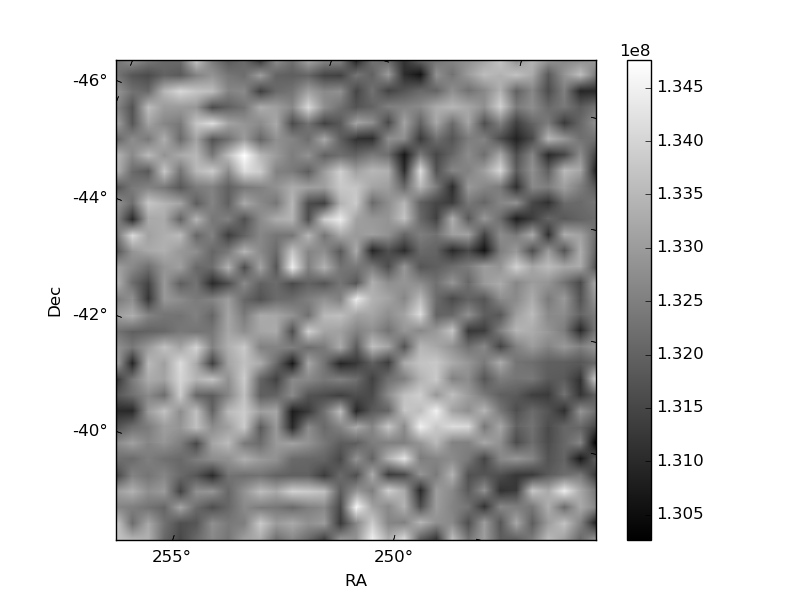
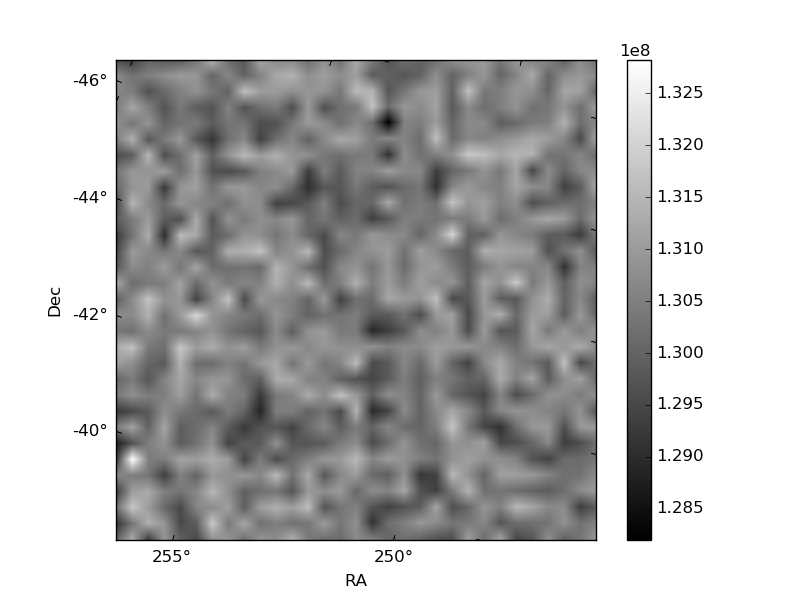
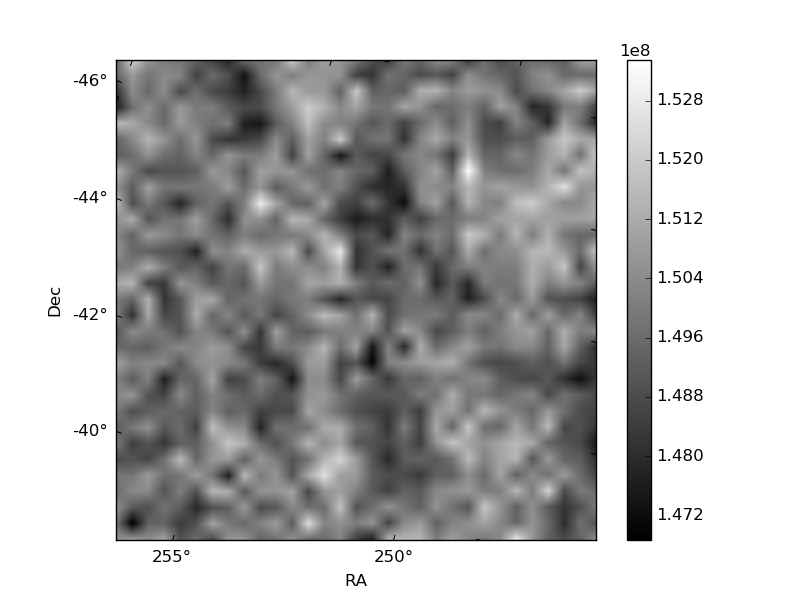
Histogram calculated using DETX and DETY for each event in the final _common_clean file
| Quadrant A | 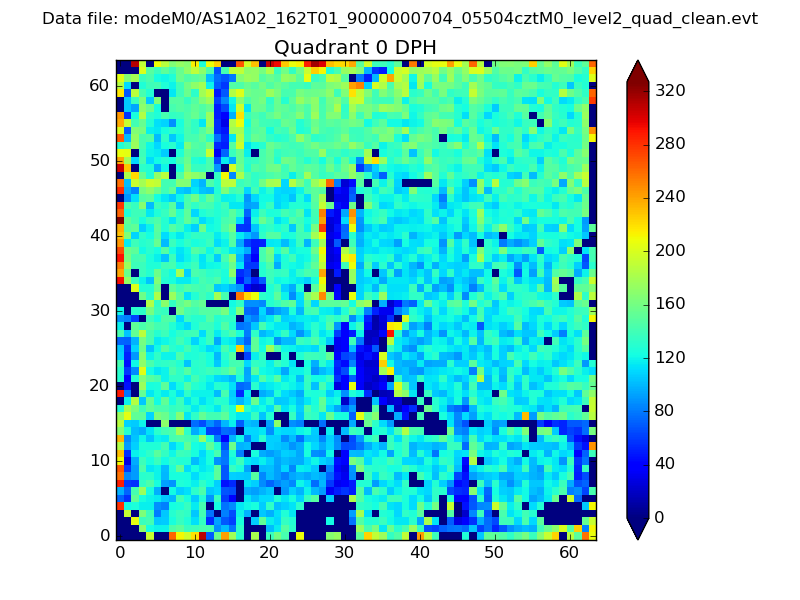 |
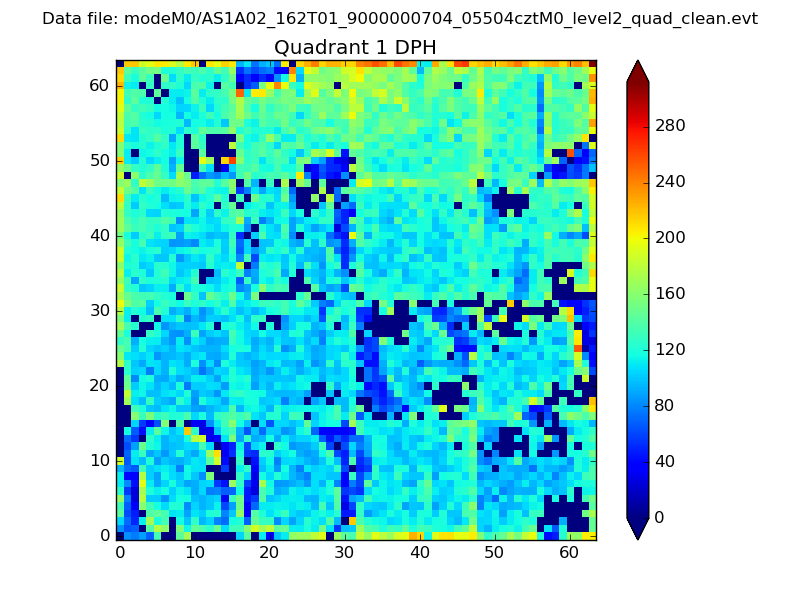 |
Quadrant B |
|---|---|---|---|
| Quadrant D | 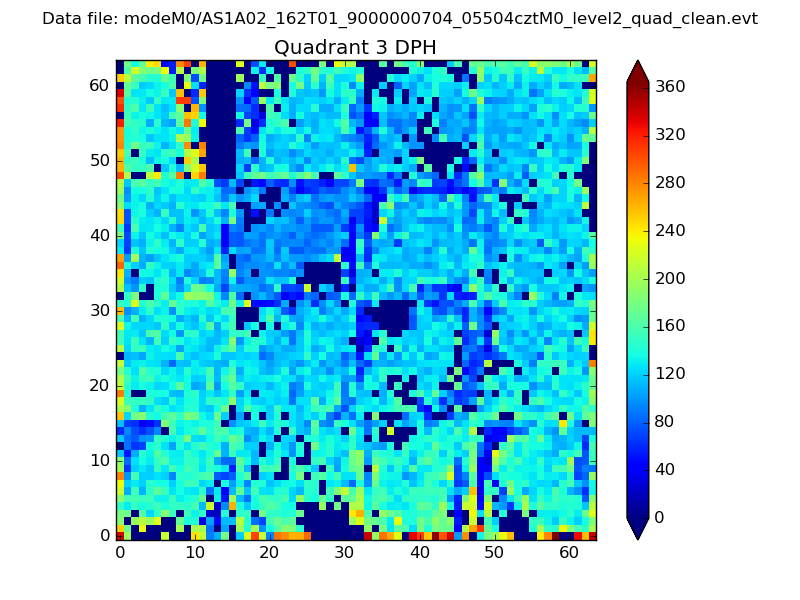 |
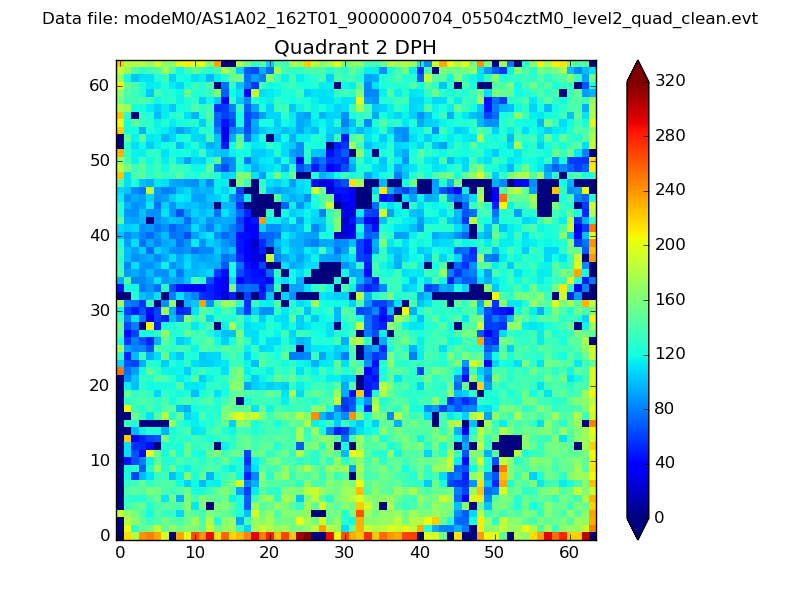 |
Quadrant C |
| Plot type | Count rate plots | Images |
|---|---|---|
| Comparison with Poisson distribution Blue bars denote a histogram of data divided into 1 sec bins. Red curve is a Poisson curve with rate = median count rate of data. |
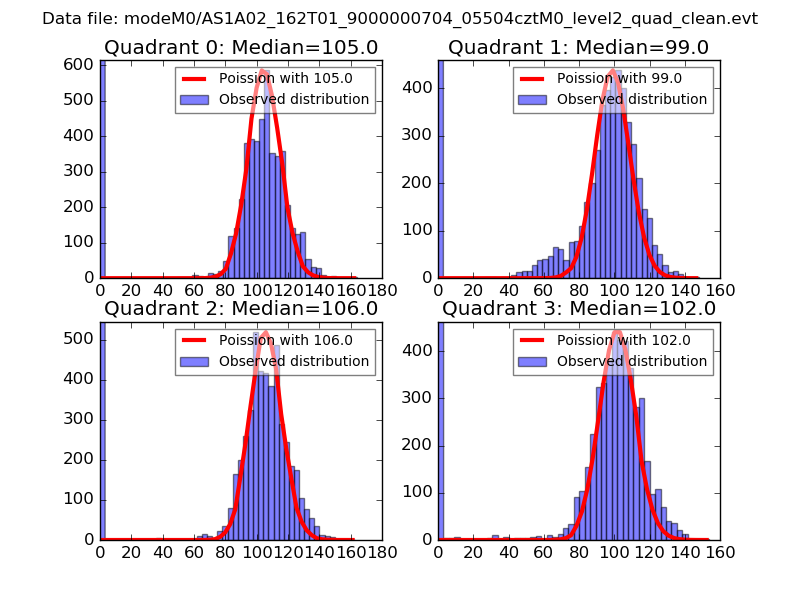 |
 |
| Quadrant-wise count rates Data is divided into 100 sec bins |
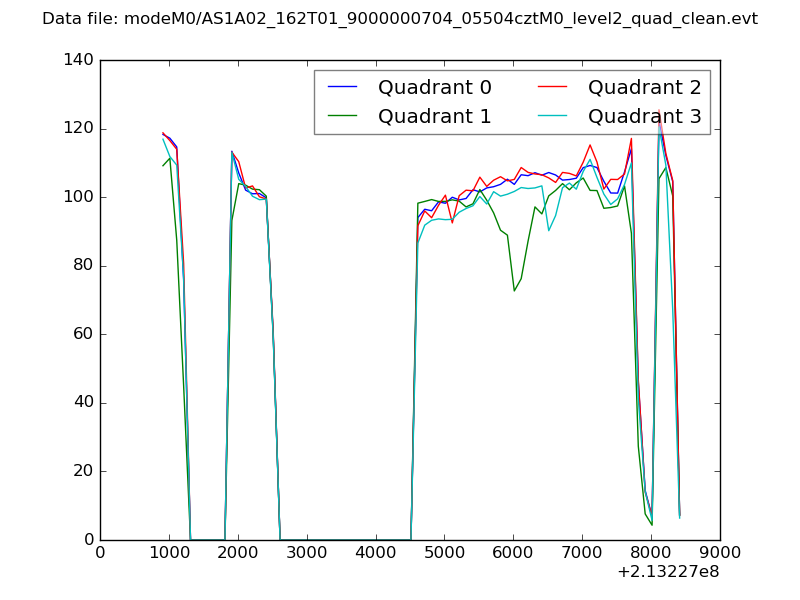 |
|
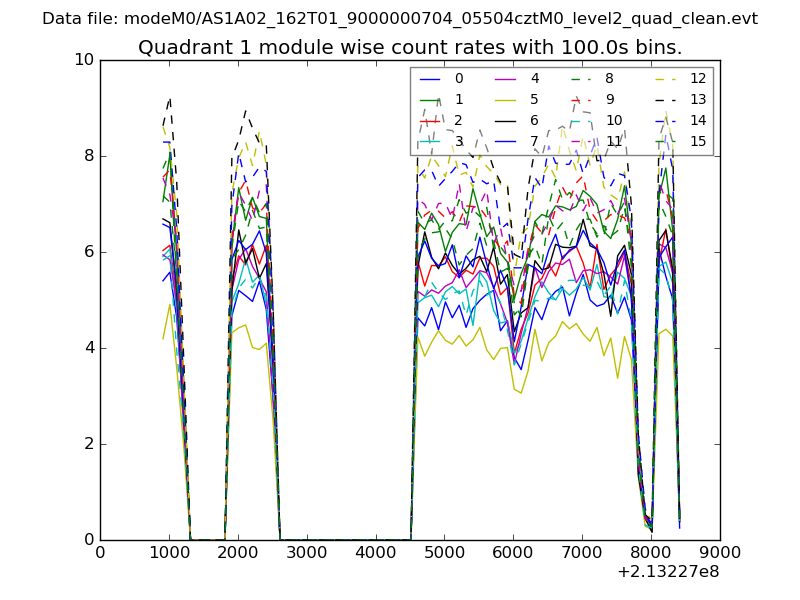
| Module-wise count rates for Quadrant A Data is divided into 100 sec bins |
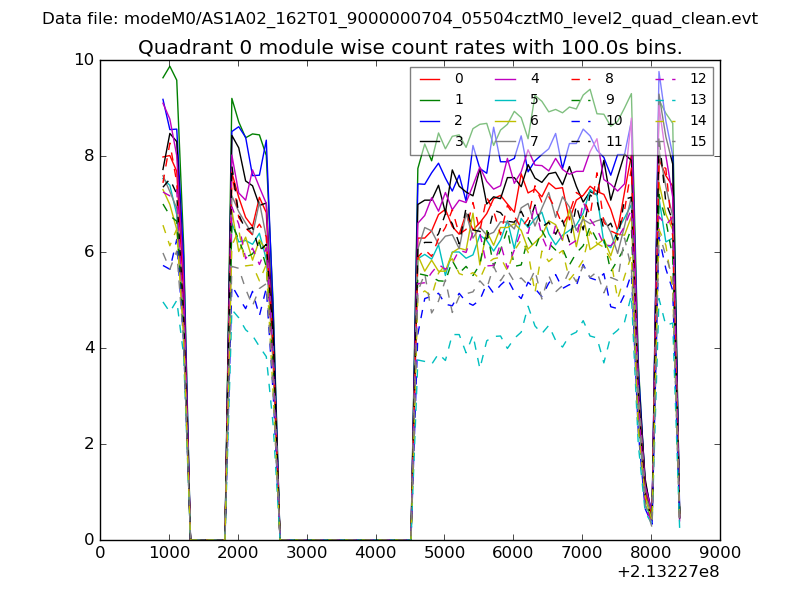 |
 |
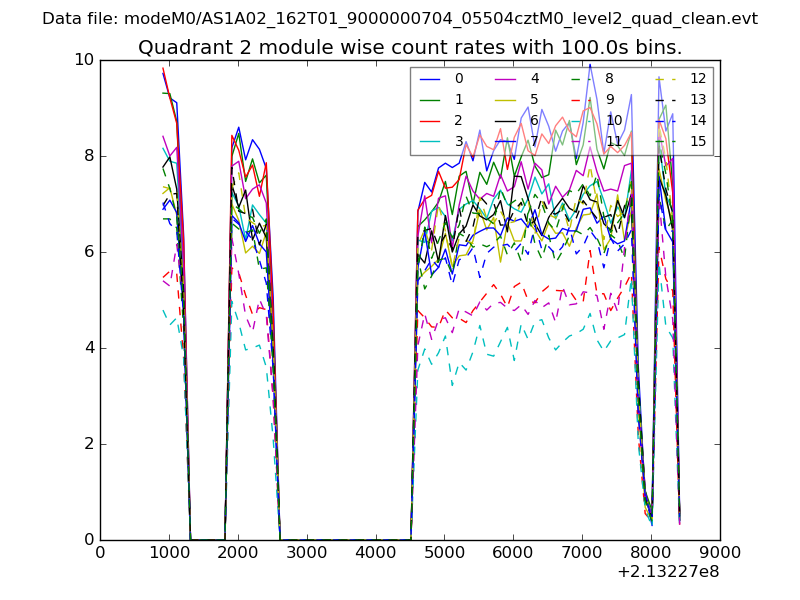
| Module-wise count rates for Quadrant B Data is divided into 100 sec bins |
 |
 |
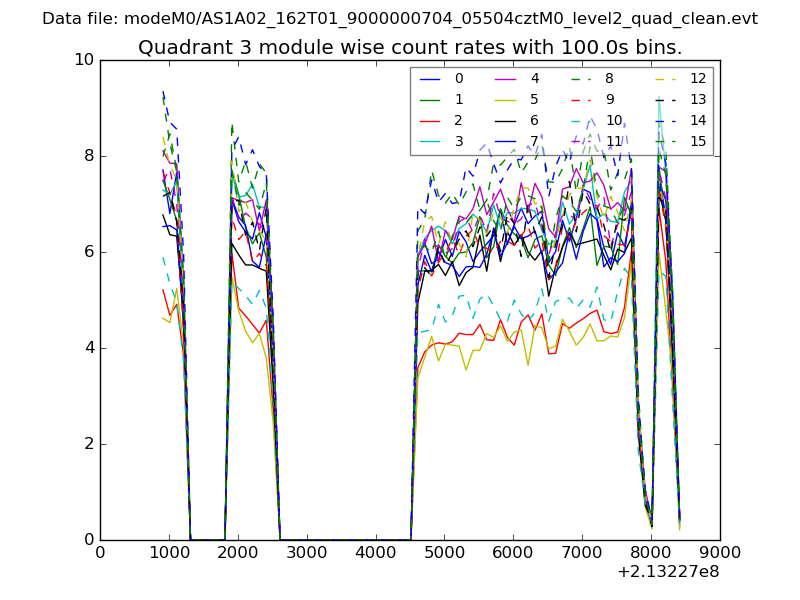
| Module-wise count rates for Quadrant C Data is divided into 100 sec bins |
 |
 |
| Module-wise count rates for Quadrant D Data is divided into 100 sec bins |
 |
 |
| Parameter | Plot |
|---|---|
| CZT HV Monitor | 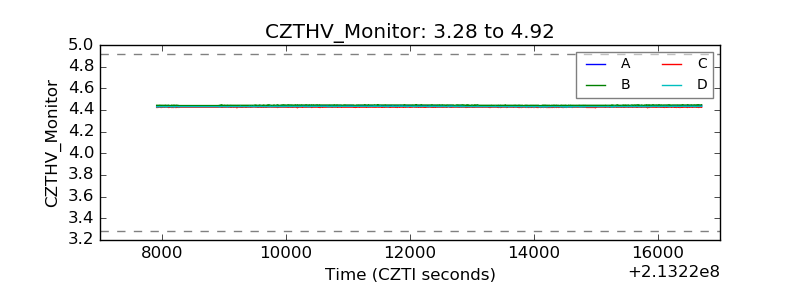 |
| D_VDD | 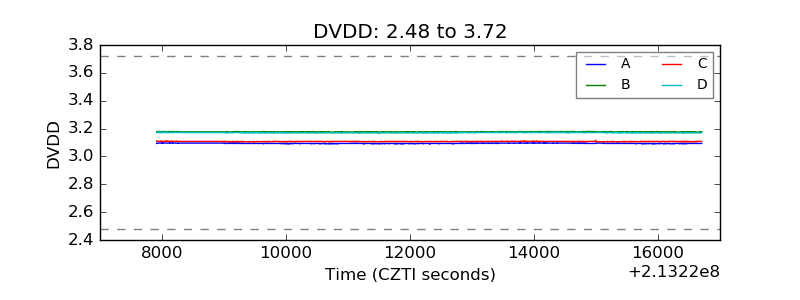 |
| Temperature 1 | 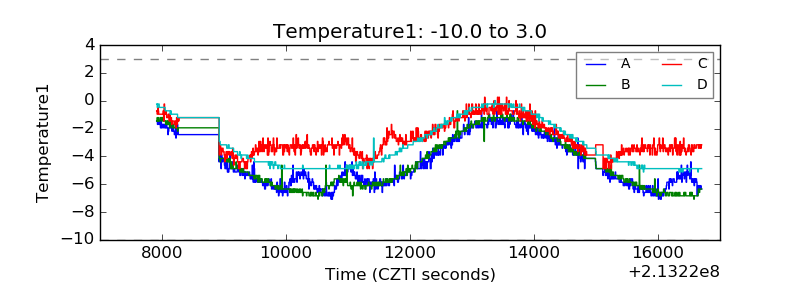 |
| Veto HV Monitor | 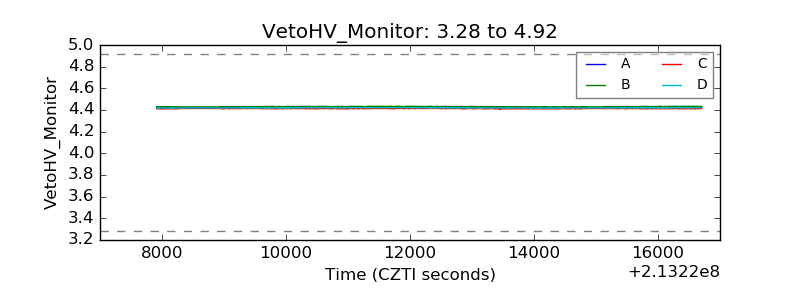 |
| Veto LLD | 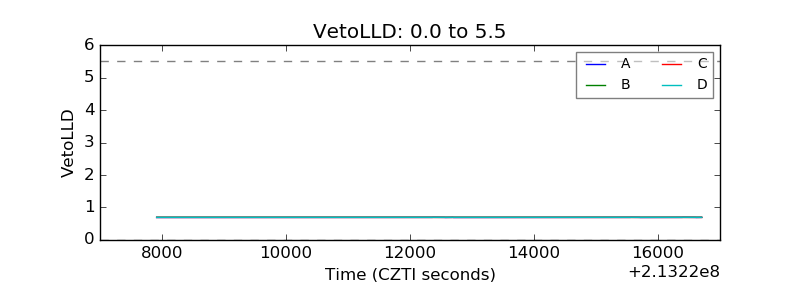 |
| Alpha Counter | 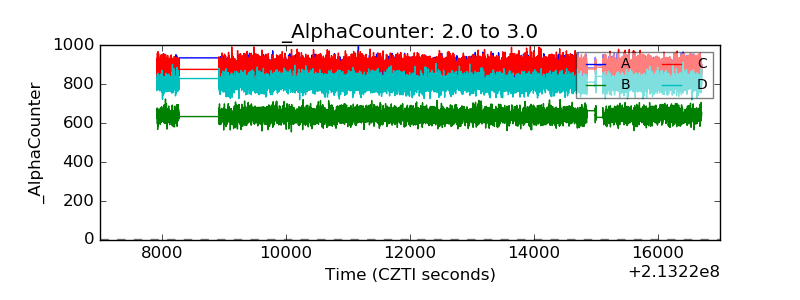 |
| _CPM_Rate | 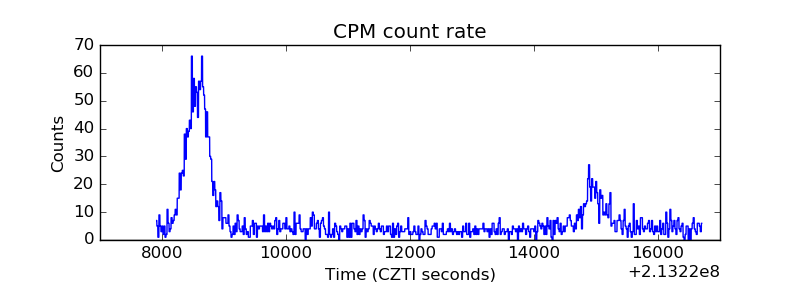 |
| CZT Counter | 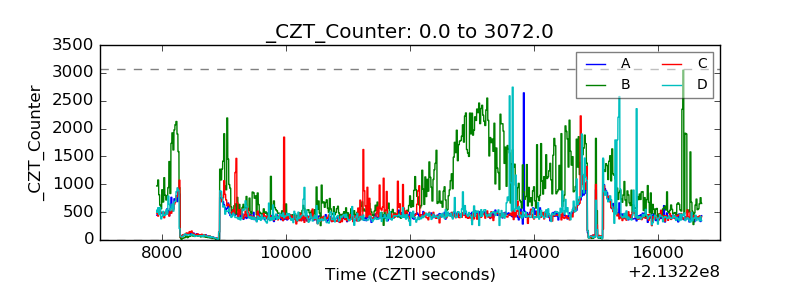 |
| +2.5 Volts monitor |  |
| +5 Volts monitor |  |
| _ROLL_ROT | 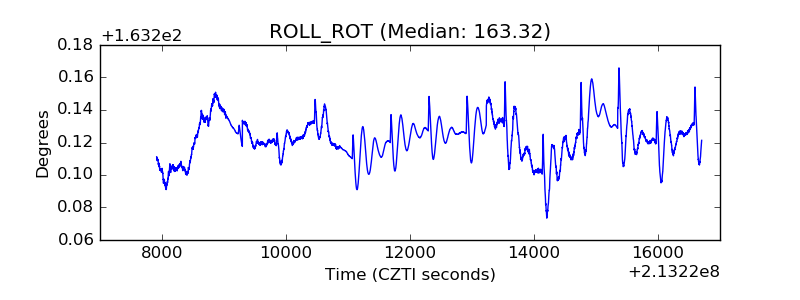 |
| _Roll_DEC | 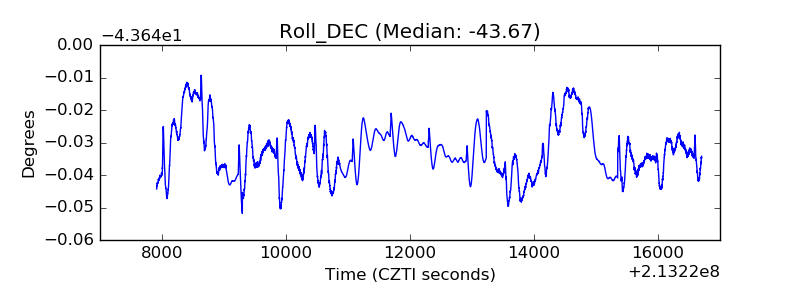 |
| _Roll_RA | 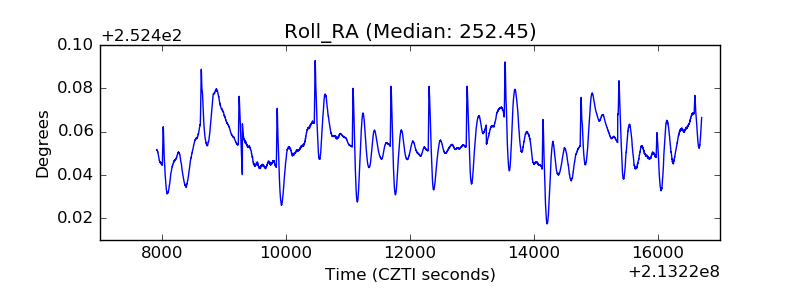 |
| Veto Counter | 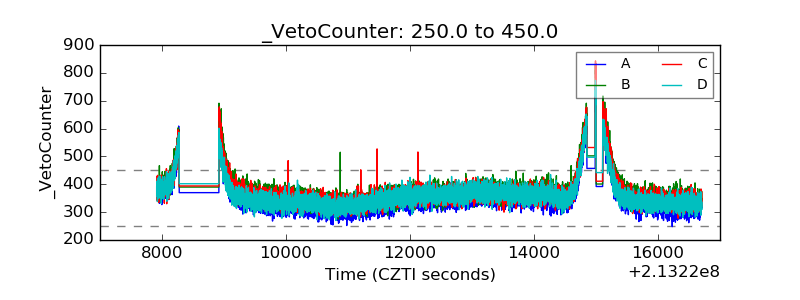 |