| Param | Original file | Final file |
|---|---|---|
| Filename | modeM0/AS1A02_162T01_9000000704_05505cztM0_level2.evt | modeM0/AS1A02_162T01_9000000704_05505cztM0_level2_quad_clean.evt |
| Size (bytes) | 628,614,720 | 73,152,000 |
| Size | 599.5 MB | 69.8 MB |
| Events in quadrant A | 3,598,523 | 424,925 |
| Events in quadrant B | 6,687,694 | 409,308 |
| Events in quadrant C | 3,817,956 | 429,228 |
| Events in quadrant D | 4,399,089 | 403,182 |
| Mode M0 | |||
|---|---|---|---|
| Quadrant | BADHDUFLAG | Total packets | Discarded packets |
| A | 0 | 16498 | 9 |
| B | 0 | 25417 | 24 |
| C | 0 | 17138 | 2 |
| D | 0 | 18962 | 2 |
| Mode SS | |||
|---|---|---|---|
| Quadrant | BADHDUFLAG | Total packets | Discarded packets |
| A | 0 | 160 | 0 |
| B | 0 | 160 | 2 |
| C | 0 | 160 | 0 |
| D | 0 | 160 | 0 |
| Mode M9 | |||
|---|---|---|---|
| Quadrant | BADHDUFLAG | Total packets | Discarded packets |
| A | 0 | 2 | 0 |
| B | 0 | 2 | 0 |
| C | 0 | 2 | 0 |
| D | 0 | 2 | 0 |
| Quadrant | Total seconds | Saturated seconds | Saturation percentage |
|---|---|---|---|
| A | 7890 | 185 | 2.344740% |
| B | 7888 | 659 | 8.354462% |
| C | 7893 | 225 | 2.850627% |
| D | 7893 | 317 | 4.016217% |
Noise dominated data is calculated using 1-second bins in cleaned event files. If a bin has >2000 counts, and if more than 50% of those come from <1% of pixels, then it is considered to be noise-dominated and hence unusable.
| Quadrant | # 1 sec bins | Bins with >0 counts | Bins with >2000 counts | High rate bins dominated by noise | Noise dominated (total time) | Noise dominated (detector-on time) | Marked lightcurve |
|---|---|---|---|---|---|---|---|
| A | 8088 | 7895 | 1 | 1 | 0.01% | 0.01% | 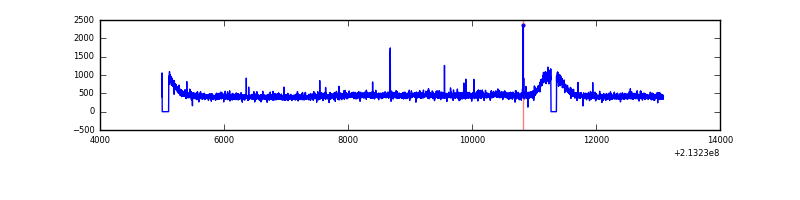 |
| B | 8088 | 7895 | 195 | 195 | 2.41% | 2.47% | 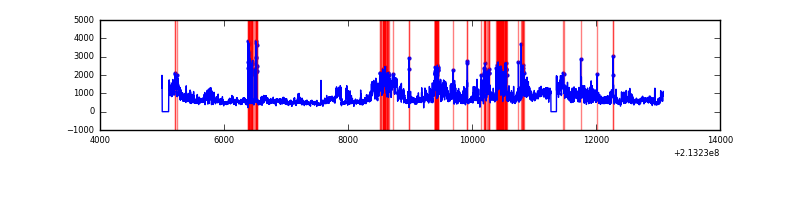 |
| C | 8088 | 7895 | 33 | 33 | 0.41% | 0.42% | 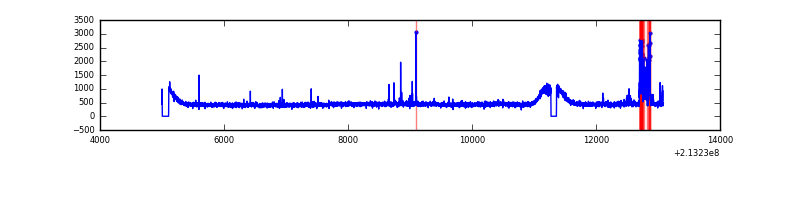 |
| D | 8088 | 7895 | 124 | 124 | 1.53% | 1.57% | 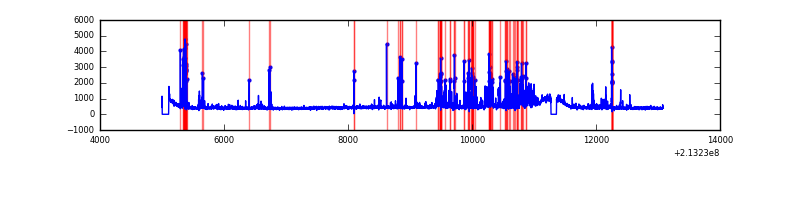 |
Top three noisy pixels from each quadrant. If the there are fewer than three noisy pixels in the level2.evt file, extra rows are filled as -1
| Pixel properties | Quadrant properties | ||||||
|---|---|---|---|---|---|---|---|
| Quadrant | DetID | PixID | Counts | Sigma | Mean | Median | Sigma |
| A | 0 | 50 | 11745 | 56.26 | 928 | 906 | 192.7 |
| A | 0 | 226 | 9145 | 42.76 | 928 | 906 | 192.7 |
| A | 12 | 194 | 9066 | 42.35 | 928 | 906 | 192.7 |
| B | 15 | 255 | 2337364 | 13026.69 | 921 | 899 | 179.4 |
| B | 15 | 204 | 518287 | 2884.64 | 921 | 899 | 179.4 |
| B | 4 | 48 | 166054 | 920.8 | 921 | 899 | 179.4 |
| C | 9 | 247 | 214081 | 1005.26 | 905 | 908 | 212.1 |
| C | 1 | 16 | 55949 | 259.56 | 905 | 908 | 212.1 |
| C | 13 | 61 | 7346 | 30.36 | 905 | 908 | 212.1 |
| D | 2 | 152 | 552550 | 2465.86 | 898 | 867 | 223.7 |
| D | 2 | 136 | 219910 | 979.06 | 898 | 867 | 223.7 |
| D | 2 | 33 | 125202 | 555.74 | 898 | 867 | 223.7 |
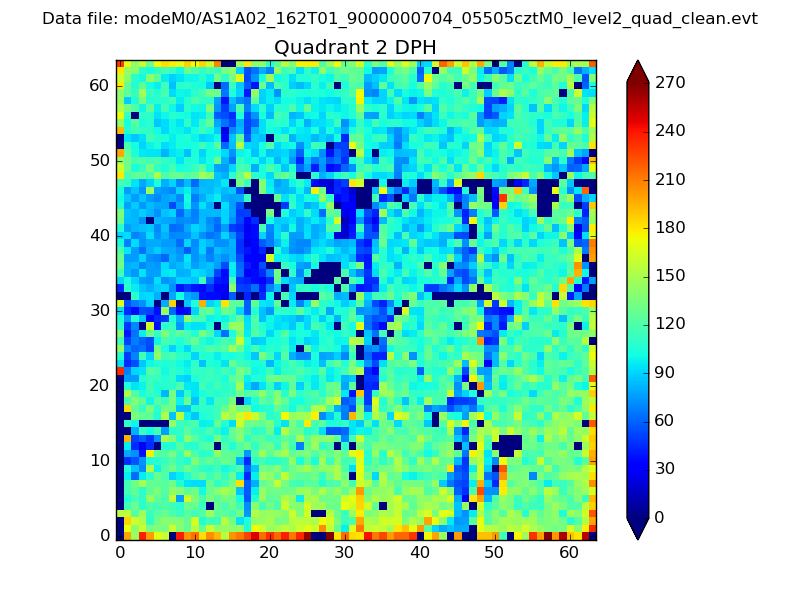
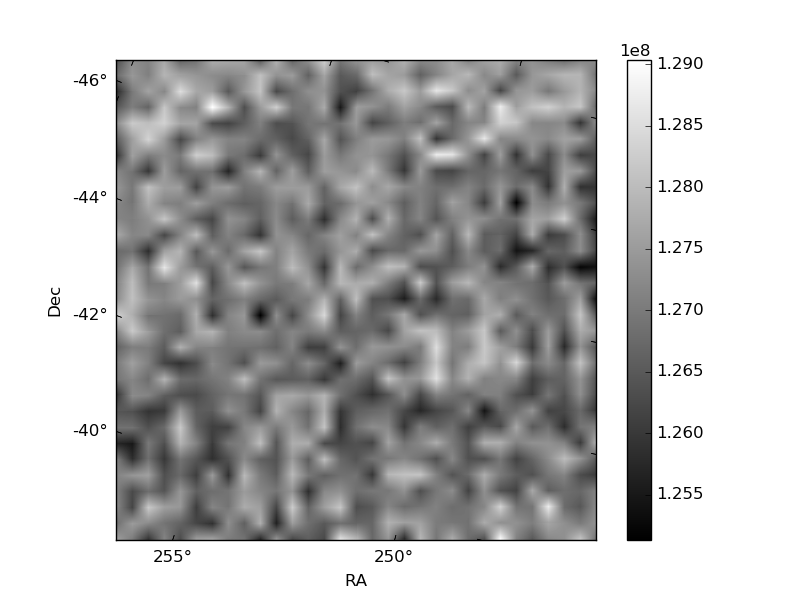
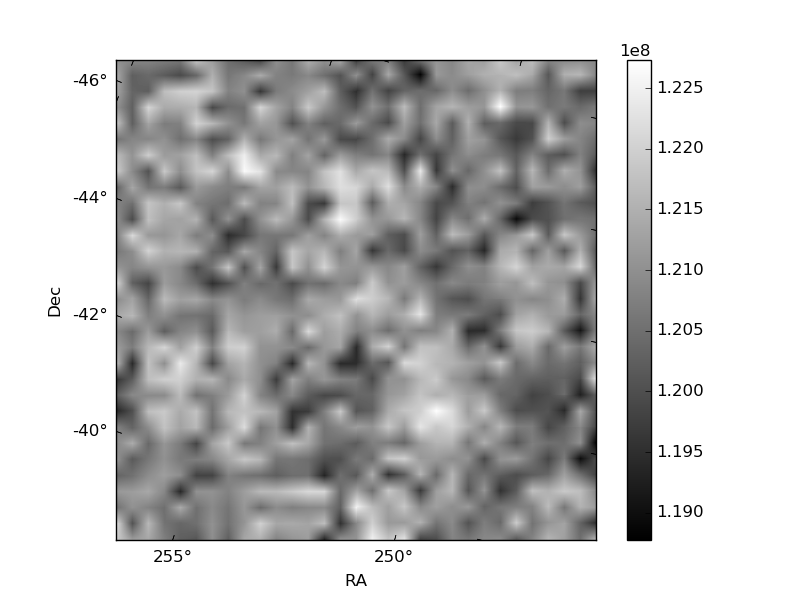
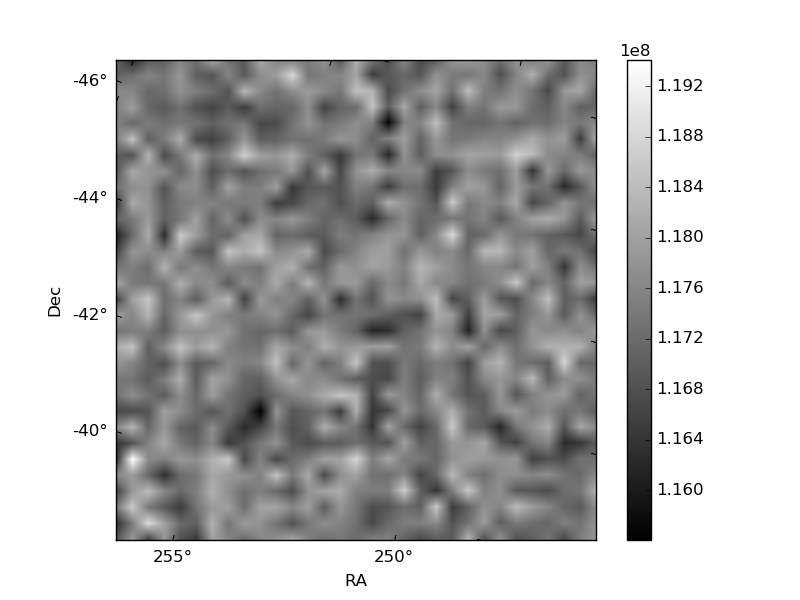
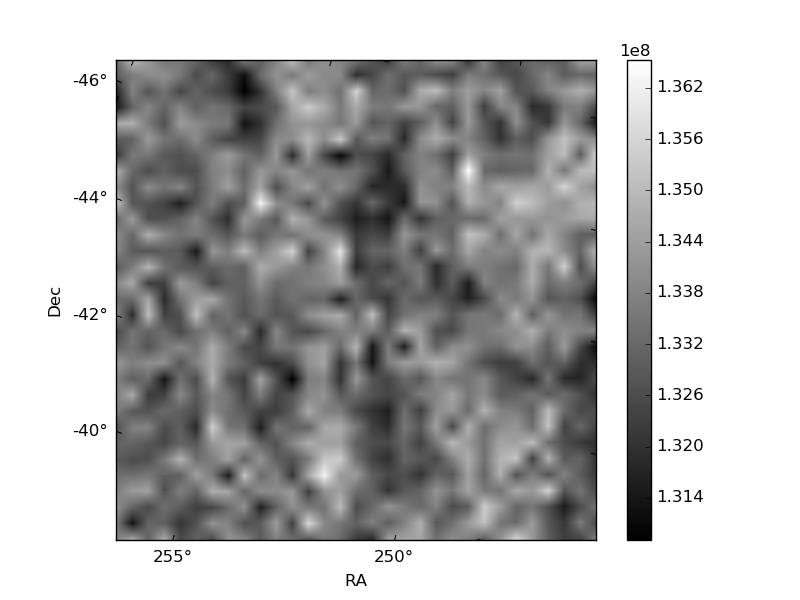
Histogram calculated using DETX and DETY for each event in the final _common_clean file
| Quadrant A | 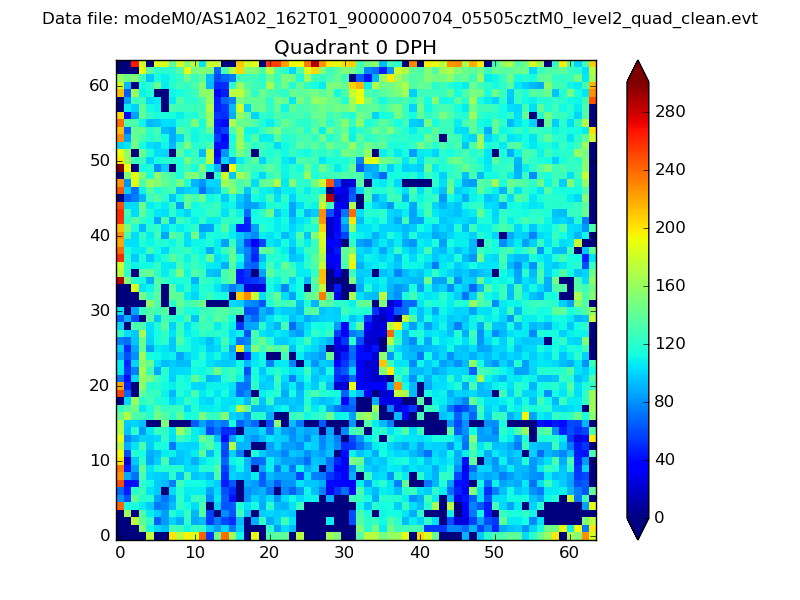 |
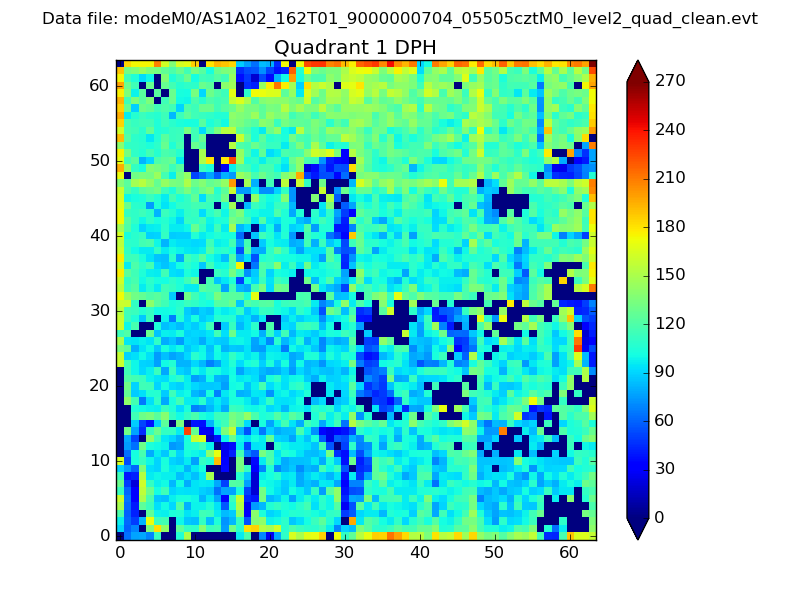 |
Quadrant B |
|---|---|---|---|
| Quadrant D | 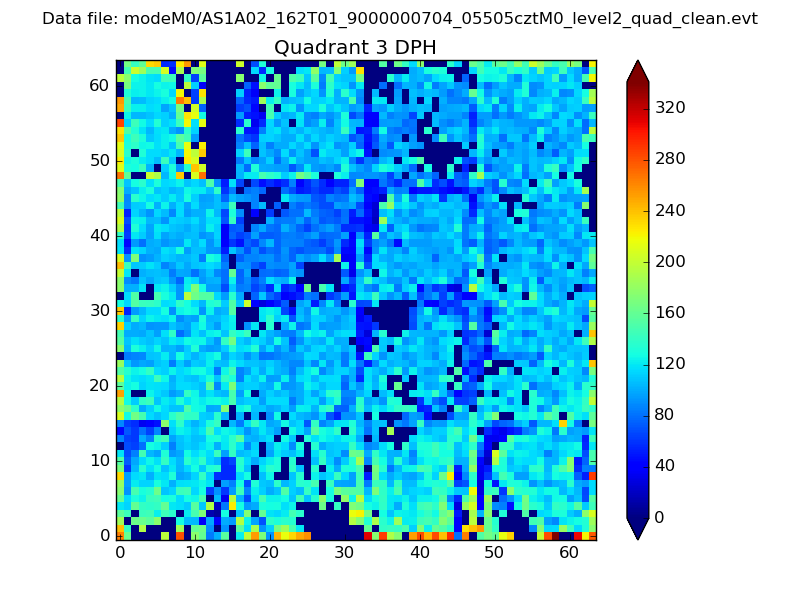 |
 |
Quadrant C |
| Plot type | Count rate plots | Images |
|---|---|---|
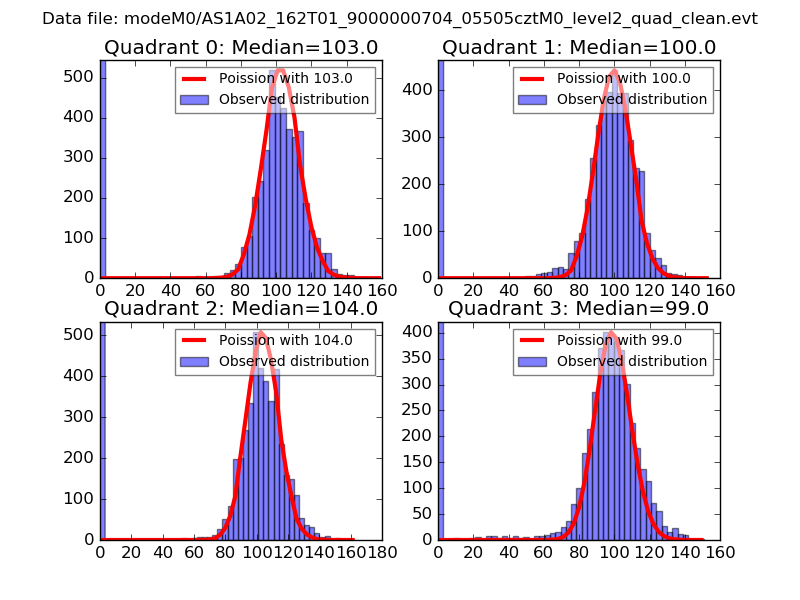
| Comparison with Poisson distribution Blue bars denote a histogram of data divided into 1 sec bins. Red curve is a Poisson curve with rate = median count rate of data. |
 |
 |
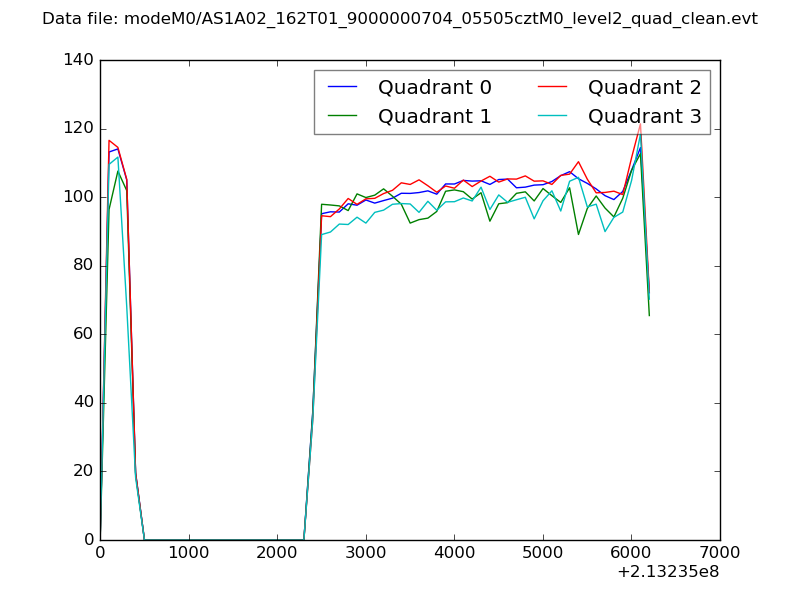
| Quadrant-wise count rates Data is divided into 100 sec bins |
 |
|
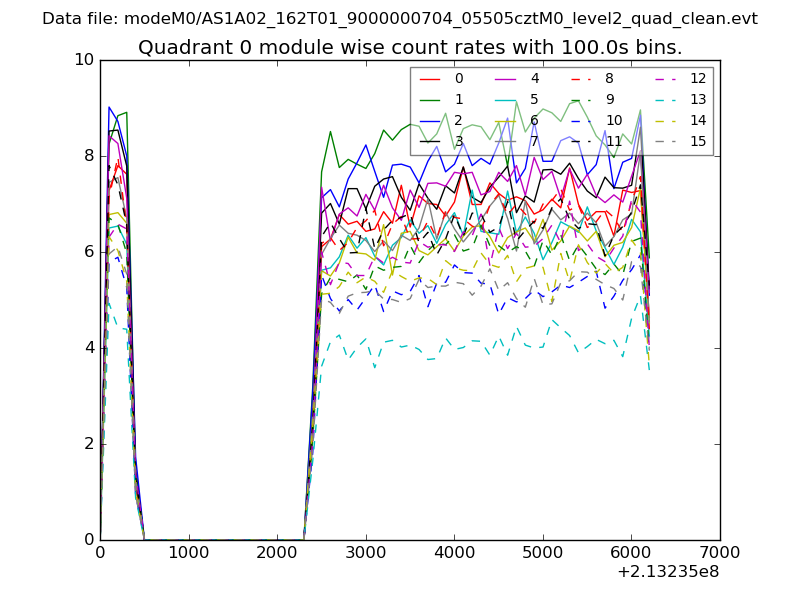
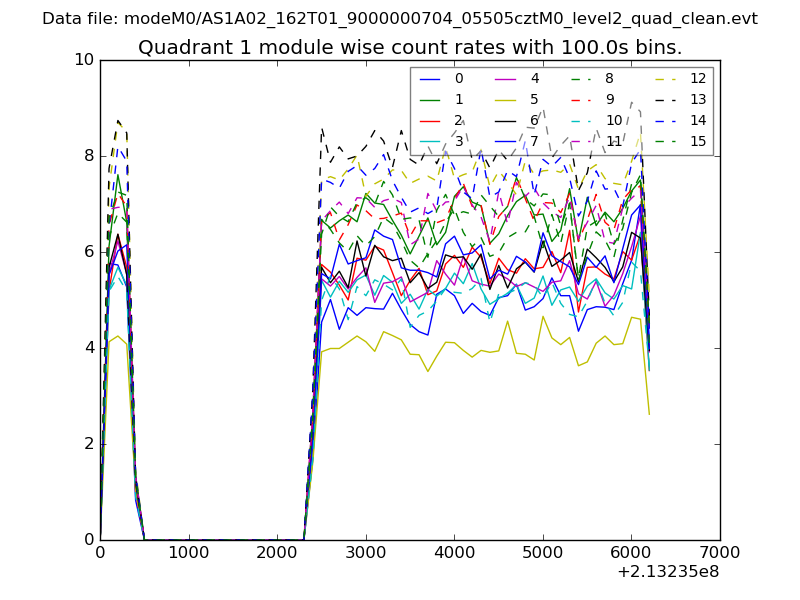
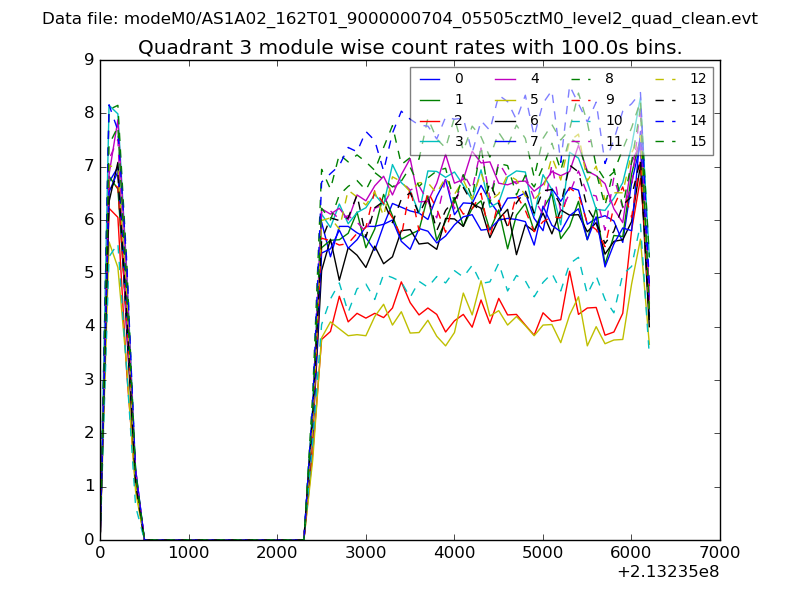
| Module-wise count rates for Quadrant A Data is divided into 100 sec bins |
 |
 |
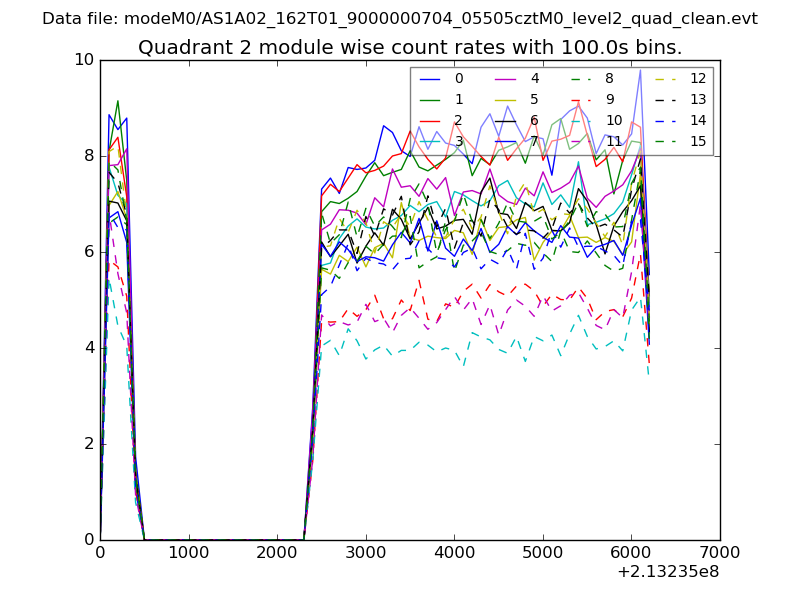
| Module-wise count rates for Quadrant B Data is divided into 100 sec bins |
 |
 |
| Module-wise count rates for Quadrant C Data is divided into 100 sec bins |
 |
 |
| Module-wise count rates for Quadrant D Data is divided into 100 sec bins |
 |
 |
| Parameter | Plot |
|---|---|
| CZT HV Monitor | 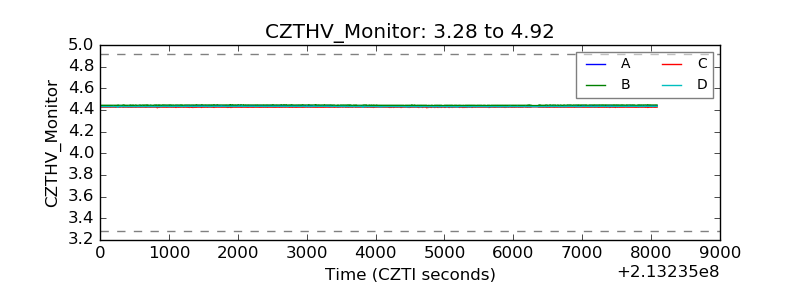 |
| D_VDD | 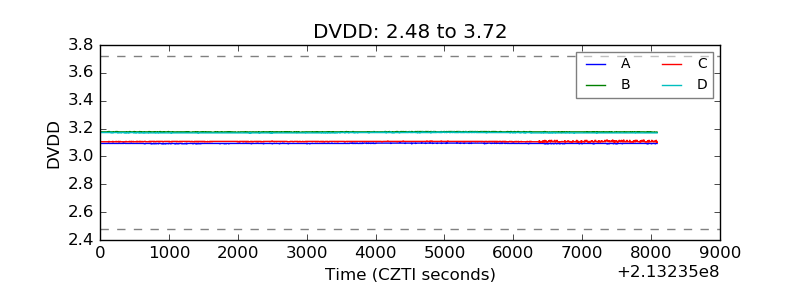 |
| Temperature 1 | 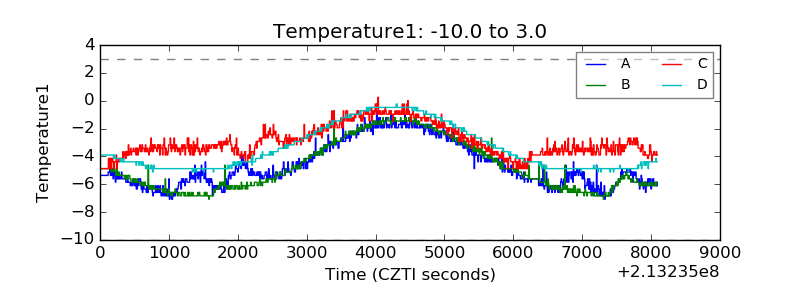 |
| Veto HV Monitor | 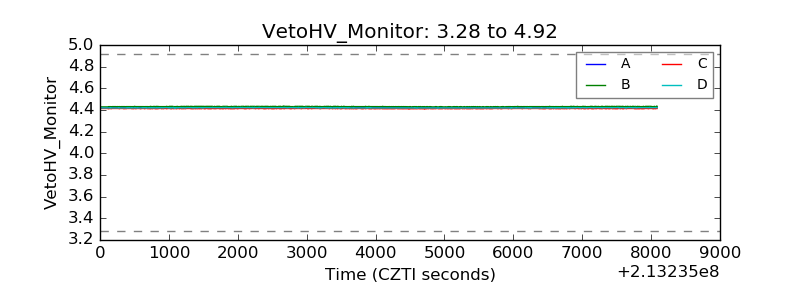 |
| Veto LLD | 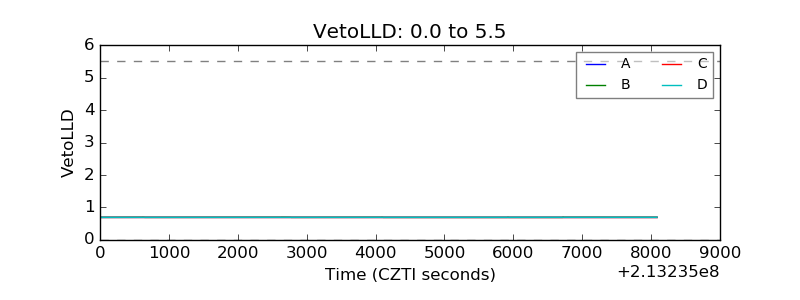 |
| Alpha Counter | 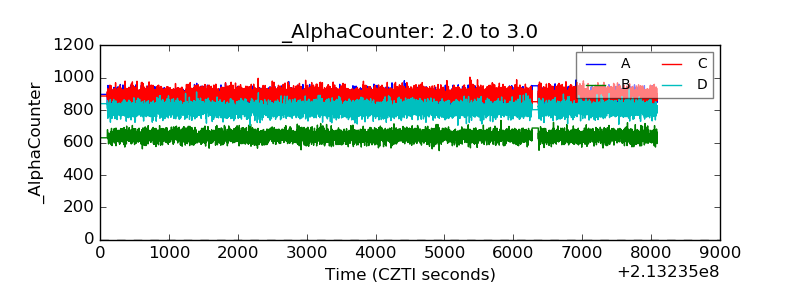 |
| _CPM_Rate | 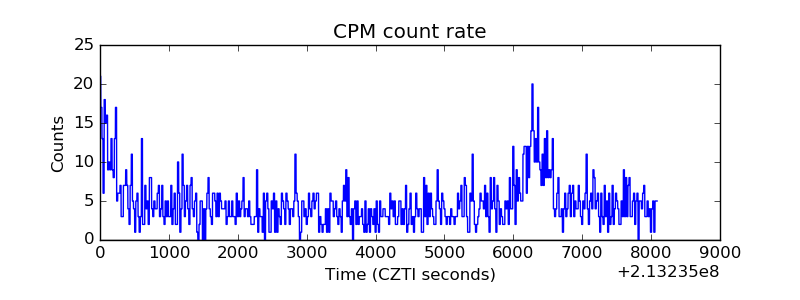 |
| CZT Counter | 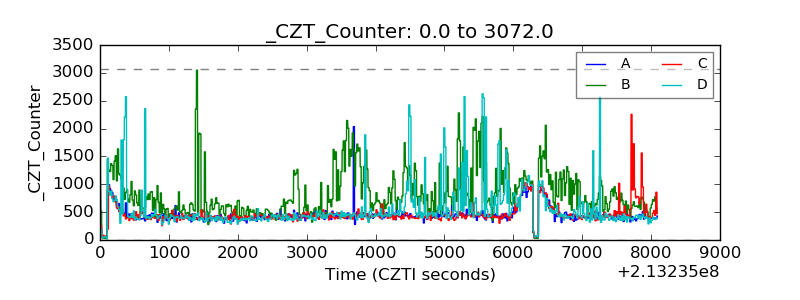 |
| +2.5 Volts monitor |  |
| +5 Volts monitor | 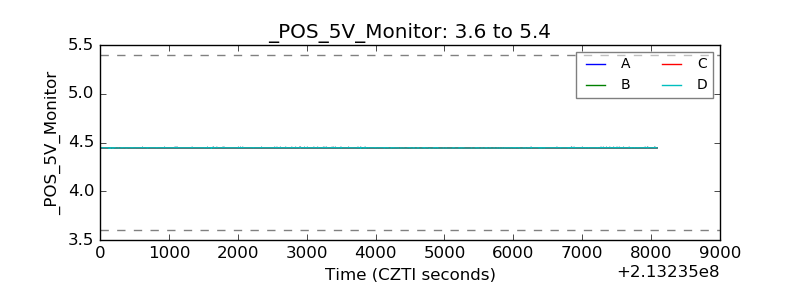 |
| _ROLL_ROT | 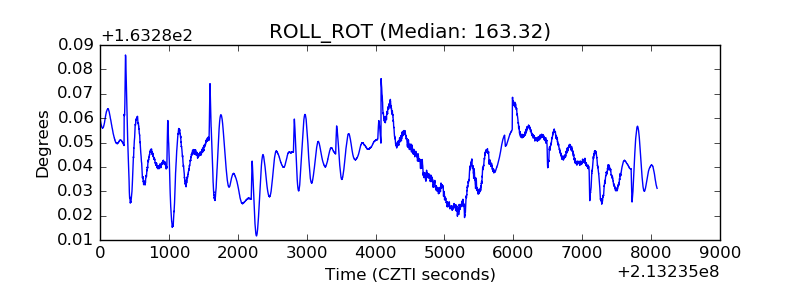 |
| _Roll_DEC | 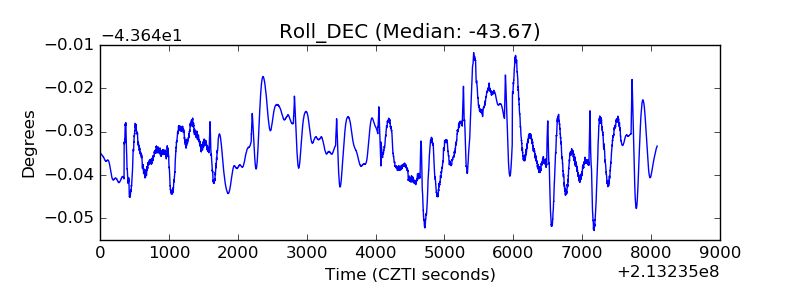 |
| _Roll_RA | 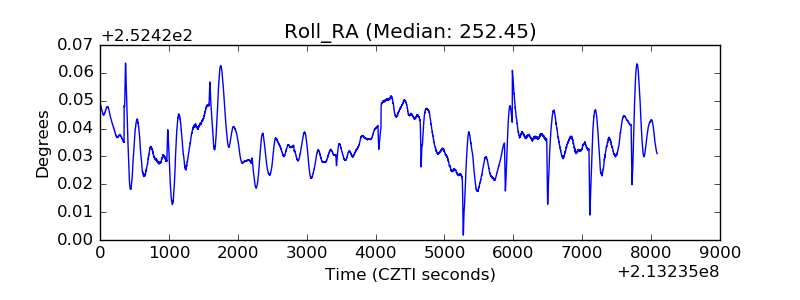 |
| Veto Counter | 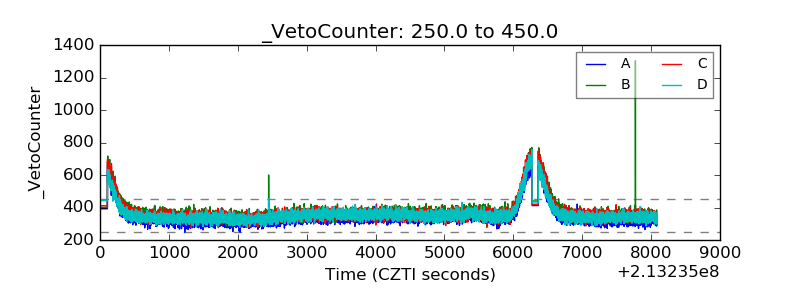 |