| Param | Original file | Final file |
|---|---|---|
| Filename | modeM0/AS1A02_162T01_9000000704_05508cztM0_level2.evt | modeM0/AS1A02_162T01_9000000704_05508cztM0_level2_quad_clean.evt |
| Size (bytes) | 1,066,553,280 | 147,006,720 |
| Size | 1017.1 MB | 140.2 MB |
| Events in quadrant A | 6,335,324 | 931,315 |
| Events in quadrant B | 11,270,505 | 751,861 |
| Events in quadrant C | 6,964,323 | 936,443 |
| Events in quadrant D | 6,809,279 | 892,806 |
| Mode M0 | |||
|---|---|---|---|
| Quadrant | BADHDUFLAG | Total packets | Discarded packets |
| A | 0 | 36932 | 8061 |
| B | 0 | 65935 | 24033 |
| C | 0 | 38917 | 8652 |
| D | 0 | 39169 | 8933 |
| Mode SS | |||
|---|---|---|---|
| Quadrant | BADHDUFLAG | Total packets | Discarded packets |
| A | 0 | 362 | 71 |
| B | 0 | 363 | 51 |
| C | 0 | 364 | 90 |
| D | 0 | 363 | 67 |
| Mode M9 | |||
|---|---|---|---|
| Quadrant | BADHDUFLAG | Total packets | Discarded packets |
| A | 0 | 16 | 0 |
| B | 0 | 16 | 1 |
| C | 0 | 16 | 1 |
| D | 0 | 16 | 2 |
| Quadrant | Total seconds | Saturated seconds | Saturation percentage |
|---|---|---|---|
| A | 13938 | 366 | 2.625915% |
| B | 12300 | 1431 | 11.634146% |
| C | 13894 | 417 | 3.001296% |
| D | 13868 | 369 | 2.660802% |
Noise dominated data is calculated using 1-second bins in cleaned event files. If a bin has >2000 counts, and if more than 50% of those come from <1% of pixels, then it is considered to be noise-dominated and hence unusable.
| Quadrant | # 1 sec bins | Bins with >0 counts | Bins with >2000 counts | High rate bins dominated by noise | Noise dominated (total time) | Noise dominated (detector-on time) | Marked lightcurve |
|---|---|---|---|---|---|---|---|
| A | 19434 | 16031 | 6 | 6 | 0.03% | 0.04% | 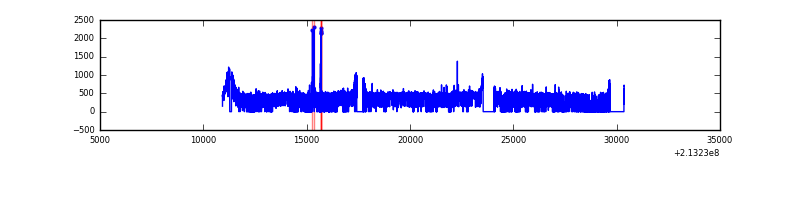 |
| B | 19435 | 14683 | 440 | 440 | 2.26% | 3.00% | 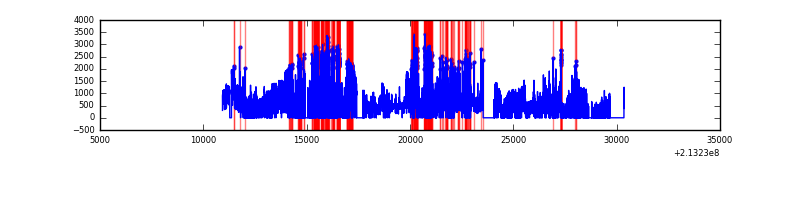 |
| C | 19435 | 16036 | 45 | 45 | 0.23% | 0.28% | 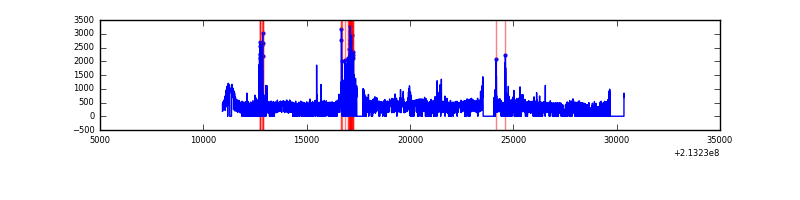 |
| D | 19435 | 16002 | 33 | 33 | 0.17% | 0.21% | 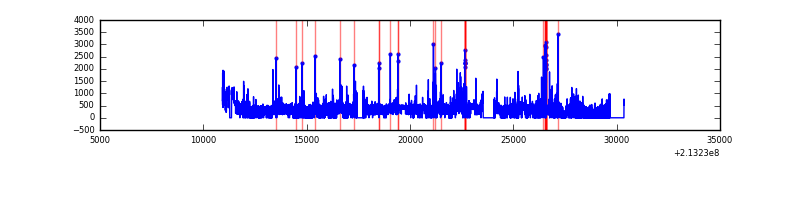 |
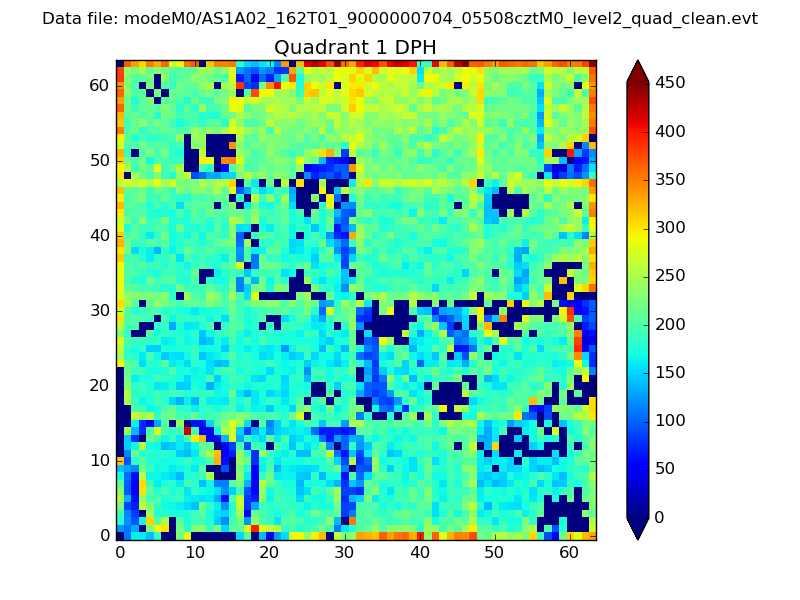
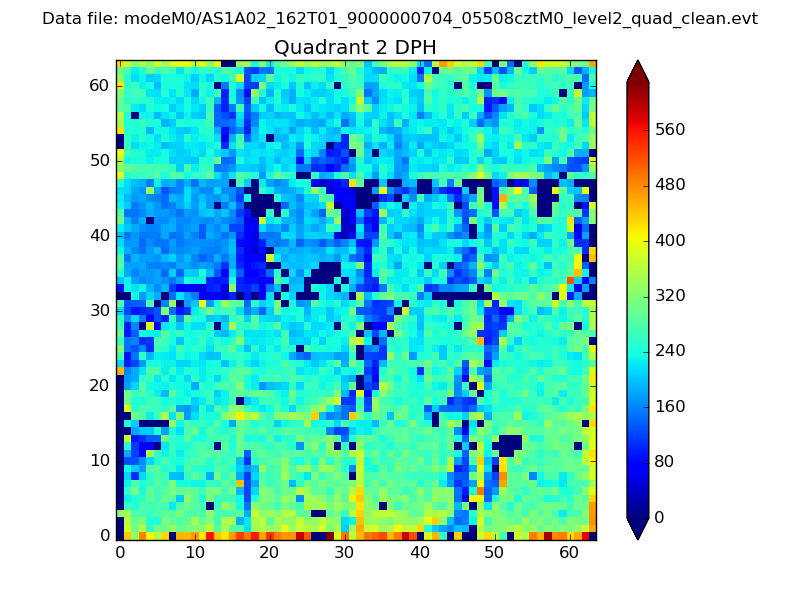
Top three noisy pixels from each quadrant. If the there are fewer than three noisy pixels in the level2.evt file, extra rows are filled as -1
| Pixel properties | Quadrant properties | ||||||
|---|---|---|---|---|---|---|---|
| Quadrant | DetID | PixID | Counts | Sigma | Mean | Median | Sigma |
| A | 0 | 50 | 49082 | 142.17 | 1626 | 1588 | 334.1 |
| A | 12 | 194 | 16289 | 44.01 | 1626 | 1588 | 334.1 |
| A | 0 | 226 | 15906 | 42.86 | 1626 | 1588 | 334.1 |
| B | 15 | 255 | 5089579 | 18432.95 | 1417 | 1381 | 276.0 |
| B | 15 | 204 | 518496 | 1873.35 | 1417 | 1381 | 276.0 |
| B | 11 | 51 | 60750 | 215.08 | 1417 | 1381 | 276.0 |
| C | 9 | 247 | 558550 | 1512.48 | 1580 | 1584 | 368.2 |
| C | 1 | 16 | 192386 | 518.14 | 1580 | 1584 | 368.2 |
| C | 8 | 128 | 21375 | 53.74 | 1580 | 1584 | 368.2 |
| D | 2 | 152 | 233858 | 596.54 | 1584 | 1535 | 389.4 |
| D | 2 | 136 | 159143 | 404.7 | 1584 | 1535 | 389.4 |
| D | 12 | 233 | 128847 | 326.9 | 1584 | 1535 | 389.4 |
Histogram calculated using DETX and DETY for each event in the final _common_clean file
| Quadrant A | 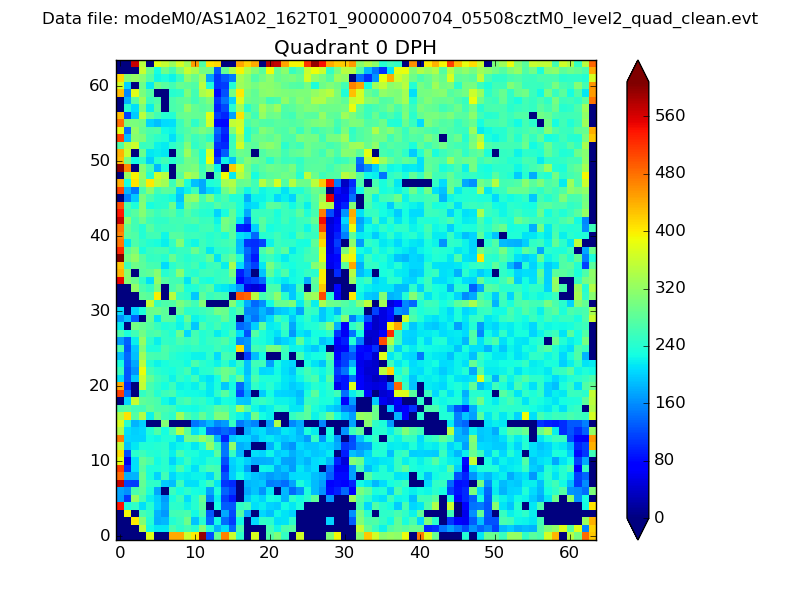 |
 |
Quadrant B |
|---|---|---|---|
| Quadrant D | 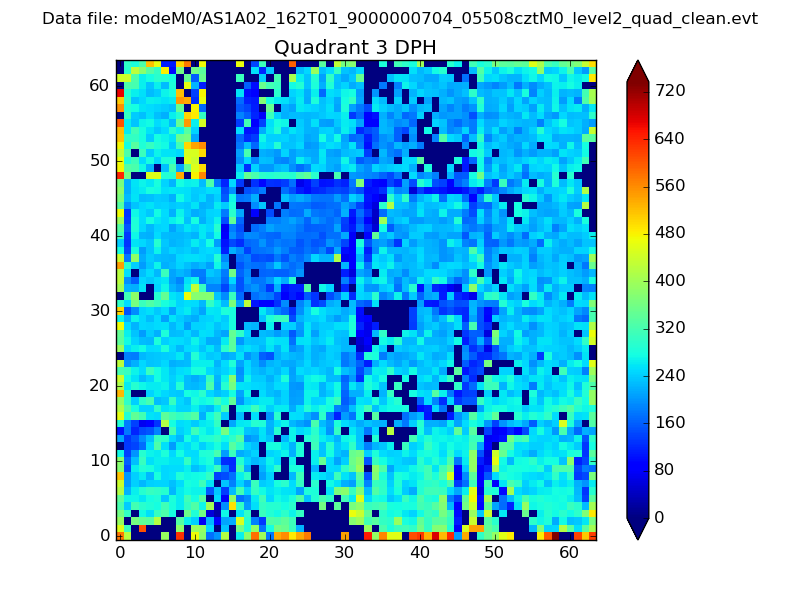 |
 |
Quadrant C |
| Plot type | Count rate plots | Images |
|---|---|---|
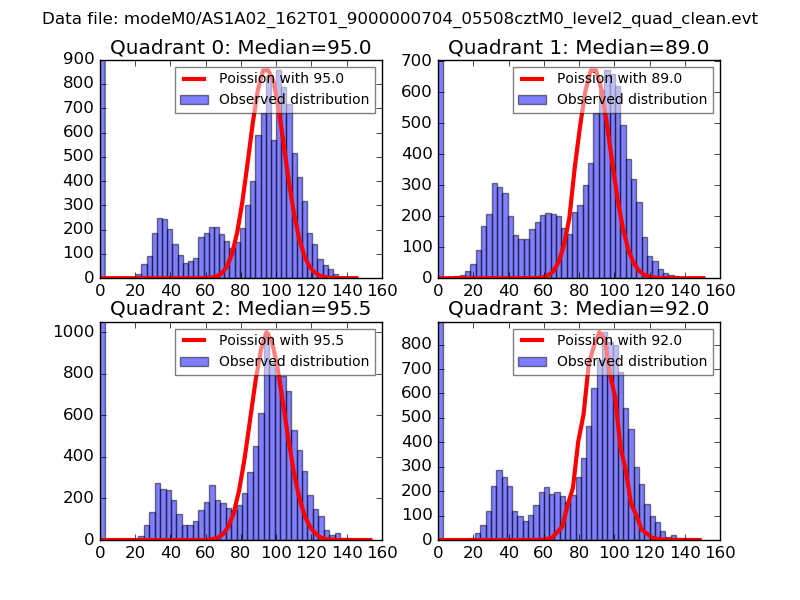
| Comparison with Poisson distribution Blue bars denote a histogram of data divided into 1 sec bins. Red curve is a Poisson curve with rate = median count rate of data. |
 |
 |
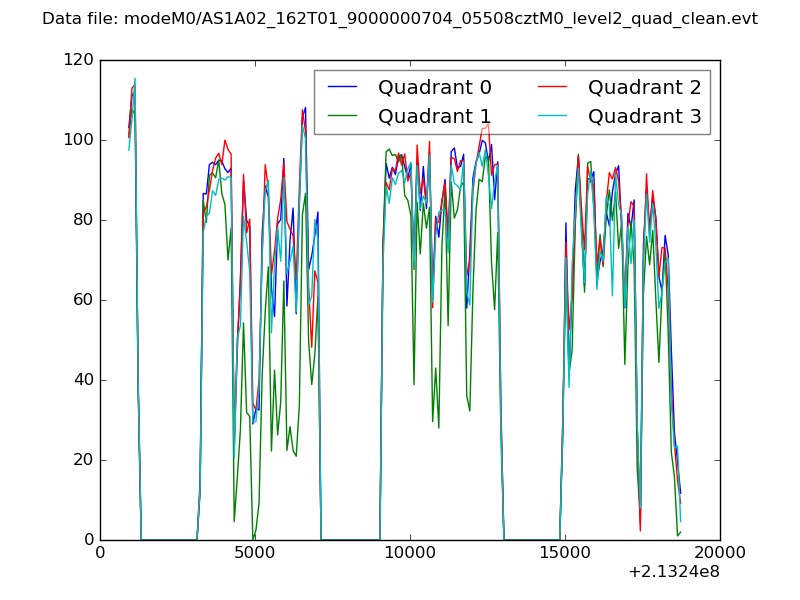
| Quadrant-wise count rates Data is divided into 100 sec bins |
 |
|
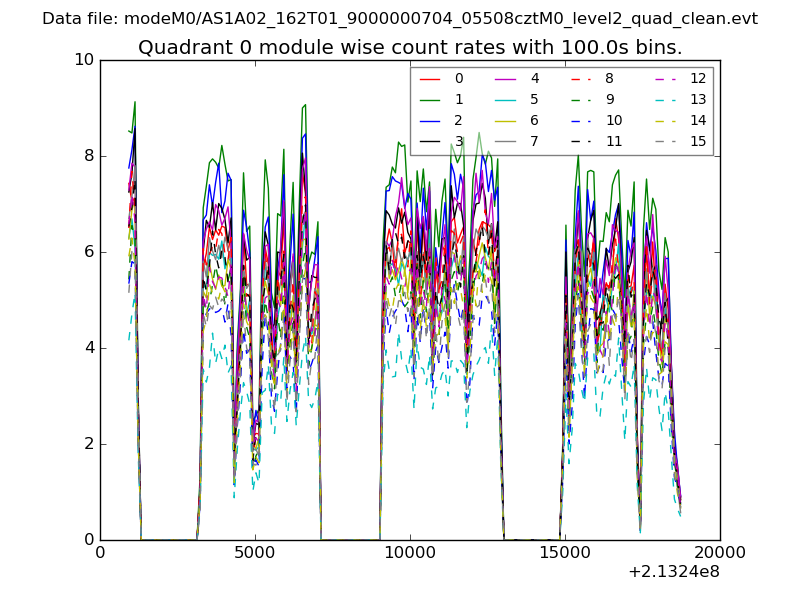
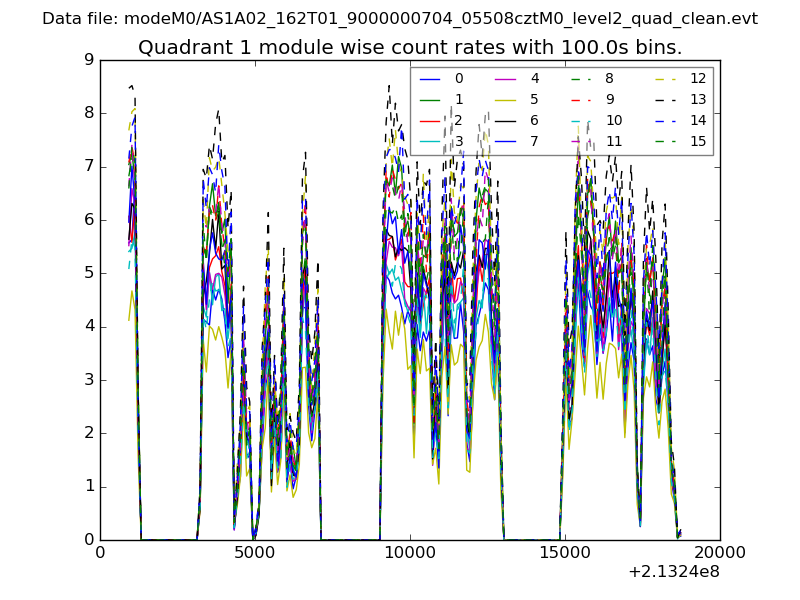
| Module-wise count rates for Quadrant A Data is divided into 100 sec bins |
 |
 |
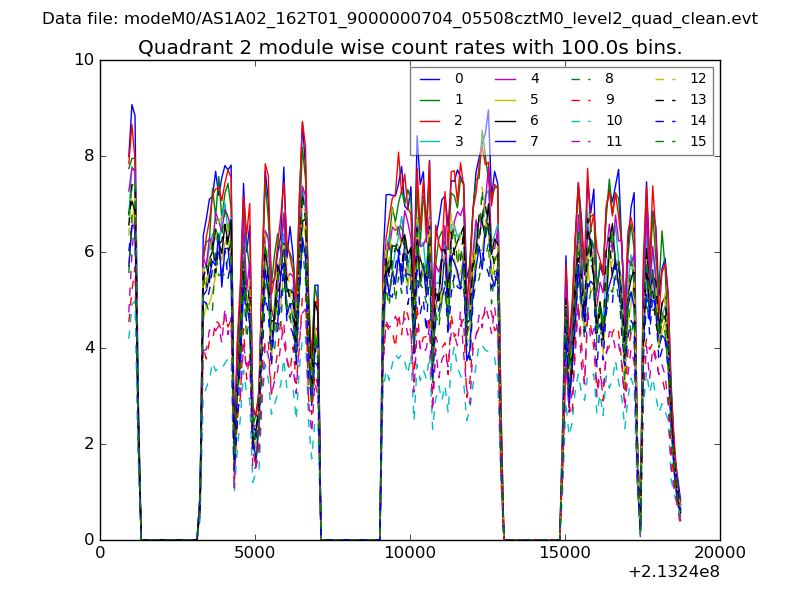
| Module-wise count rates for Quadrant B Data is divided into 100 sec bins |
 |
 |
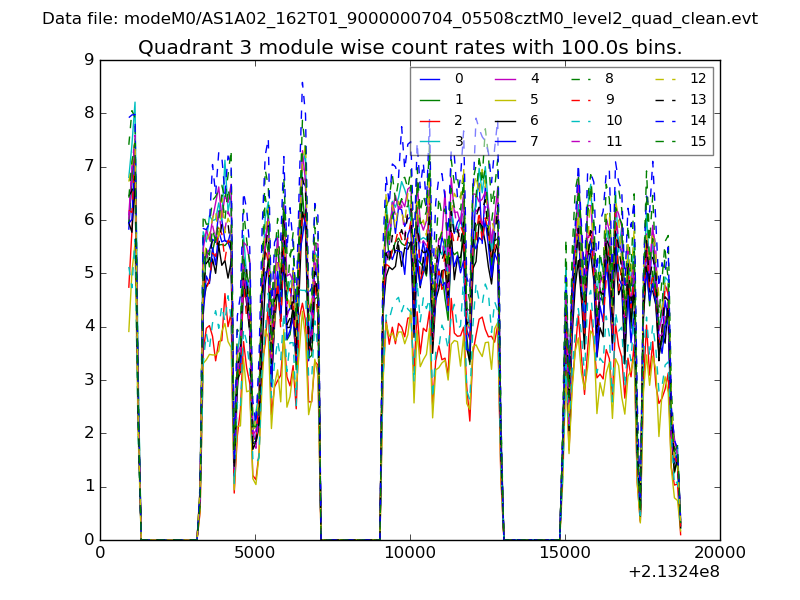
| Module-wise count rates for Quadrant C Data is divided into 100 sec bins |
 |
 |
| Module-wise count rates for Quadrant D Data is divided into 100 sec bins |
 |
 |
| Parameter | Plot |
|---|---|
| CZT HV Monitor | 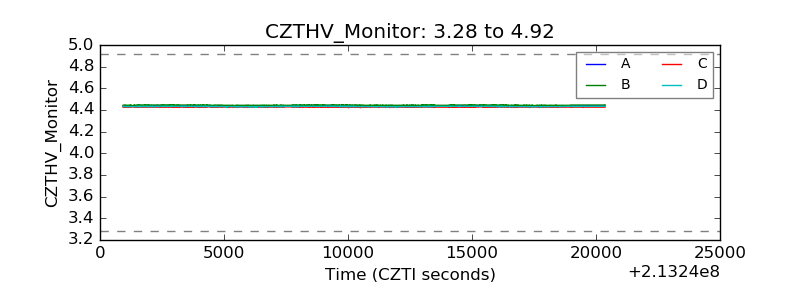 |
| D_VDD | 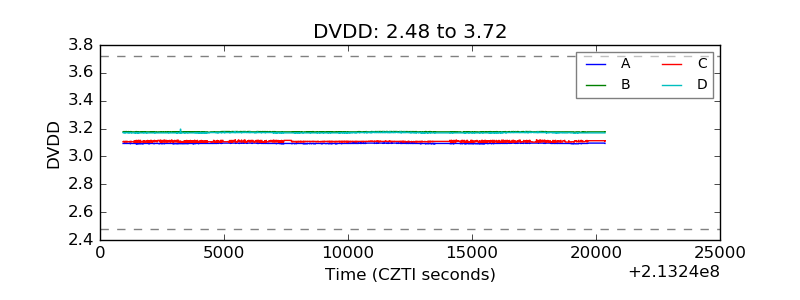 |
| Temperature 1 | 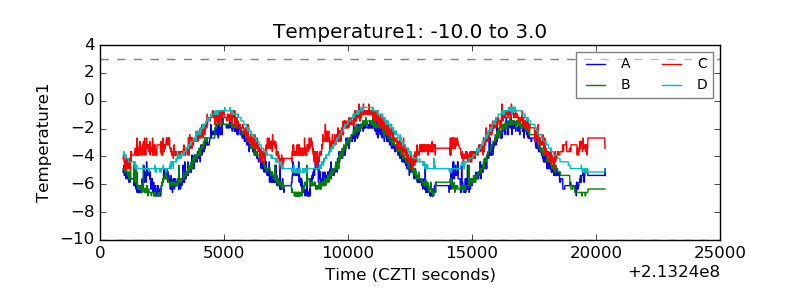 |
| Veto HV Monitor | 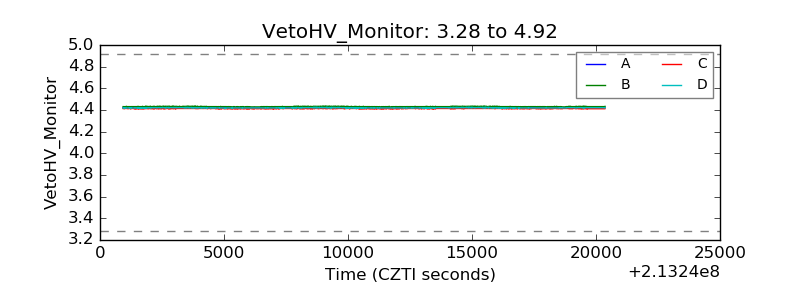 |
| Veto LLD | 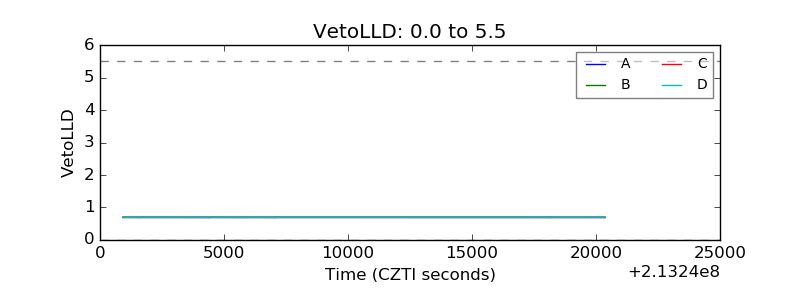 |
| Alpha Counter |  |
| _CPM_Rate | 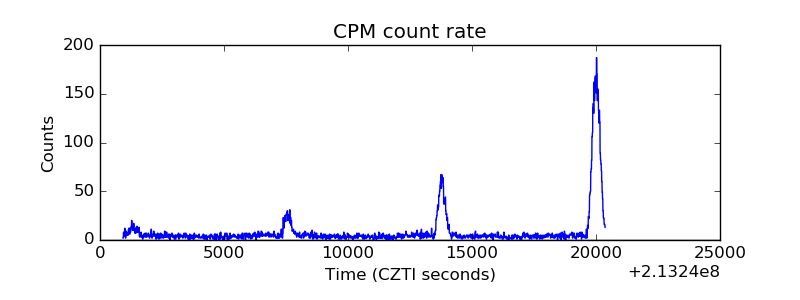 |
| CZT Counter | 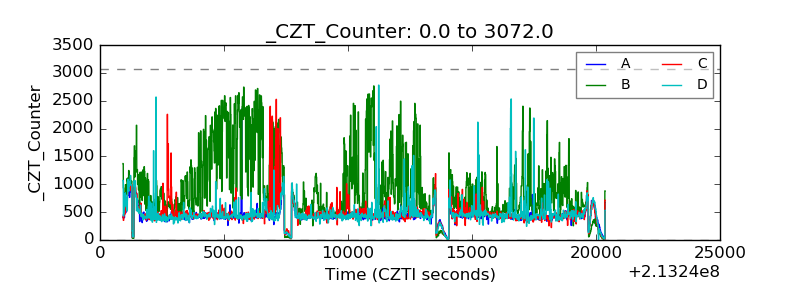 |
| +2.5 Volts monitor |  |
| +5 Volts monitor |  |
| _ROLL_ROT | 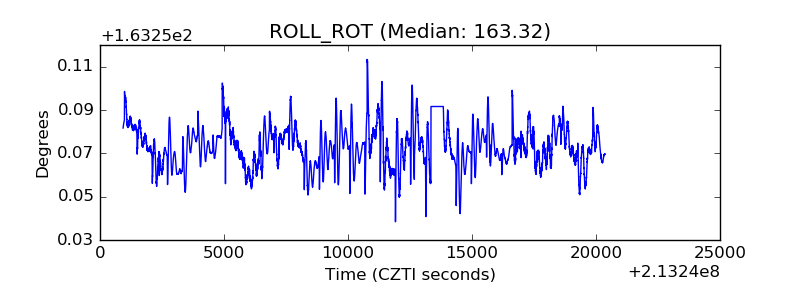 |
| _Roll_DEC | 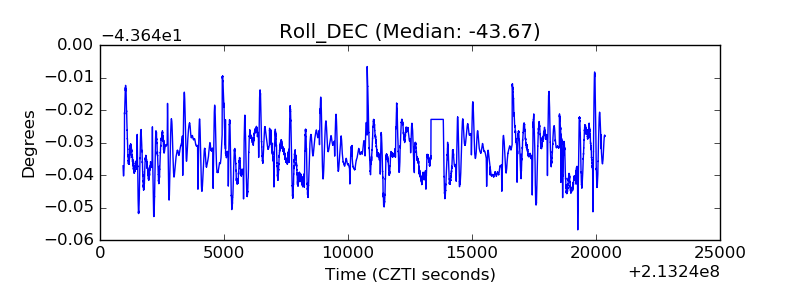 |
| _Roll_RA | 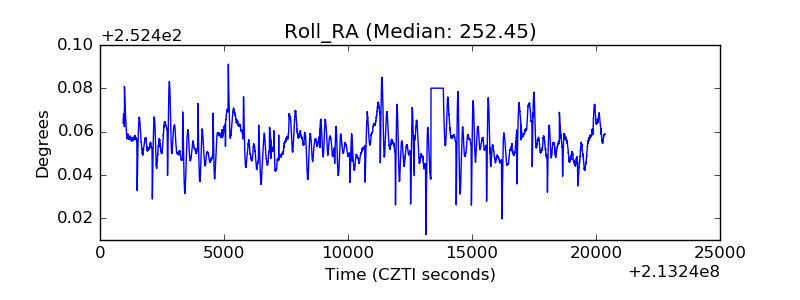 |
| Veto Counter | 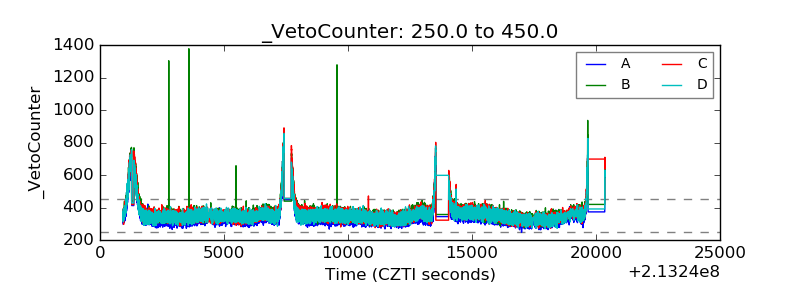 |