| Param | Original file | Final file |
|---|---|---|
| Filename | modeM0/AS1A02_162T01_9000000704_05509cztM0_level2.evt | modeM0/AS1A02_162T01_9000000704_05509cztM0_level2_quad_clean.evt |
| Size (bytes) | 665,838,720 | 86,071,680 |
| Size | 635.0 MB | 82.1 MB |
| Events in quadrant A | 3,252,681 | 553,191 |
| Events in quadrant B | 8,979,663 | 480,662 |
| Events in quadrant C | 3,341,818 | 556,024 |
| Events in quadrant D | 4,114,185 | 525,546 |
| Mode M0 | |||
|---|---|---|---|
| Quadrant | BADHDUFLAG | Total packets | Discarded packets |
| A | 0 | 14572 | 108 |
| B | 0 | 32154 | 629 |
| C | 0 | 14700 | 126 |
| D | 0 | 17137 | 167 |
| Mode SS | |||
|---|---|---|---|
| Quadrant | BADHDUFLAG | Total packets | Discarded packets |
| A | 0 | 146 | 0 |
| B | 0 | 146 | 0 |
| C | 0 | 146 | 0 |
| D | 0 | 146 | 0 |
| Mode M9 | |||
|---|---|---|---|
| Quadrant | BADHDUFLAG | Total packets | Discarded packets |
| A | 0 | 8 | 0 |
| B | 0 | 8 | 0 |
| C | 0 | 8 | 0 |
| D | 0 | 9 | 0 |
| Quadrant | Total seconds | Saturated seconds | Saturation percentage |
|---|---|---|---|
| A | 7048 | 101 | 1.433031% |
| B | 6978 | 1728 | 24.763543% |
| C | 7042 | 59 | 0.837830% |
| D | 7035 | 223 | 3.169865% |
Noise dominated data is calculated using 1-second bins in cleaned event files. If a bin has >2000 counts, and if more than 50% of those come from <1% of pixels, then it is considered to be noise-dominated and hence unusable.
| Quadrant | # 1 sec bins | Bins with >0 counts | Bins with >2000 counts | High rate bins dominated by noise | Noise dominated (total time) | Noise dominated (detector-on time) | Marked lightcurve |
|---|---|---|---|---|---|---|---|
| A | 7954 | 7100 | 10 | 10 | 0.13% | 0.14% | 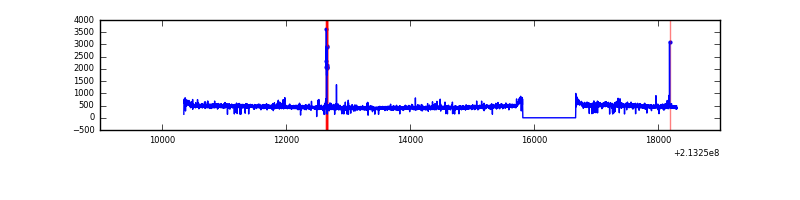 |
| B | 7954 | 7090 | 1433 | 1433 | 18.02% | 20.21% | 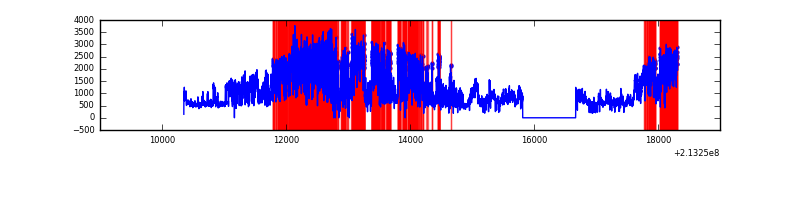 |
| C | 7954 | 7097 | 3 | 3 | 0.04% | 0.04% | 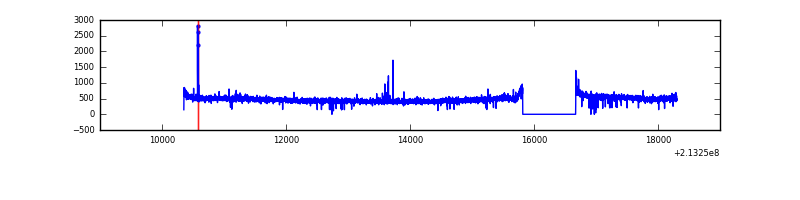 |
| D | 7954 | 7099 | 142 | 142 | 1.79% | 2.00% | 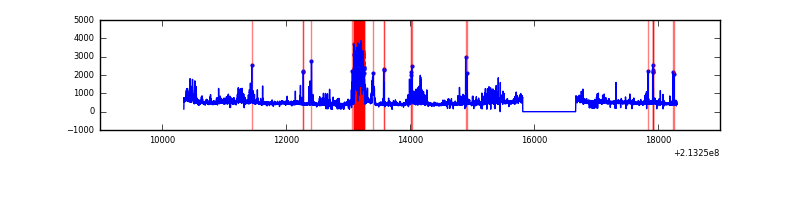 |
Top three noisy pixels from each quadrant. If the there are fewer than three noisy pixels in the level2.evt file, extra rows are filled as -1
| Pixel properties | Quadrant properties | ||||||
|---|---|---|---|---|---|---|---|
| Quadrant | DetID | PixID | Counts | Sigma | Mean | Median | Sigma |
| A | 0 | 50 | 39192 | 225.34 | 829 | 810 | 170.3 |
| A | 3 | 1 | 15846 | 88.27 | 829 | 810 | 170.3 |
| A | 12 | 194 | 8224 | 43.53 | 829 | 810 | 170.3 |
| B | 15 | 255 | 5275204 | 35113.78 | 776 | 755 | 150.2 |
| B | 15 | 204 | 576897 | 3835.57 | 776 | 755 | 150.2 |
| B | 15 | 54 | 24863 | 160.5 | 776 | 755 | 150.2 |
| C | 1 | 16 | 177055 | 938.67 | 804 | 808 | 187.8 |
| C | 9 | 247 | 12775 | 63.73 | 804 | 808 | 187.8 |
| C | 9 | 221 | 8267 | 39.73 | 804 | 808 | 187.8 |
| D | 12 | 233 | 464683 | 2342.34 | 802 | 775 | 198.1 |
| D | 2 | 136 | 221879 | 1116.39 | 802 | 775 | 198.1 |
| D | 2 | 152 | 194956 | 980.45 | 802 | 775 | 198.1 |
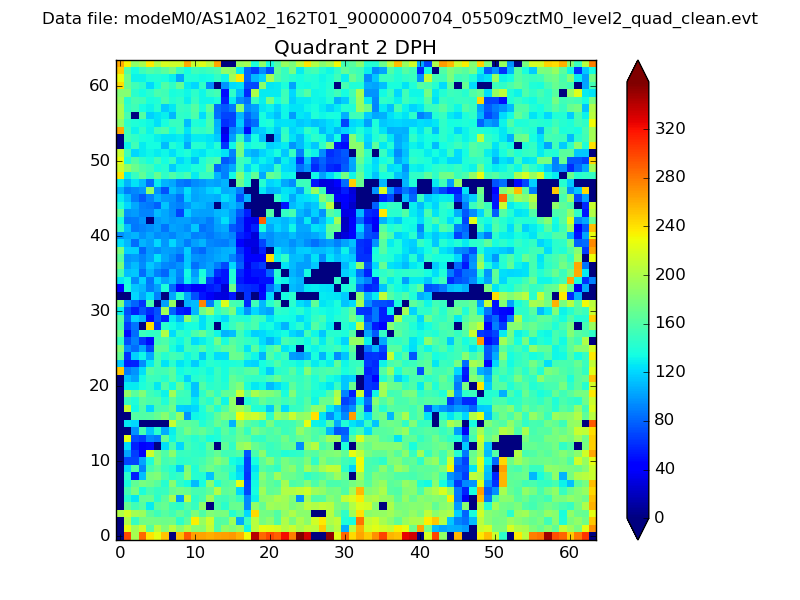
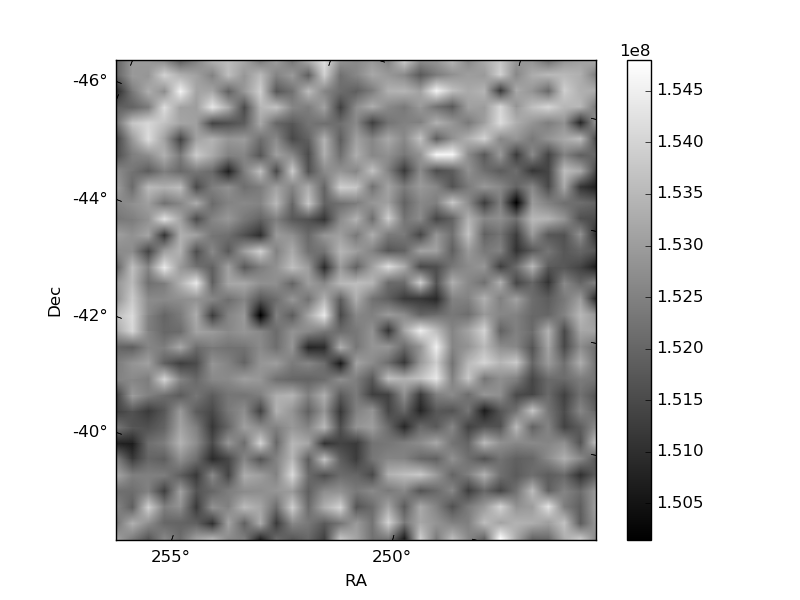
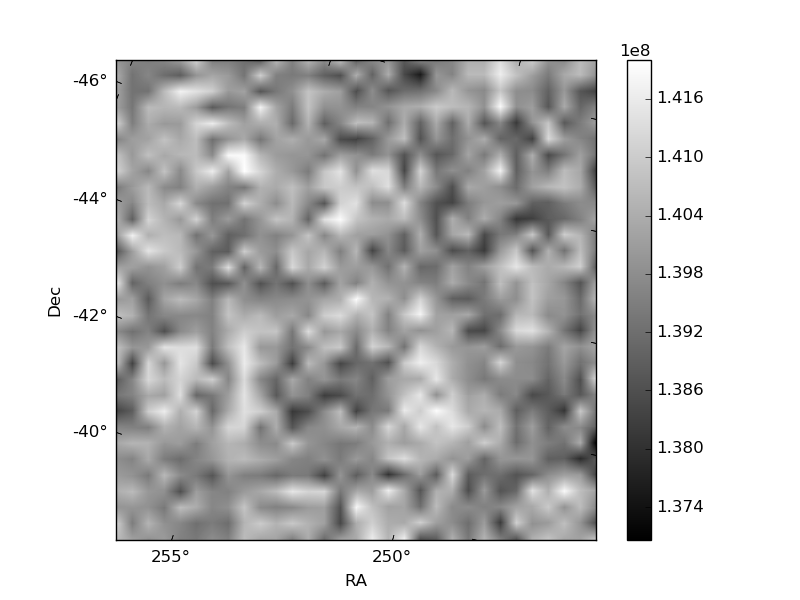
Histogram calculated using DETX and DETY for each event in the final _common_clean file
| Quadrant A | 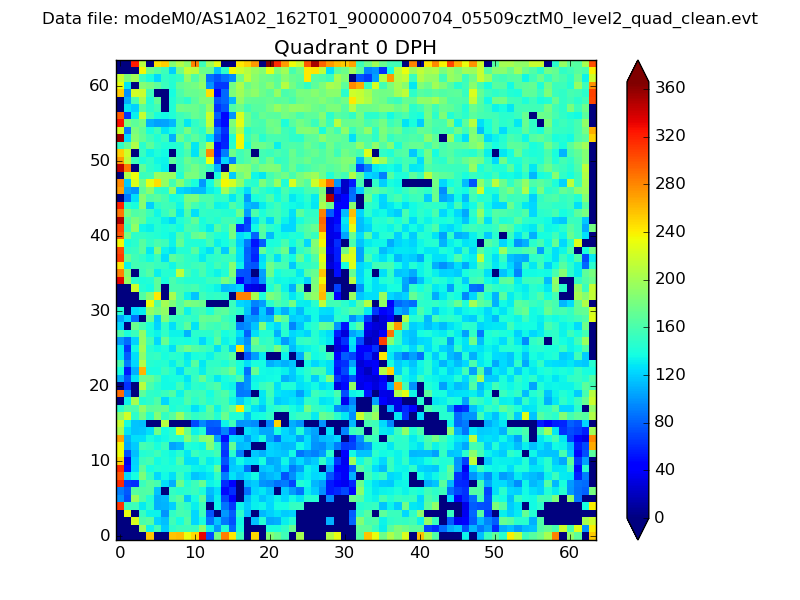 |
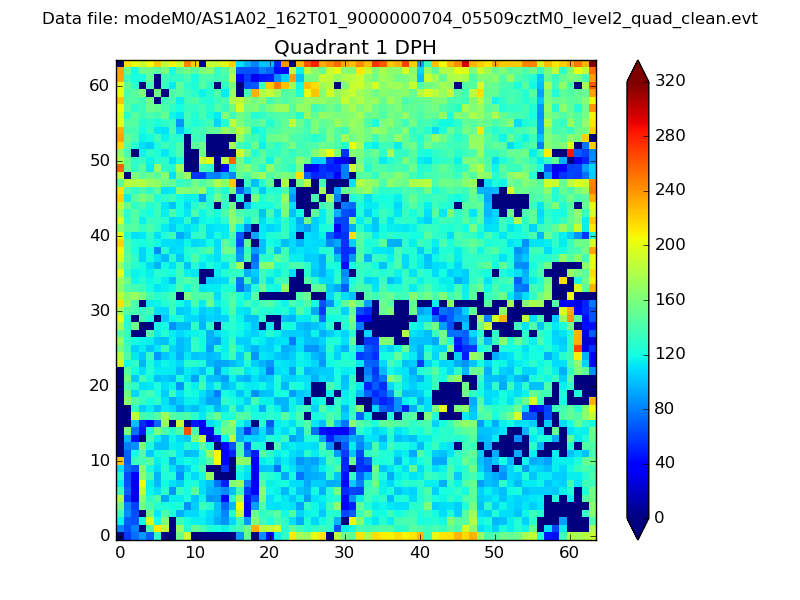 |
Quadrant B |
|---|---|---|---|
| Quadrant D | 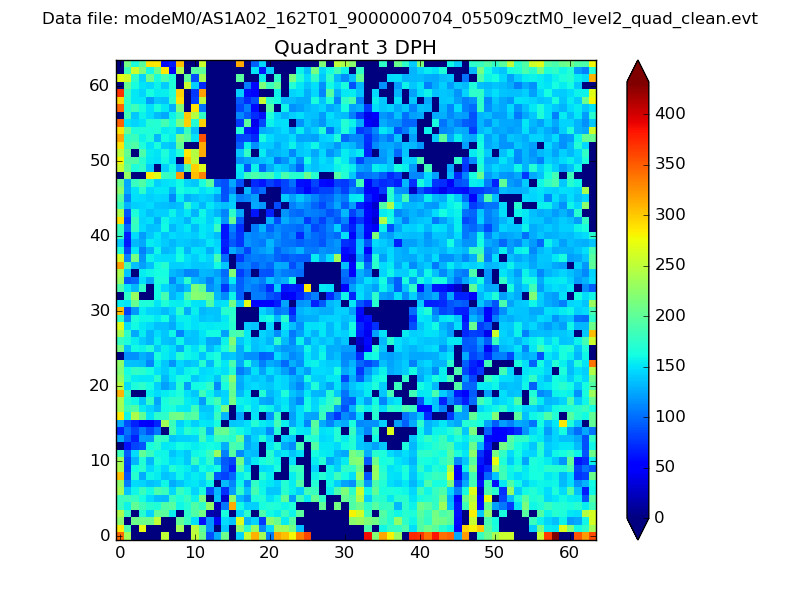 |
 |
Quadrant C |
| Plot type | Count rate plots | Images |
|---|---|---|
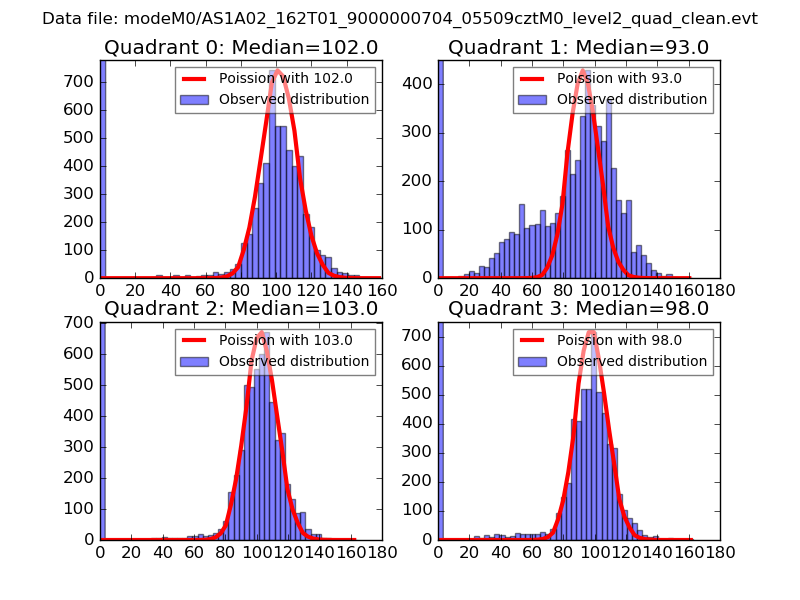
| Comparison with Poisson distribution Blue bars denote a histogram of data divided into 1 sec bins. Red curve is a Poisson curve with rate = median count rate of data. |
 |
 |
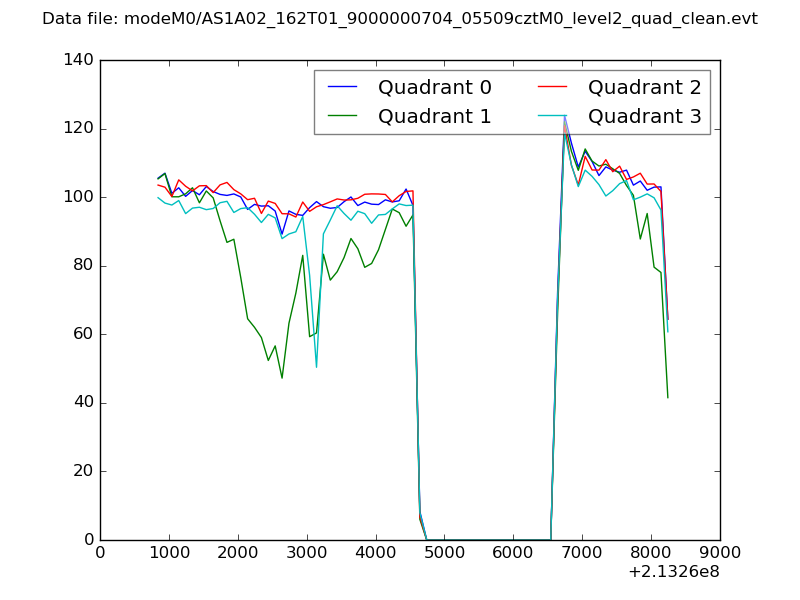
| Quadrant-wise count rates Data is divided into 100 sec bins |
 |
|
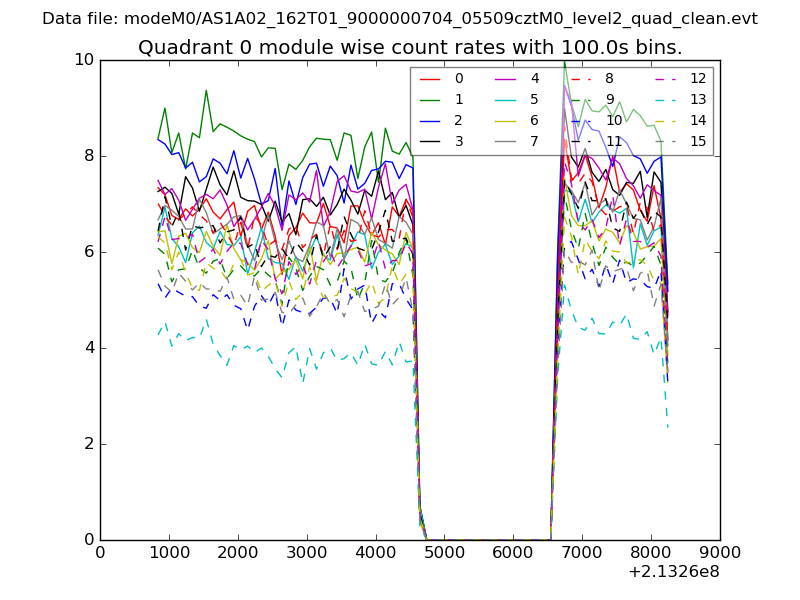
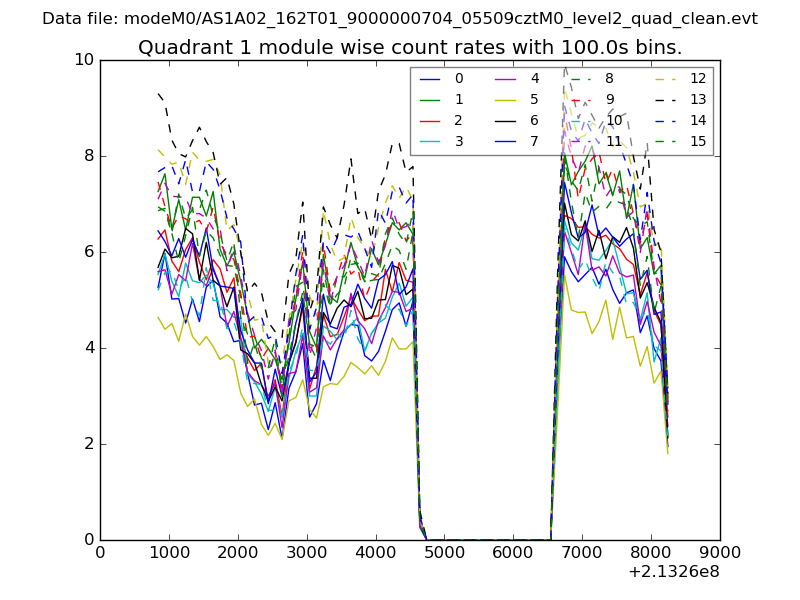
| Module-wise count rates for Quadrant A Data is divided into 100 sec bins |
 |
 |
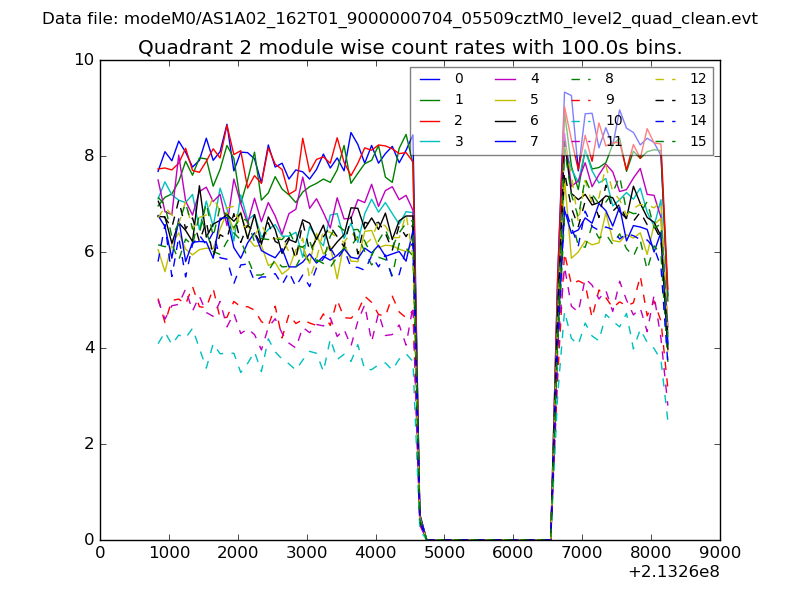
| Module-wise count rates for Quadrant B Data is divided into 100 sec bins |
 |
 |
| Module-wise count rates for Quadrant C Data is divided into 100 sec bins |
 |
 |
| Module-wise count rates for Quadrant D Data is divided into 100 sec bins |
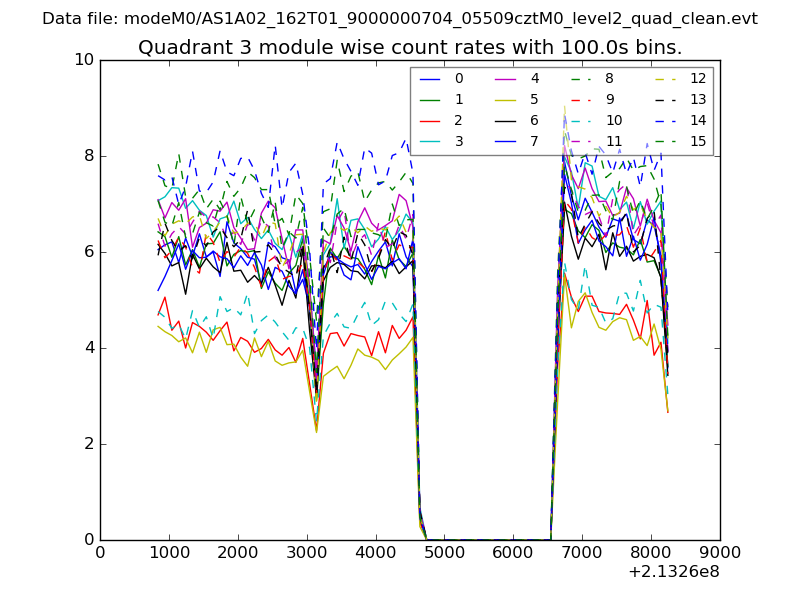 |
 |
| Parameter | Plot |
|---|---|
| CZT HV Monitor | 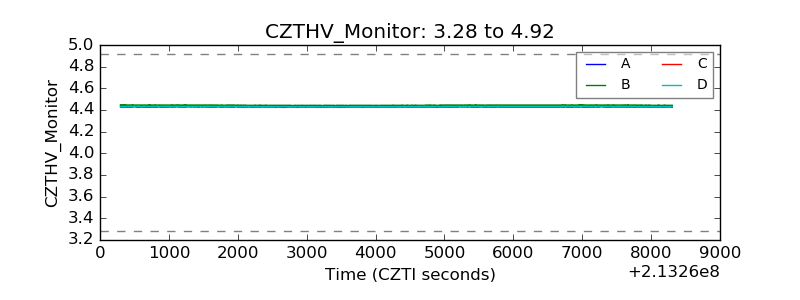 |
| D_VDD | 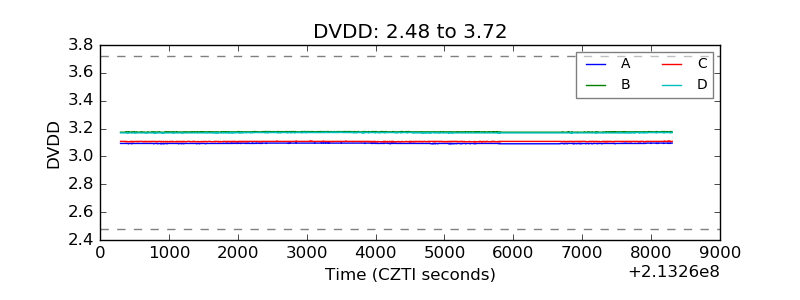 |
| Temperature 1 | 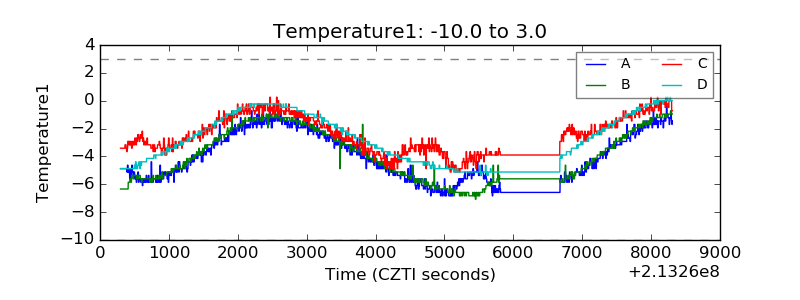 |
| Veto HV Monitor | 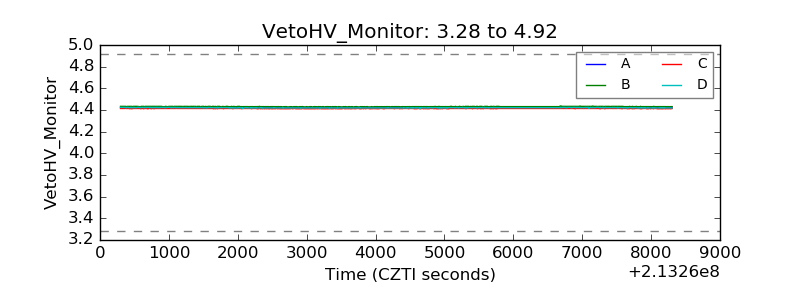 |
| Veto LLD | 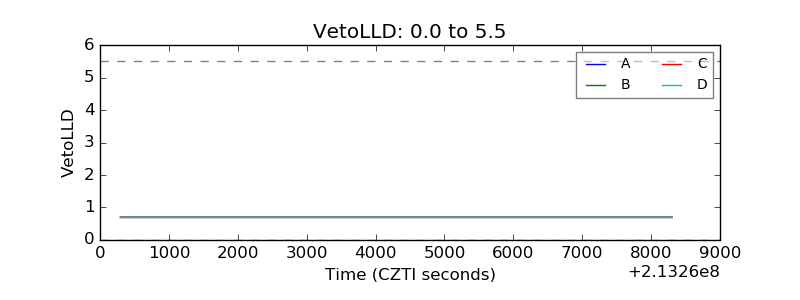 |
| Alpha Counter | 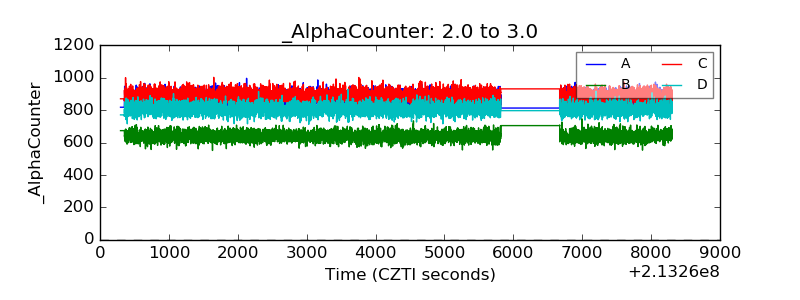 |
| _CPM_Rate | 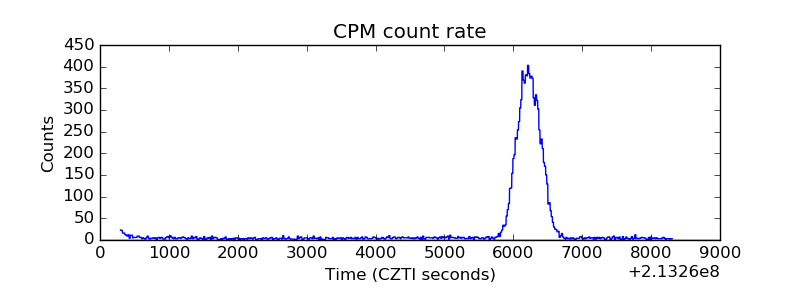 |
| CZT Counter | 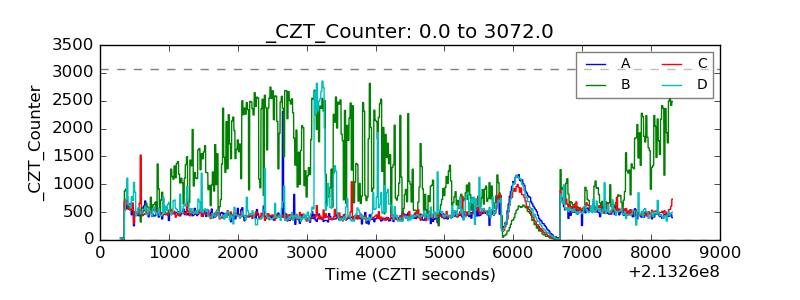 |
| +2.5 Volts monitor |  |
| +5 Volts monitor | 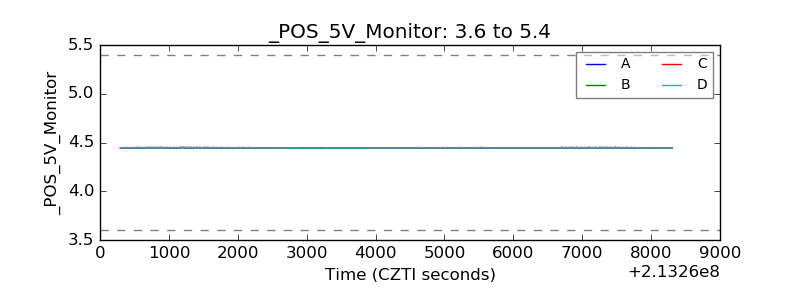 |
| _ROLL_ROT | 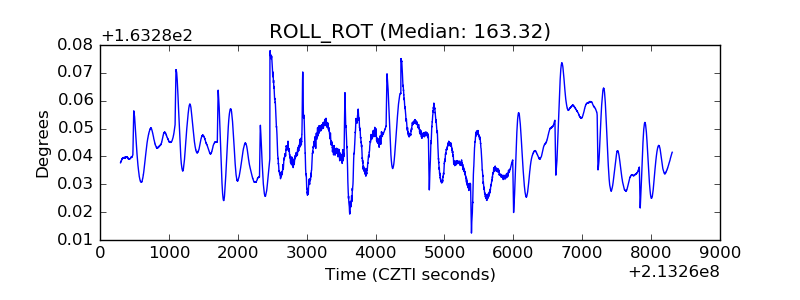 |
| _Roll_DEC | 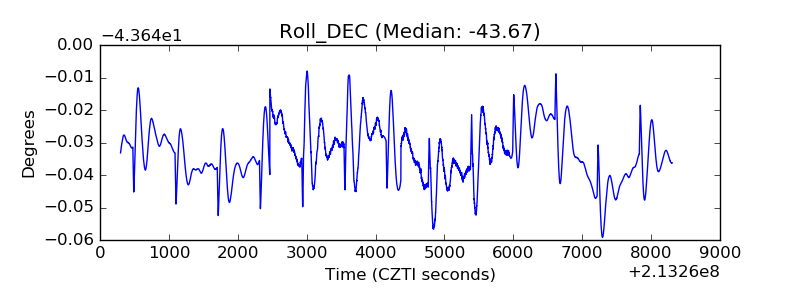 |
| _Roll_RA | 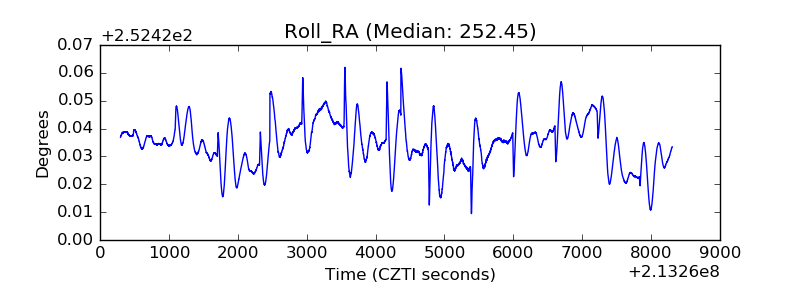 |
| Veto Counter | 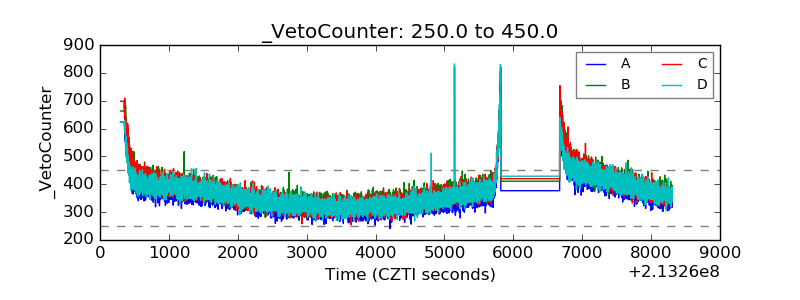 |