| Param | Original file | Final file |
|---|---|---|
| Filename | modeM0/AS1A02_162T01_9000000704_05510cztM0_level2.evt | modeM0/AS1A02_162T01_9000000704_05510cztM0_level2_quad_clean.evt |
| Size (bytes) | 2,523,945,600 | 333,861,120 |
| Size | 2.4 GB | 318.4 MB |
| Events in quadrant A | 13,043,754 | 2,097,024 |
| Events in quadrant B | 32,634,791 | 1,890,061 |
| Events in quadrant C | 13,945,302 | 2,113,683 |
| Events in quadrant D | 14,875,595 | 2,031,009 |
| Mode M0 | |||
|---|---|---|---|
| Quadrant | BADHDUFLAG | Total packets | Discarded packets |
| A | 0 | 59163 | 6 |
| B | 0 | 116884 | 18 |
| C | 0 | 61139 | 5 |
| D | 0 | 64610 | 5 |
| Mode SS | |||
|---|---|---|---|
| Quadrant | BADHDUFLAG | Total packets | Discarded packets |
| A | 0 | 586 | 0 |
| B | 0 | 586 | 0 |
| C | 0 | 586 | 0 |
| D | 0 | 586 | 0 |
| Mode M9 | |||
|---|---|---|---|
| Quadrant | BADHDUFLAG | Total packets | Discarded packets |
| A | 0 | 33 | 0 |
| B | 0 | 33 | 0 |
| C | 0 | 33 | 0 |
| D | 0 | 33 | 0 |
| Quadrant | Total seconds | Saturated seconds | Saturation percentage |
|---|---|---|---|
| A | 28769 | 450 | 1.564184% |
| B | 28767 | 5587 | 19.421559% |
| C | 28769 | 435 | 1.512044% |
| D | 28769 | 611 | 2.123814% |
Noise dominated data is calculated using 1-second bins in cleaned event files. If a bin has >2000 counts, and if more than 50% of those come from <1% of pixels, then it is considered to be noise-dominated and hence unusable.
| Quadrant | # 1 sec bins | Bins with >0 counts | Bins with >2000 counts | High rate bins dominated by noise | Noise dominated (total time) | Noise dominated (detector-on time) | Marked lightcurve |
|---|---|---|---|---|---|---|---|
| A | 32124 | 28774 | 47 | 47 | 0.15% | 0.16% | 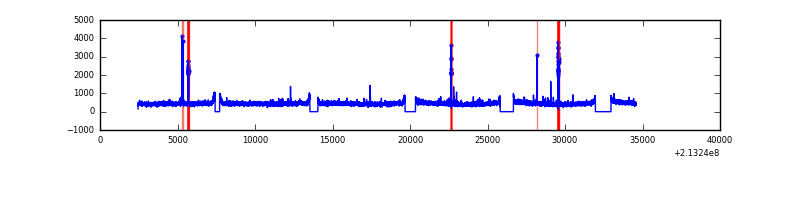 |
| B | 32124 | 28774 | 4551 | 4551 | 14.17% | 15.82% | 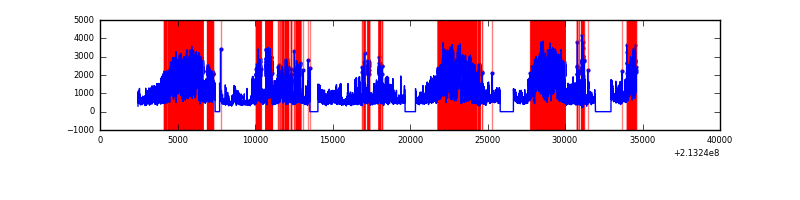 |
| C | 32124 | 28774 | 116 | 116 | 0.36% | 0.40% | 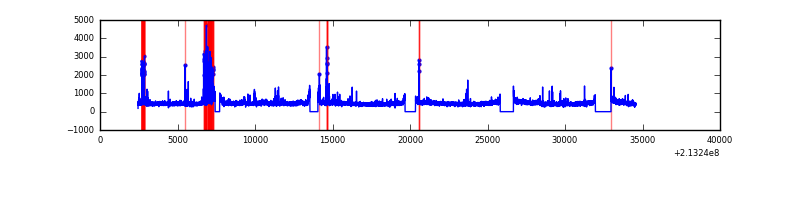 |
| D | 32124 | 28774 | 248 | 248 | 0.77% | 0.86% | 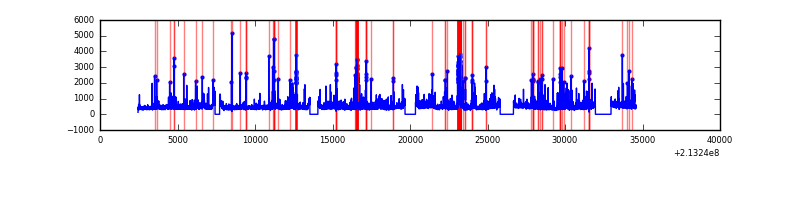 |
Top three noisy pixels from each quadrant. If the there are fewer than three noisy pixels in the level2.evt file, extra rows are filled as -1
| Pixel properties | Quadrant properties | ||||||
|---|---|---|---|---|---|---|---|
| Quadrant | DetID | PixID | Counts | Sigma | Mean | Median | Sigma |
| A | 0 | 50 | 202765 | 293.68 | 3317 | 3243 | 679.4 |
| A | 12 | 194 | 33135 | 44.0 | 3317 | 3243 | 679.4 |
| A | 0 | 226 | 32589 | 43.2 | 3317 | 3243 | 679.4 |
| B | 15 | 255 | 17530657 | 28908.24 | 3176 | 3099 | 606.3 |
| B | 15 | 204 | 2063070 | 3397.51 | 3176 | 3099 | 606.3 |
| B | 4 | 48 | 267659 | 436.34 | 3176 | 3099 | 606.3 |
| C | 9 | 247 | 790190 | 1063.35 | 3211 | 3223 | 740.1 |
| C | 1 | 16 | 550134 | 738.99 | 3211 | 3223 | 740.1 |
| C | 8 | 128 | 27614 | 32.96 | 3211 | 3223 | 740.1 |
| D | 2 | 152 | 696332 | 883.23 | 3222 | 3124 | 784.9 |
| D | 12 | 233 | 679370 | 861.62 | 3222 | 3124 | 784.9 |
| D | 2 | 136 | 475663 | 602.07 | 3222 | 3124 | 784.9 |
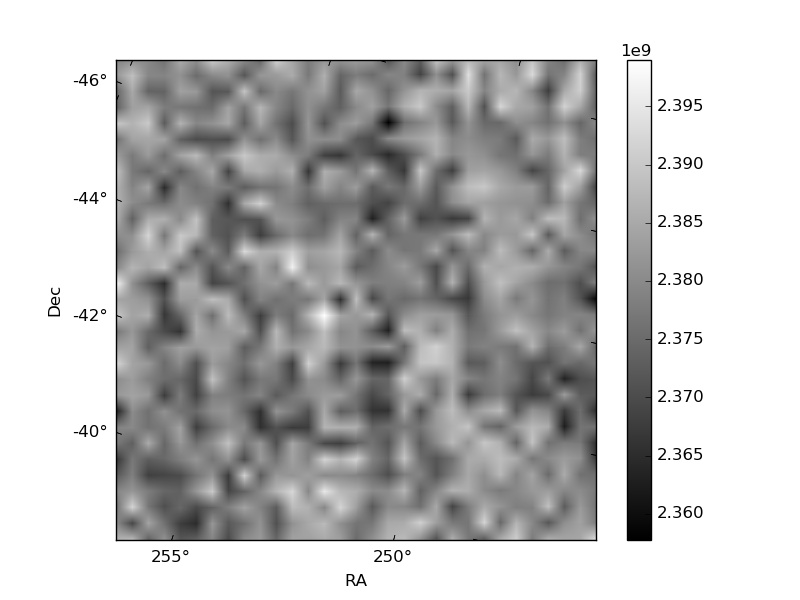
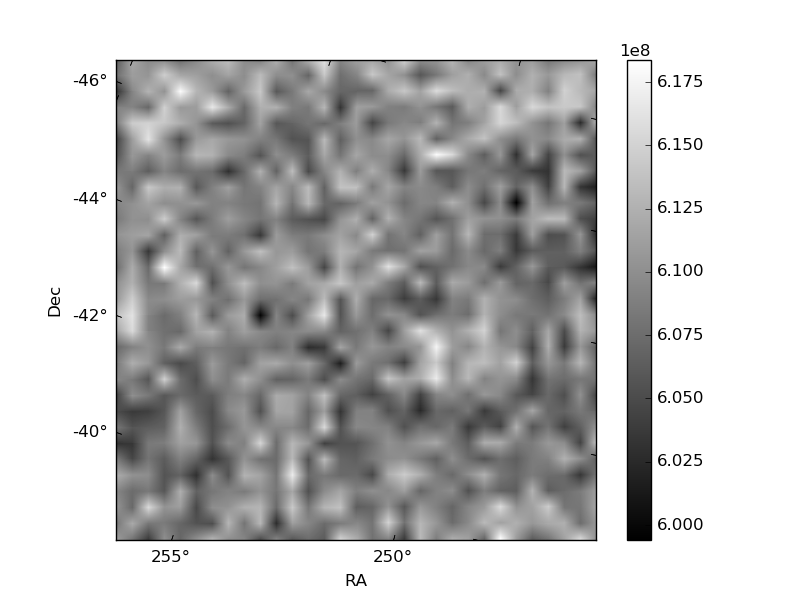
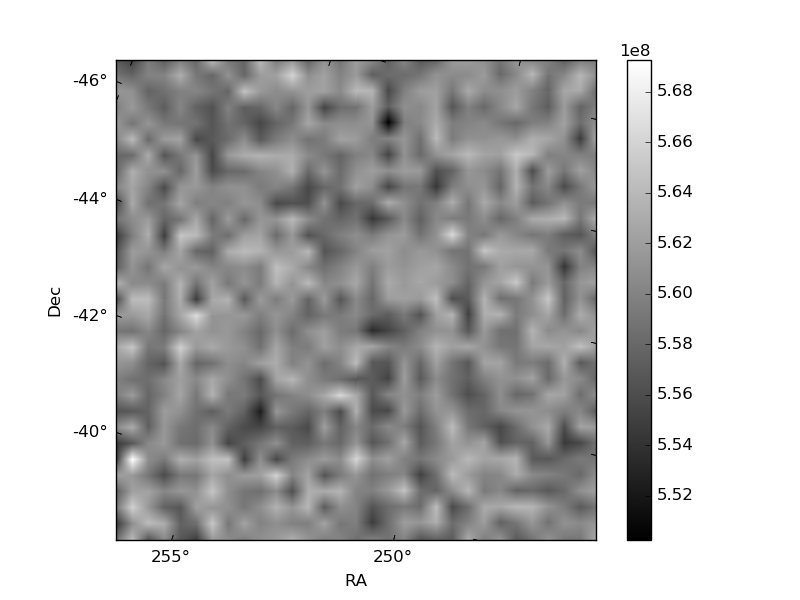
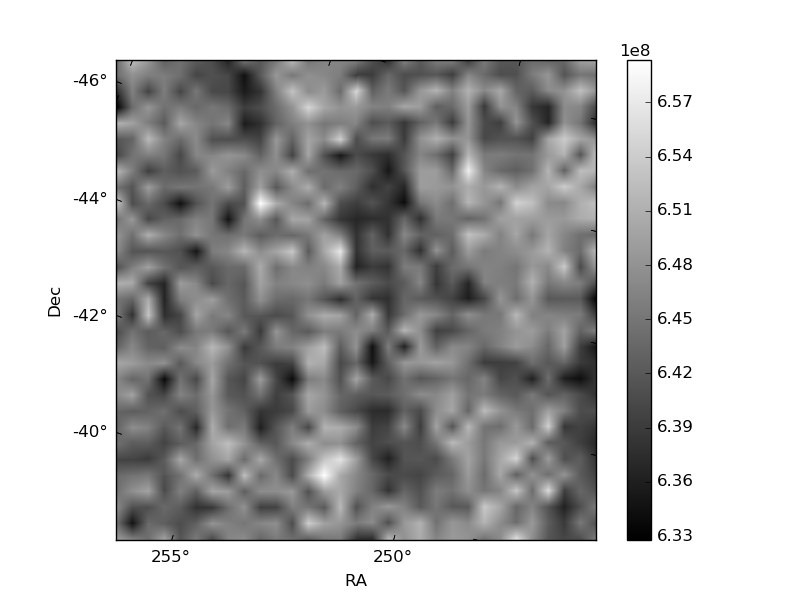
Histogram calculated using DETX and DETY for each event in the final _common_clean file
| Quadrant A | 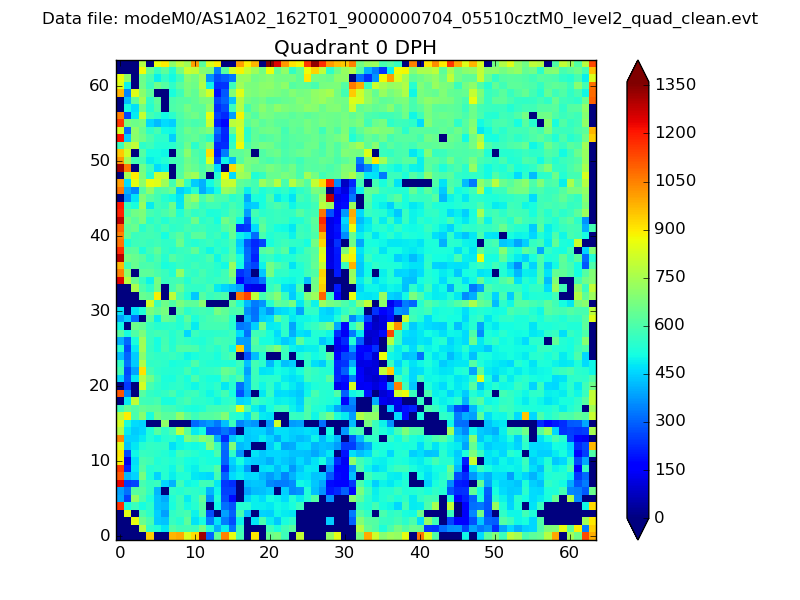 |
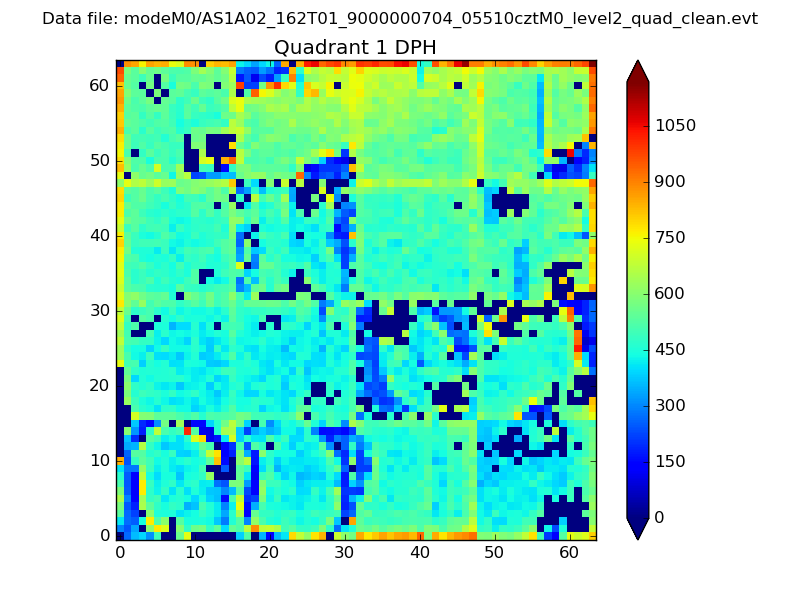 |
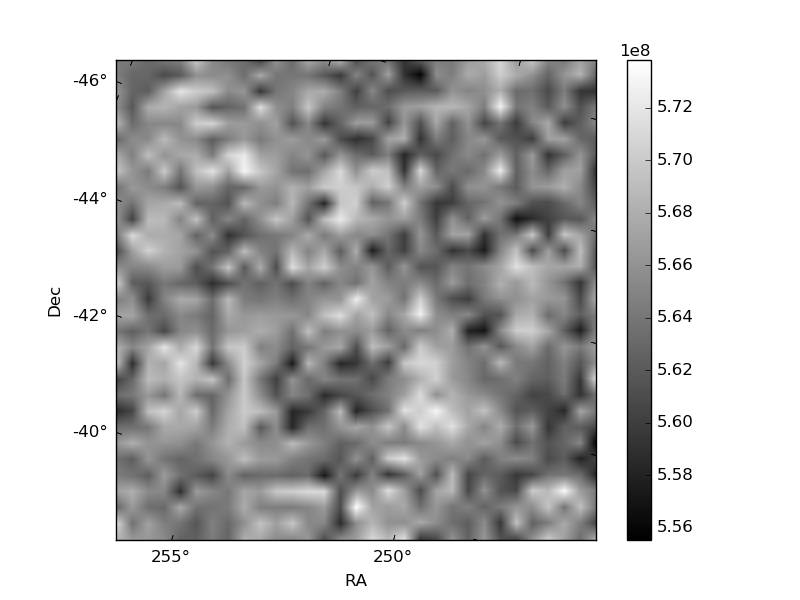
Quadrant B |
|---|---|---|---|
| Quadrant D | 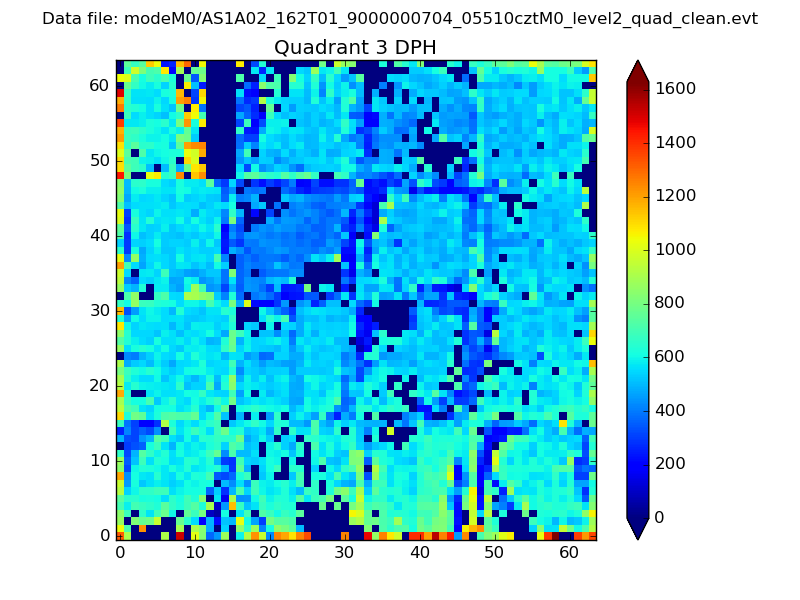 |
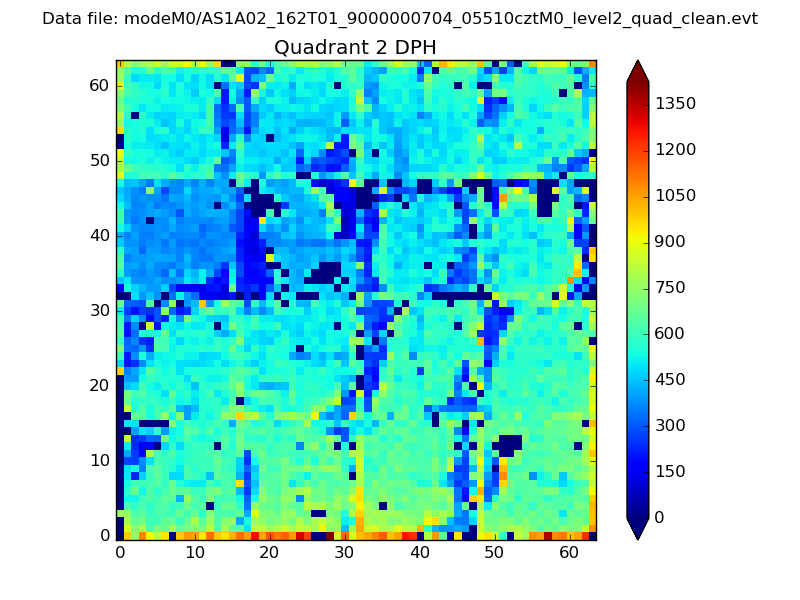 |
Quadrant C |
| Plot type | Count rate plots | Images |
|---|---|---|
| Comparison with Poisson distribution Blue bars denote a histogram of data divided into 1 sec bins. Red curve is a Poisson curve with rate = median count rate of data. |
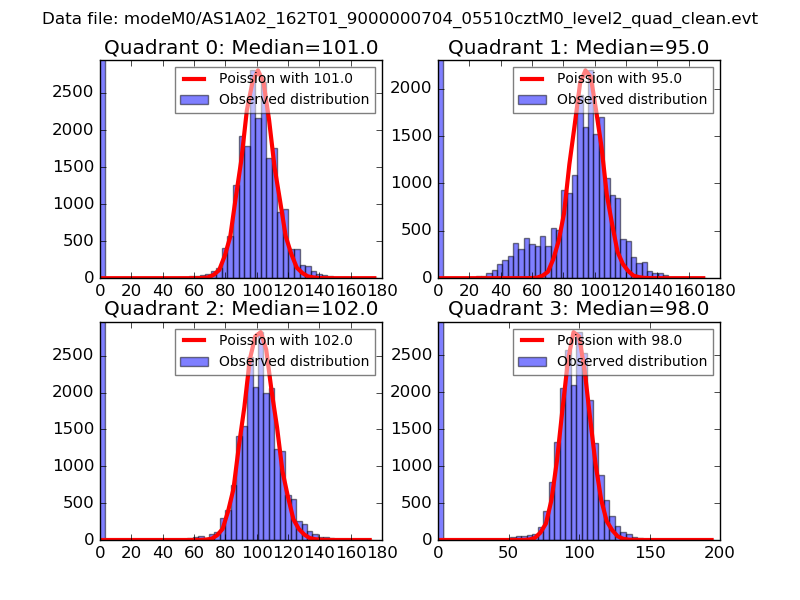 |
 |
| Quadrant-wise count rates Data is divided into 100 sec bins |
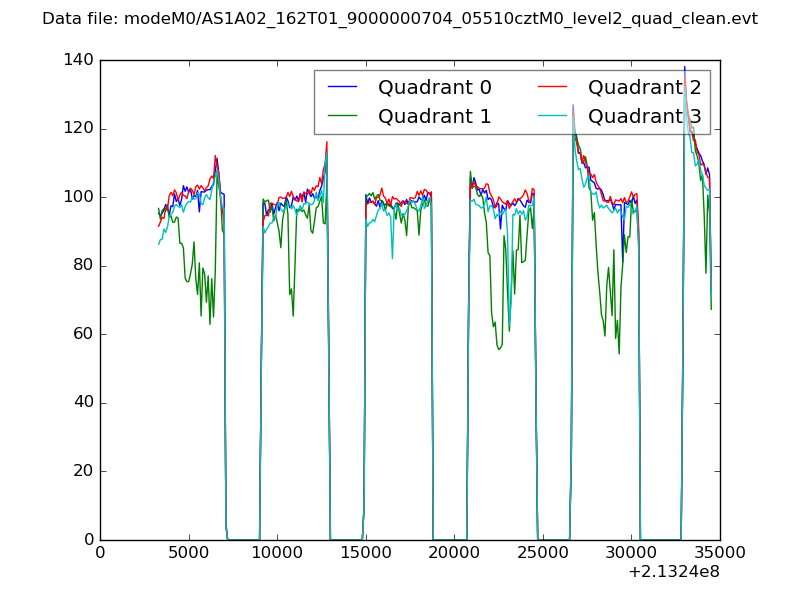 |
|
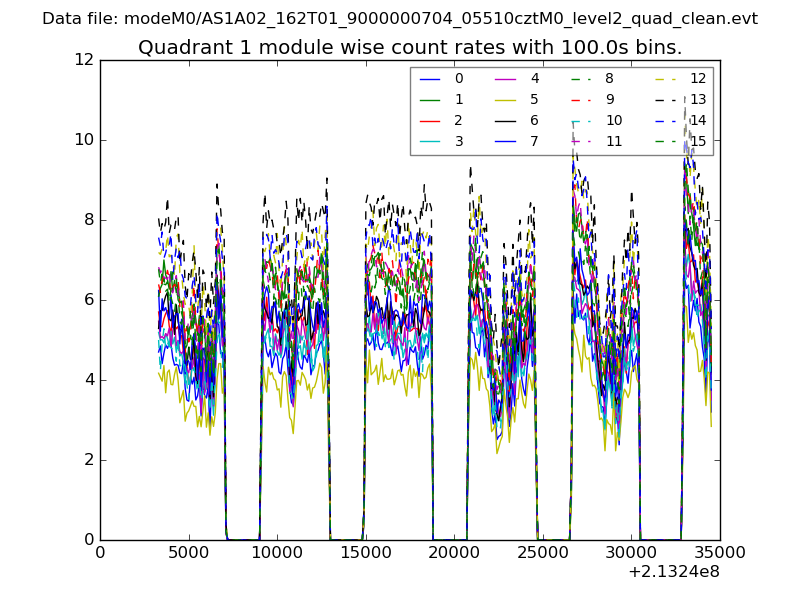
| Module-wise count rates for Quadrant A Data is divided into 100 sec bins |
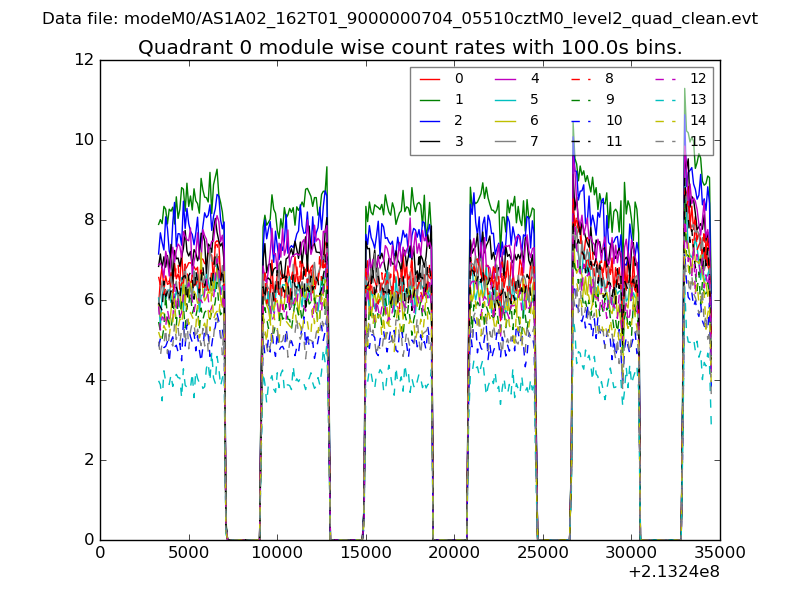 |
 |
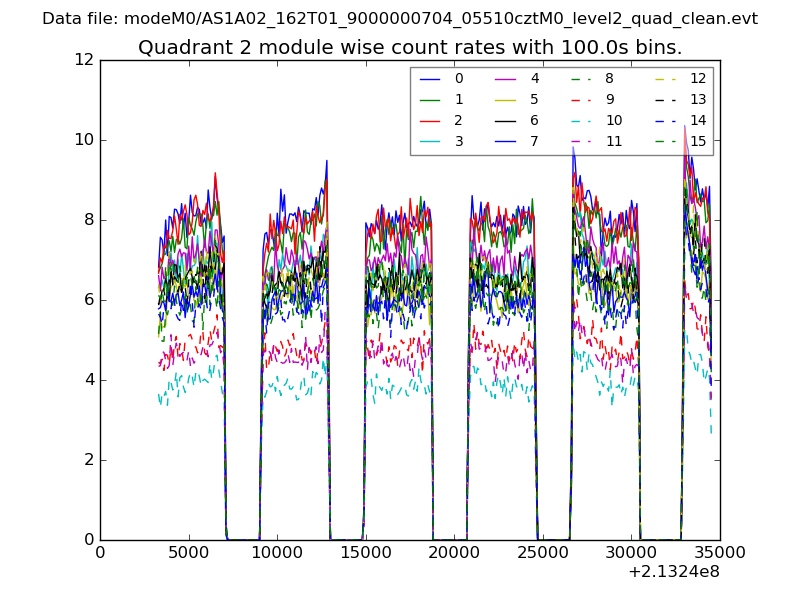
| Module-wise count rates for Quadrant B Data is divided into 100 sec bins |
 |
 |
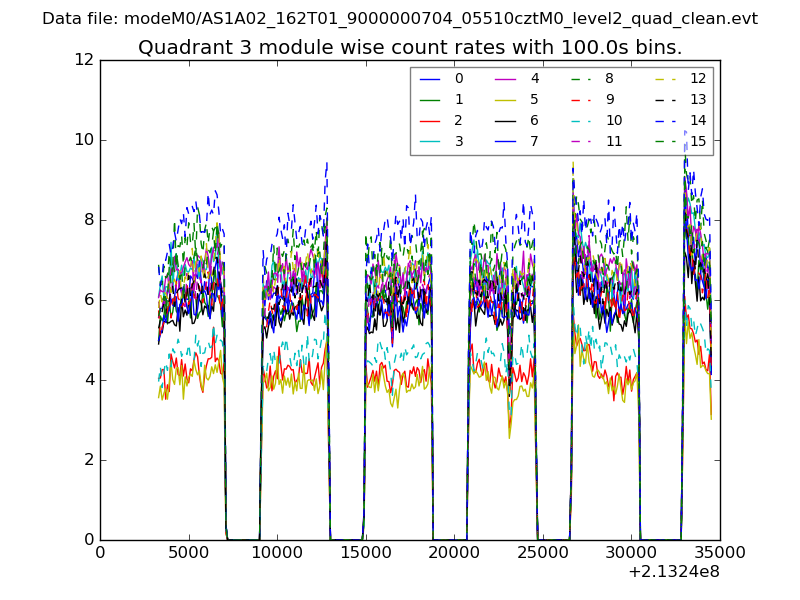
| Module-wise count rates for Quadrant C Data is divided into 100 sec bins |
 |
 |
| Module-wise count rates for Quadrant D Data is divided into 100 sec bins |
 |
 |
| Parameter | Plot |
|---|---|
| CZT HV Monitor | 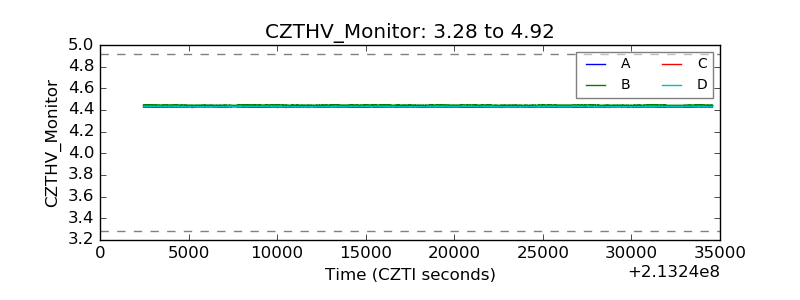 |
| D_VDD | 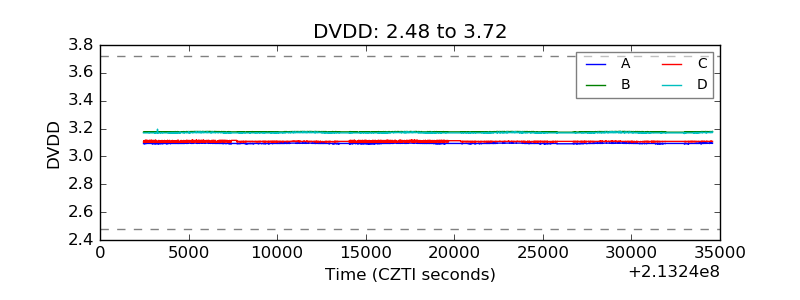 |
| Temperature 1 | 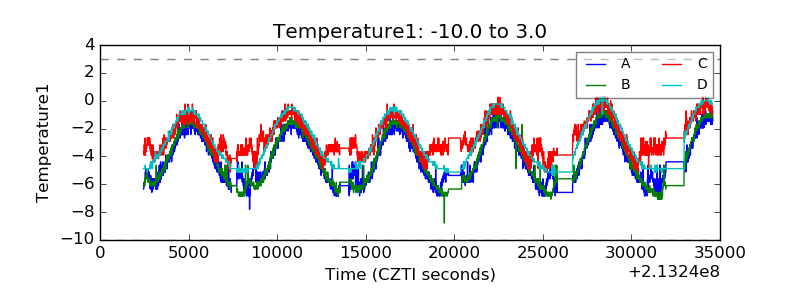 |
| Veto HV Monitor | 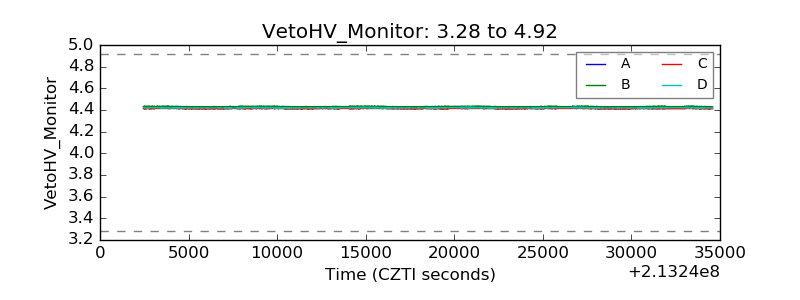 |
| Veto LLD | 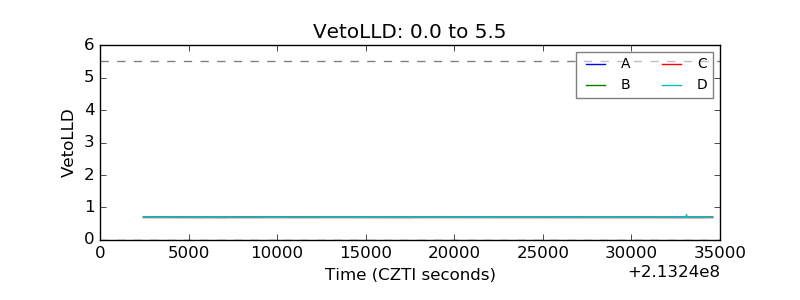 |
| Alpha Counter | 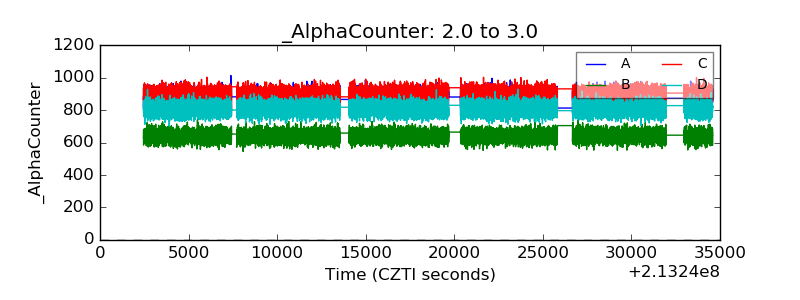 |
| _CPM_Rate | 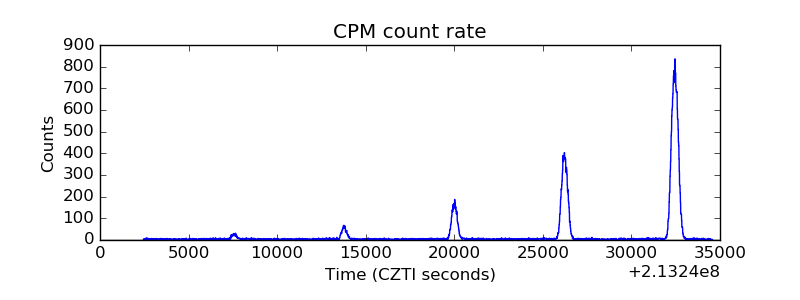 |
| CZT Counter | 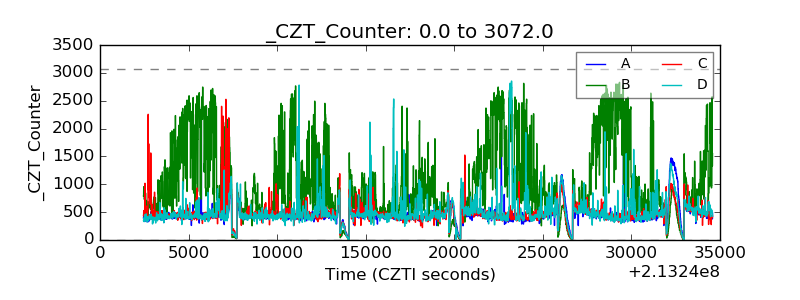 |
| +2.5 Volts monitor |  |
| +5 Volts monitor |  |
| _ROLL_ROT | 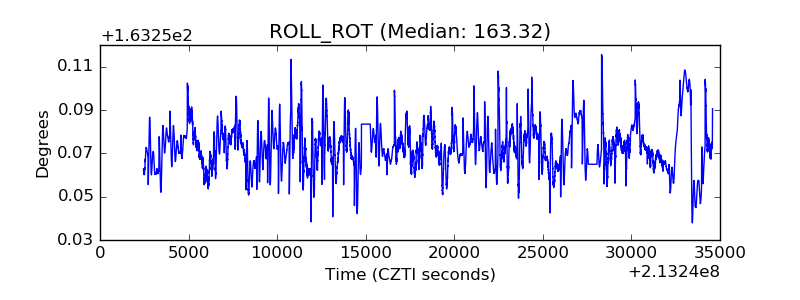 |
| _Roll_DEC | 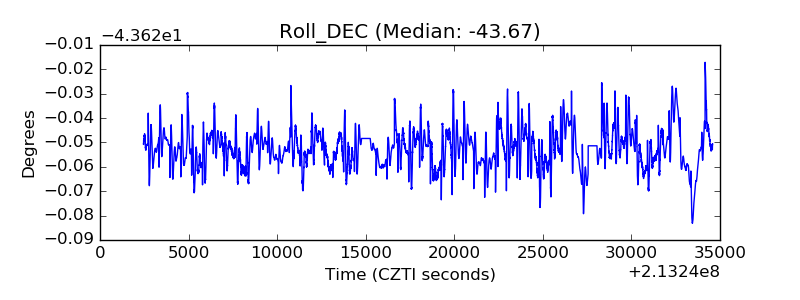 |
| _Roll_RA | 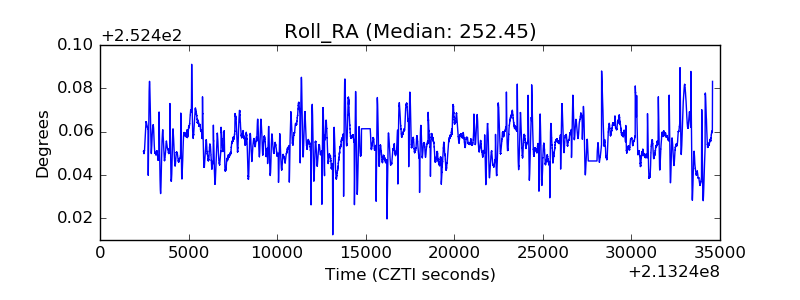 |
| Veto Counter | 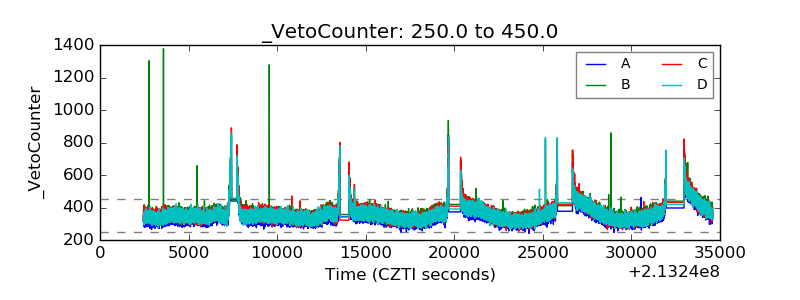 |