| Param | Original file | Final file |
|---|---|---|
| Filename | modeM0/AS1A02_162T01_9000000704_05512cztM0_level2.evt | modeM0/AS1A02_162T01_9000000704_05512cztM0_level2_quad_clean.evt |
| Size (bytes) | 518,981,760 | 69,413,760 |
| Size | 494.9 MB | 66.2 MB |
| Events in quadrant A | 2,626,256 | 440,953 |
| Events in quadrant B | 6,991,779 | 398,733 |
| Events in quadrant C | 2,647,659 | 438,040 |
| Events in quadrant D | 3,062,310 | 421,984 |
| Mode M0 | |||
|---|---|---|---|
| Quadrant | BADHDUFLAG | Total packets | Discarded packets |
| A | 0 | 11867 | 2 |
| B | 0 | 24687 | 1 |
| C | 0 | 12051 | 1 |
| D | 0 | 13037 | 1 |
| Mode SS | |||
|---|---|---|---|
| Quadrant | BADHDUFLAG | Total packets | Discarded packets |
| A | 0 | 116 | 0 |
| B | 0 | 116 | 0 |
| C | 0 | 116 | 0 |
| D | 0 | 116 | 0 |
| Mode M9 | |||
|---|---|---|---|
| Quadrant | BADHDUFLAG | Total packets | Discarded packets |
| A | 0 | 12 | 0 |
| B | 0 | 12 | 0 |
| C | 0 | 12 | 0 |
| D | 0 | 12 | 0 |
| Quadrant | Total seconds | Saturated seconds | Saturation percentage |
|---|---|---|---|
| A | 5748 | 19 | 0.330550% |
| B | 5748 | 854 | 14.857342% |
| C | 5748 | 10 | 0.173974% |
| D | 5748 | 43 | 0.748086% |
Noise dominated data is calculated using 1-second bins in cleaned event files. If a bin has >2000 counts, and if more than 50% of those come from <1% of pixels, then it is considered to be noise-dominated and hence unusable.
| Quadrant | # 1 sec bins | Bins with >0 counts | Bins with >2000 counts | High rate bins dominated by noise | Noise dominated (total time) | Noise dominated (detector-on time) | Marked lightcurve |
|---|---|---|---|---|---|---|---|
| A | 6923 | 5749 | 5 | 5 | 0.07% | 0.09% | 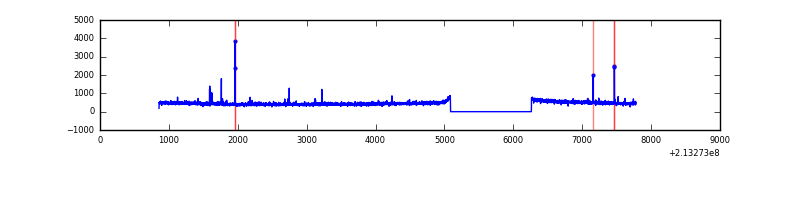 |
| B | 6923 | 5749 | 773 | 773 | 11.17% | 13.45% | 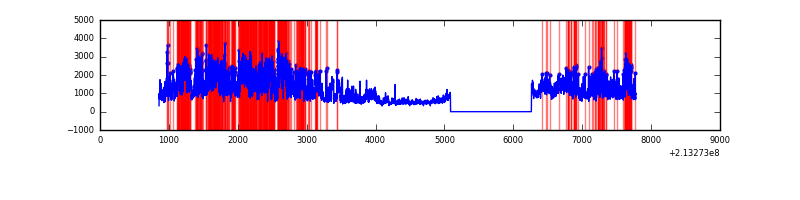 |
| C | 6923 | 5749 | 1 | 1 | 0.01% | 0.02% | 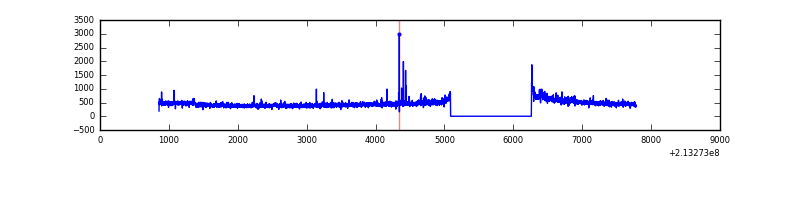 |
| D | 6923 | 5749 | 24 | 24 | 0.35% | 0.42% | 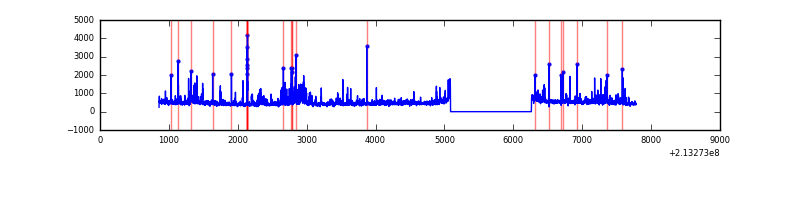 |
Top three noisy pixels from each quadrant. If the there are fewer than three noisy pixels in the level2.evt file, extra rows are filled as -1
| Pixel properties | Quadrant properties | ||||||
|---|---|---|---|---|---|---|---|
| Quadrant | DetID | PixID | Counts | Sigma | Mean | Median | Sigma |
| A | 0 | 50 | 34161 | 241.88 | 671 | 655 | 138.5 |
| A | 0 | 226 | 6802 | 44.37 | 671 | 655 | 138.5 |
| A | 12 | 194 | 6738 | 43.91 | 671 | 655 | 138.5 |
| B | 15 | 255 | 3226589 | 25792.65 | 649 | 636 | 125.1 |
| B | 15 | 204 | 1032357 | 8248.98 | 649 | 636 | 125.1 |
| B | 11 | 51 | 59351 | 469.45 | 649 | 636 | 125.1 |
| C | 1 | 16 | 108643 | 726.55 | 638 | 643 | 148.6 |
| C | 9 | 247 | 40599 | 268.8 | 638 | 643 | 148.6 |
| C | 12 | 4 | 6106 | 36.75 | 638 | 643 | 148.6 |
| D | 2 | 152 | 161319 | 1027.82 | 642 | 625 | 156.3 |
| D | 2 | 136 | 127504 | 811.54 | 642 | 625 | 156.3 |
| D | 8 | 195 | 101079 | 642.52 | 642 | 625 | 156.3 |
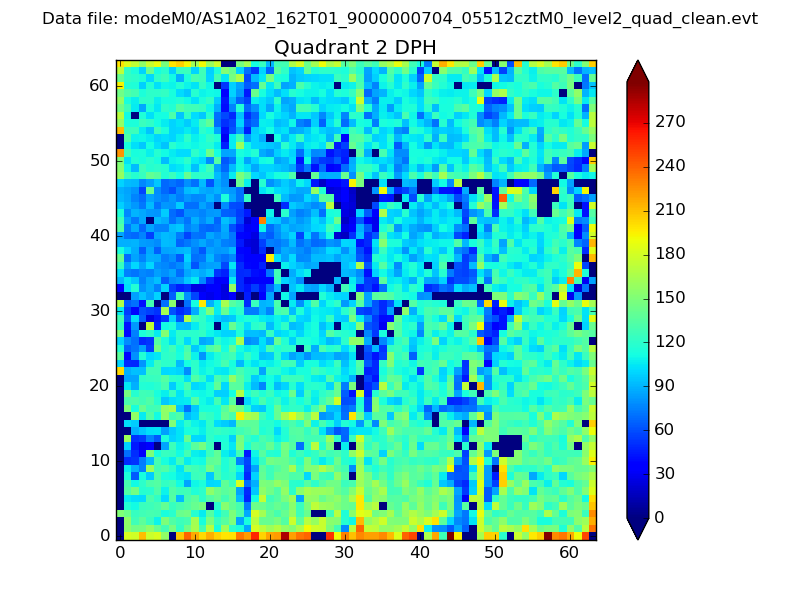
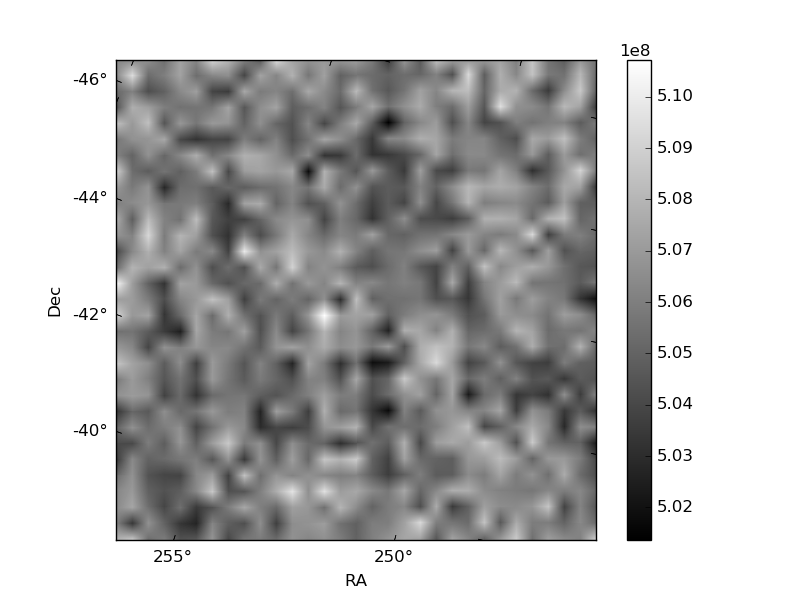
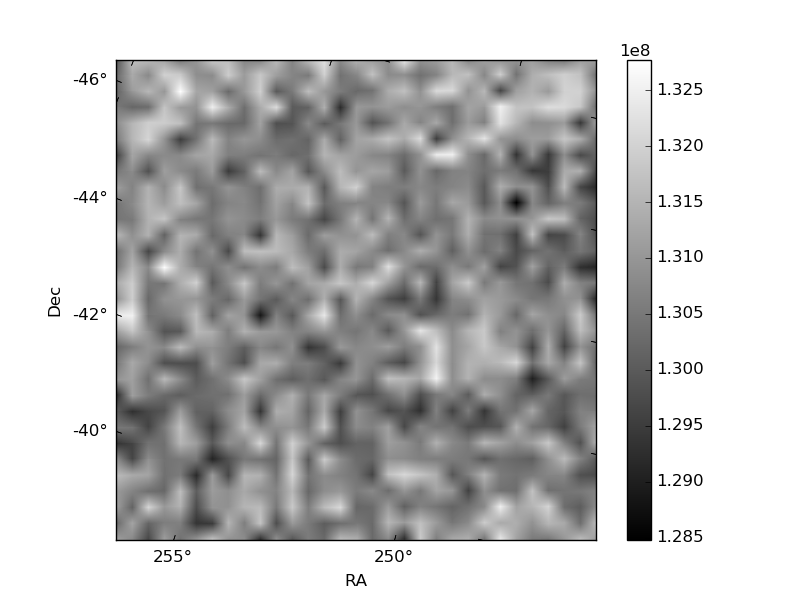
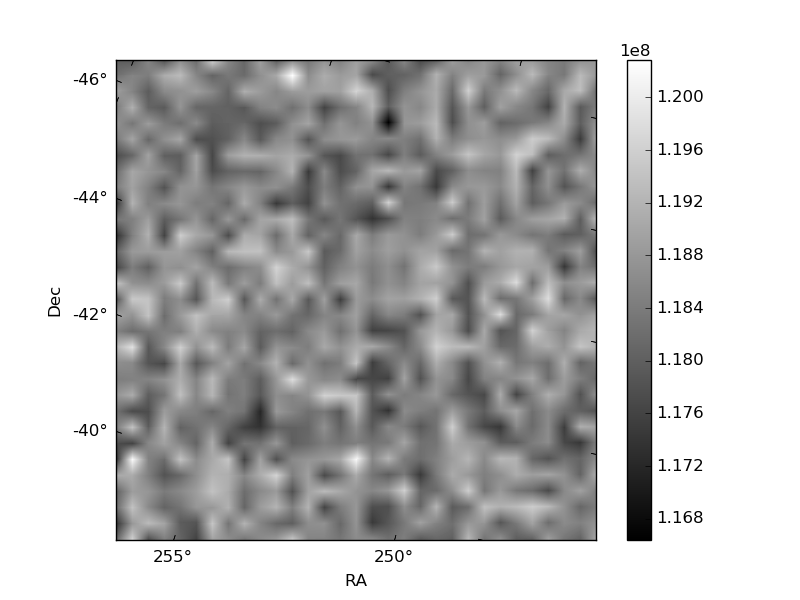
Histogram calculated using DETX and DETY for each event in the final _common_clean file
| Quadrant A | 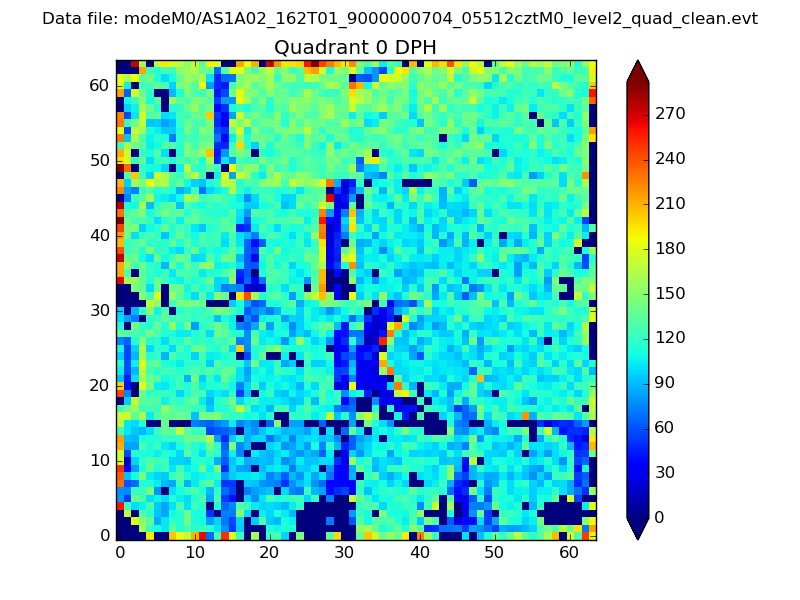 |
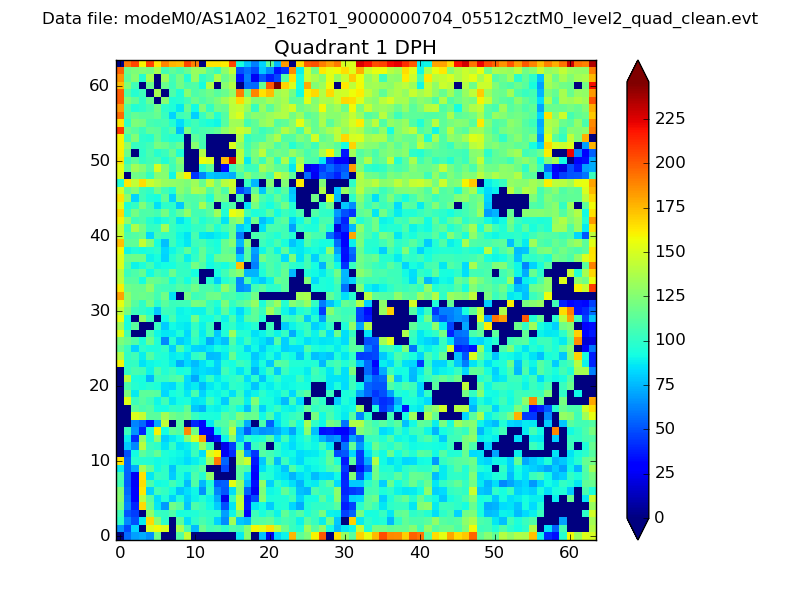 |
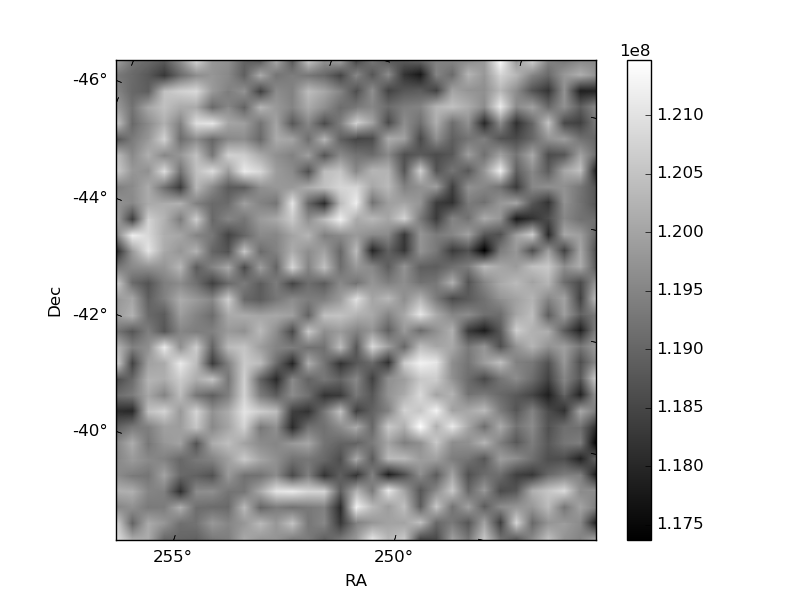
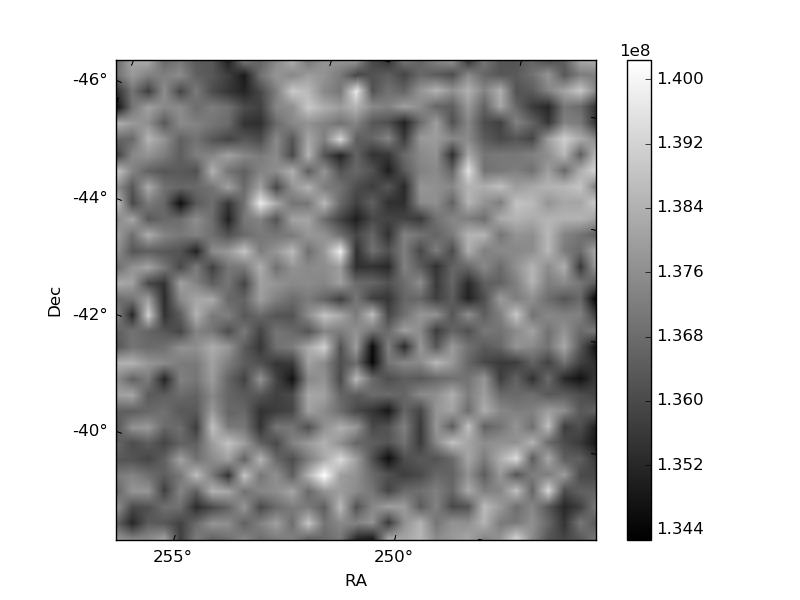
Quadrant B |
|---|---|---|---|
| Quadrant D | 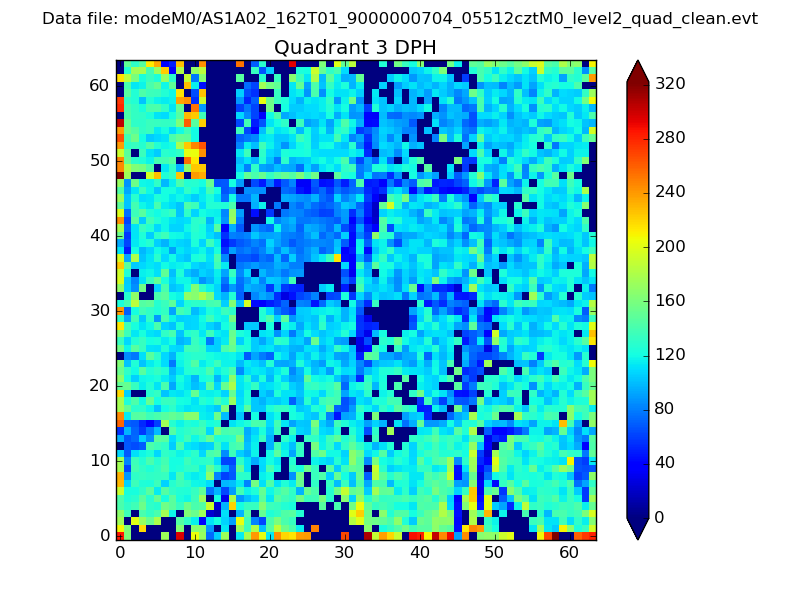 |
 |
Quadrant C |
| Plot type | Count rate plots | Images |
|---|---|---|
| Comparison with Poisson distribution Blue bars denote a histogram of data divided into 1 sec bins. Red curve is a Poisson curve with rate = median count rate of data. |
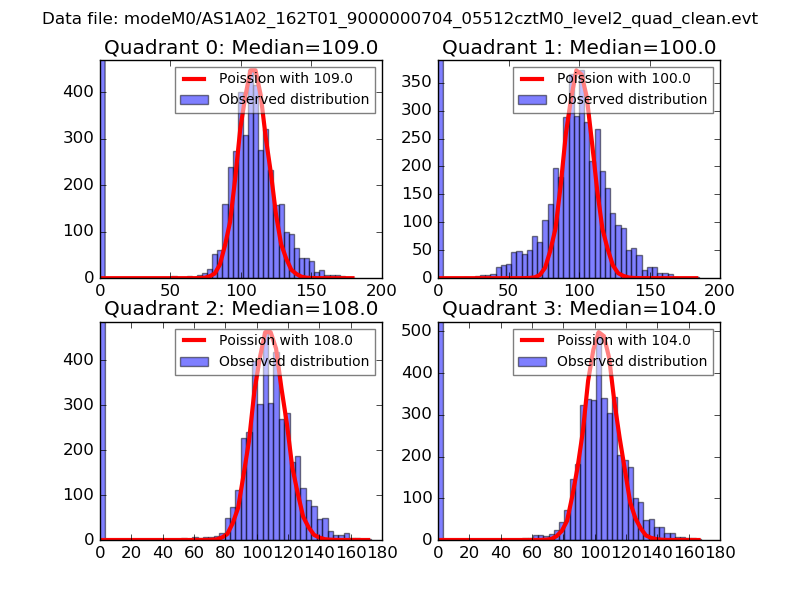 |
 |
| Quadrant-wise count rates Data is divided into 100 sec bins |
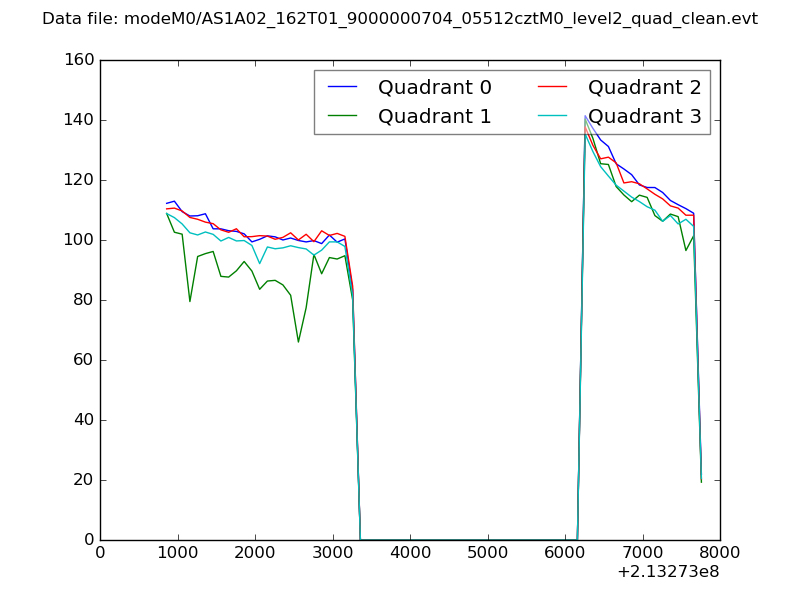 |
|
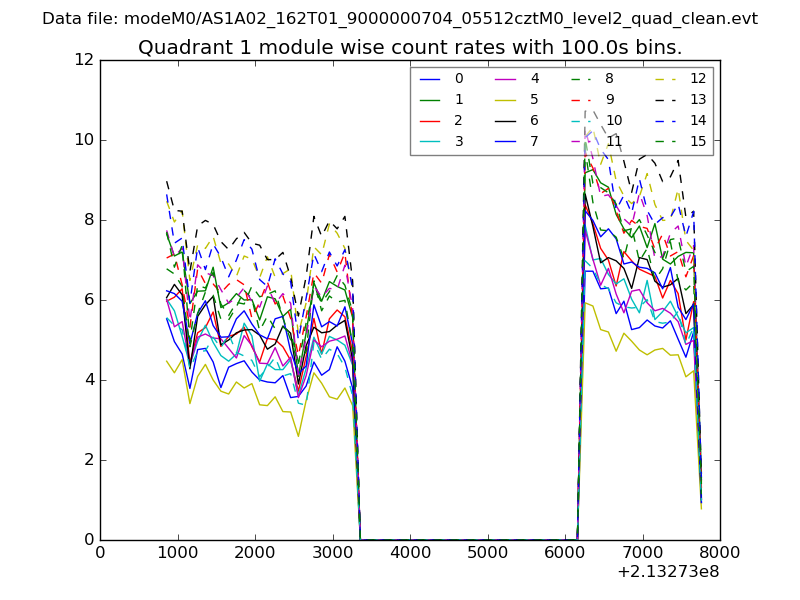
| Module-wise count rates for Quadrant A Data is divided into 100 sec bins |
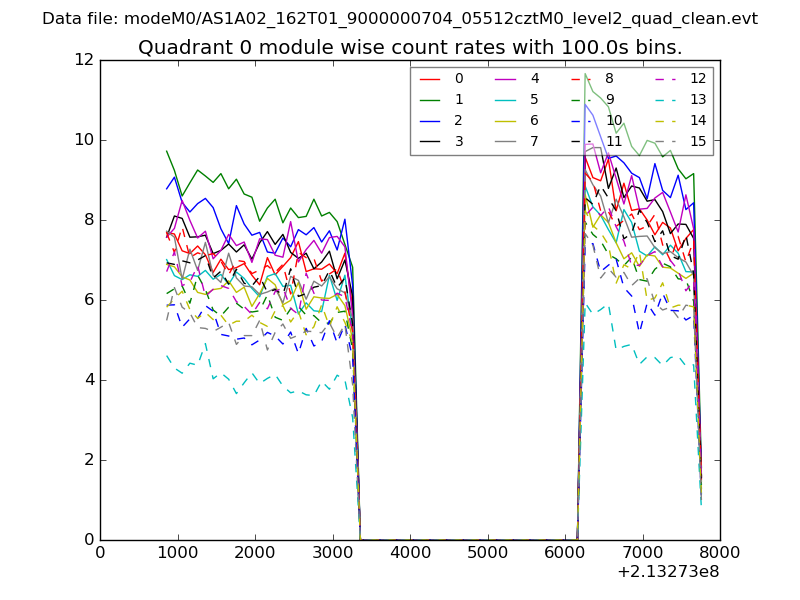 |
 |
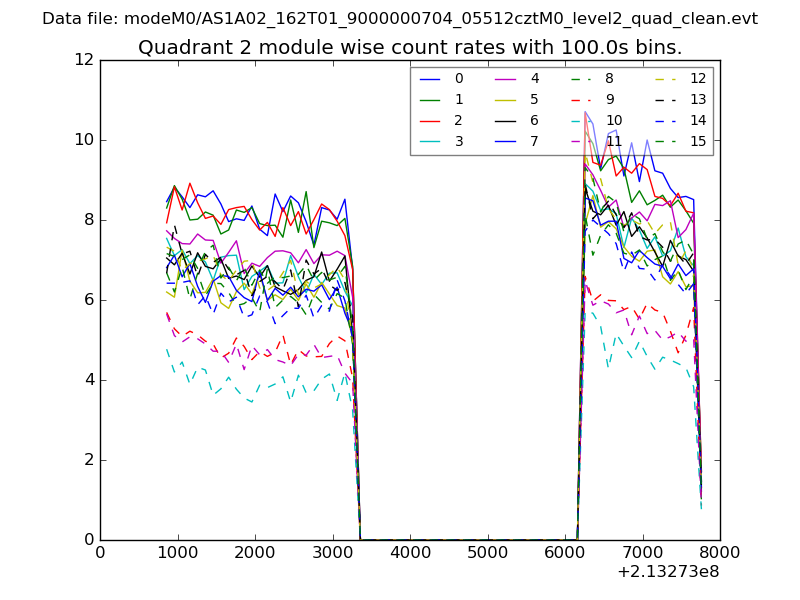
| Module-wise count rates for Quadrant B Data is divided into 100 sec bins |
 |
 |
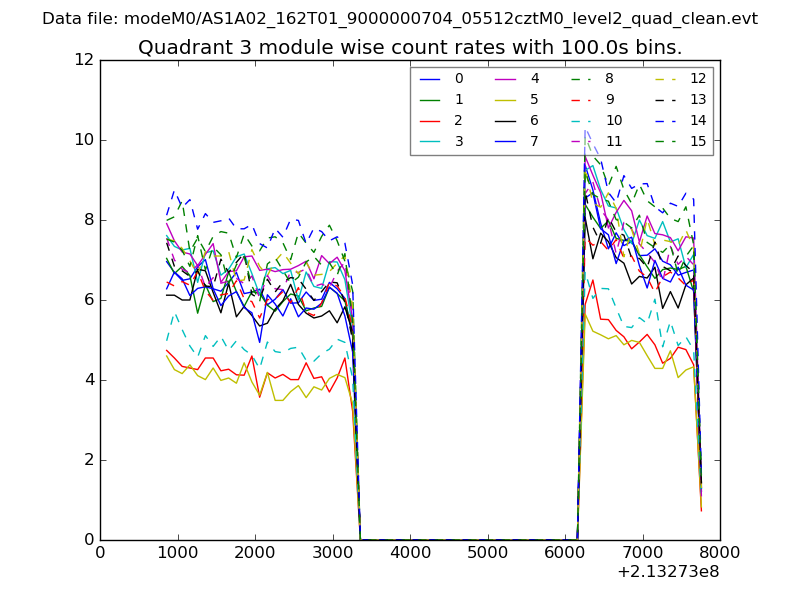
| Module-wise count rates for Quadrant C Data is divided into 100 sec bins |
 |
 |
| Module-wise count rates for Quadrant D Data is divided into 100 sec bins |
 |
 |
| Parameter | Plot |
|---|---|
| CZT HV Monitor | 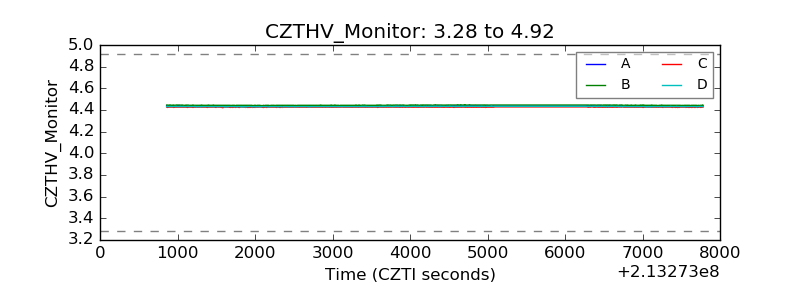 |
| D_VDD |  |
| Temperature 1 | 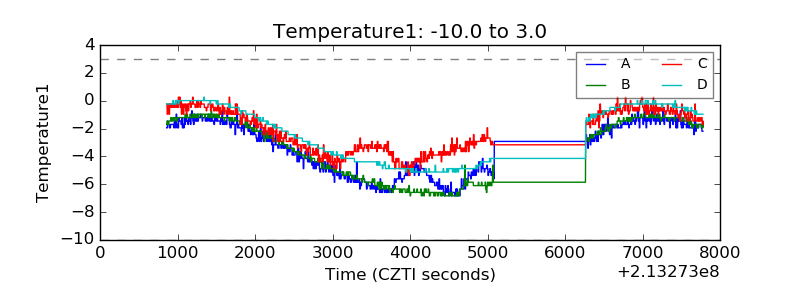 |
| Veto HV Monitor | 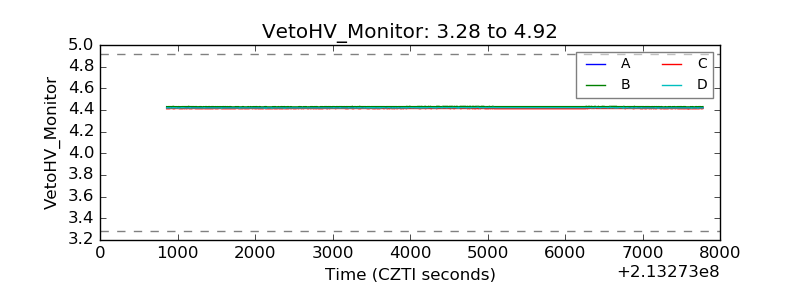 |
| Veto LLD | 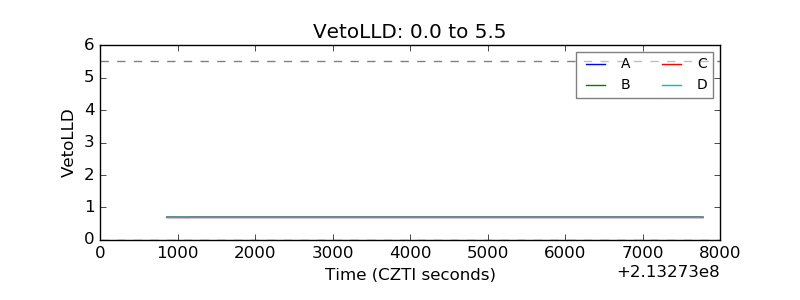 |
| Alpha Counter | 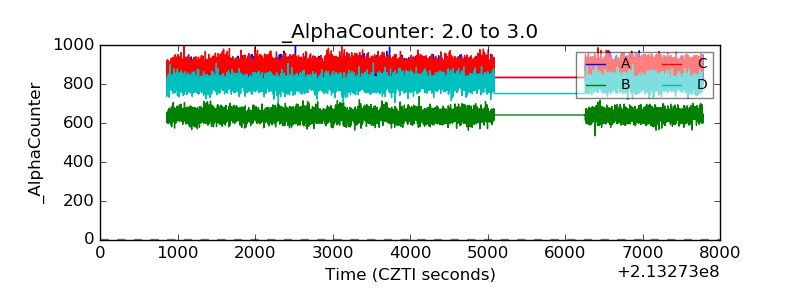 |
| _CPM_Rate | 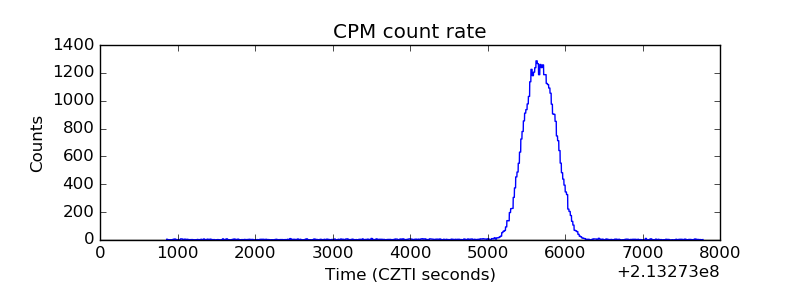 |
| CZT Counter | 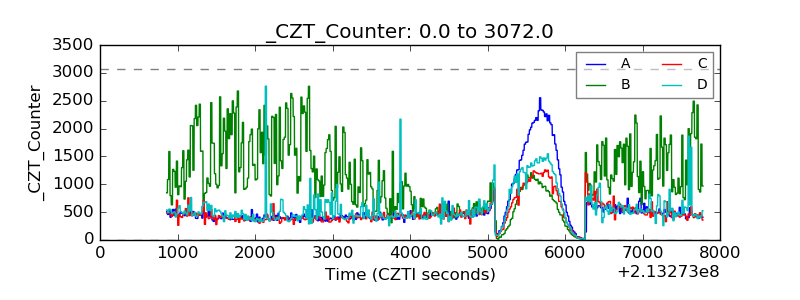 |
| +2.5 Volts monitor |  |
| +5 Volts monitor | 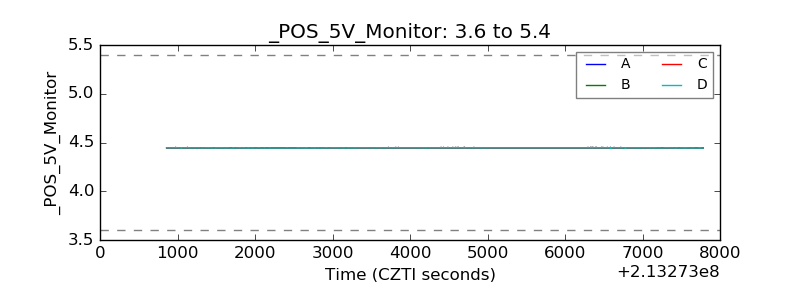 |
| _ROLL_ROT | 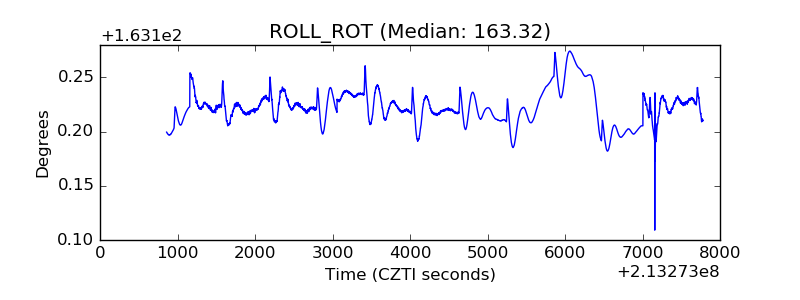 |
| _Roll_DEC | 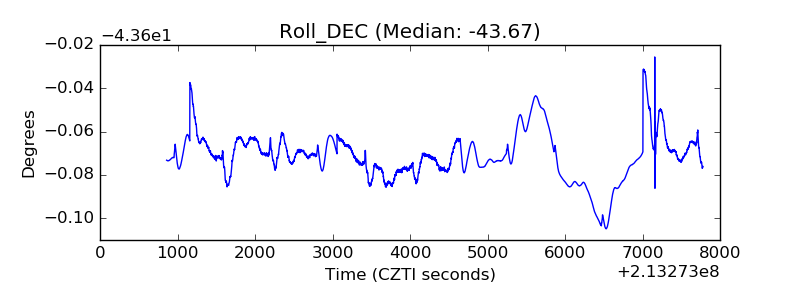 |
| _Roll_RA | 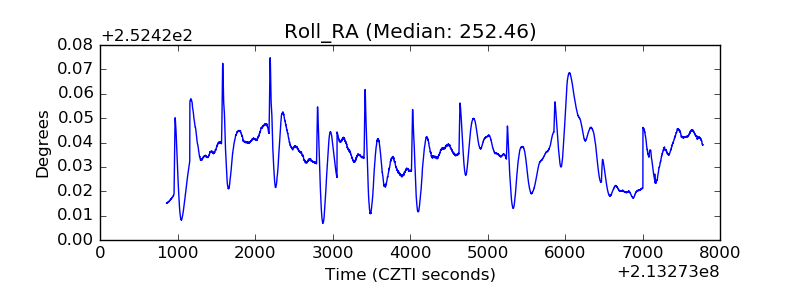 |
| Veto Counter | 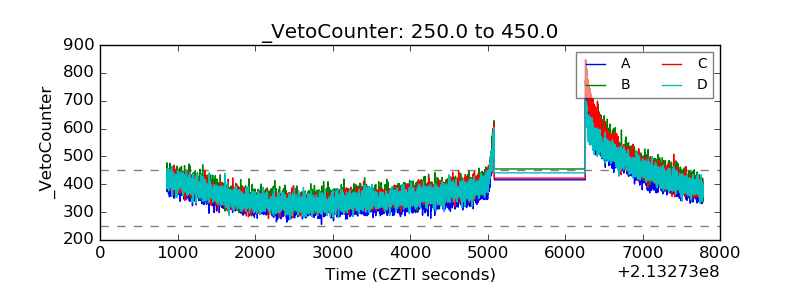 |