| Param | Original file | Final file |
|---|---|---|
| Filename | modeM0/AS1A02_162T01_9000000704_05513cztM0_level2.evt | modeM0/AS1A02_162T01_9000000704_05513cztM0_level2_quad_clean.evt |
| Size (bytes) | 581,898,240 | 65,283,840 |
| Size | 554.9 MB | 62.3 MB |
| Events in quadrant A | 2,811,796 | 423,498 |
| Events in quadrant B | 8,487,375 | 323,401 |
| Events in quadrant C | 2,669,452 | 421,688 |
| Events in quadrant D | 3,262,290 | 403,089 |
| Mode M0 | |||
|---|---|---|---|
| Quadrant | BADHDUFLAG | Total packets | Discarded packets |
| A | 0 | 12320 | 2 |
| B | 0 | 29056 | 1 |
| C | 0 | 11984 | 1 |
| D | 0 | 13623 | 1 |
| Mode SS | |||
|---|---|---|---|
| Quadrant | BADHDUFLAG | Total packets | Discarded packets |
| A | 0 | 118 | 0 |
| B | 0 | 118 | 0 |
| C | 0 | 118 | 0 |
| D | 0 | 118 | 0 |
| Mode M9 | |||
|---|---|---|---|
| Quadrant | BADHDUFLAG | Total packets | Discarded packets |
| A | 0 | 12 | 0 |
| B | 0 | 12 | 0 |
| C | 0 | 12 | 0 |
| D | 0 | 12 | 0 |
| Quadrant | Total seconds | Saturated seconds | Saturation percentage |
|---|---|---|---|
| A | 5778 | 117 | 2.024922% |
| B | 5778 | 2080 | 35.998615% |
| C | 5778 | 48 | 0.830737% |
| D | 5778 | 115 | 1.990308% |
Noise dominated data is calculated using 1-second bins in cleaned event files. If a bin has >2000 counts, and if more than 50% of those come from <1% of pixels, then it is considered to be noise-dominated and hence unusable.
| Quadrant | # 1 sec bins | Bins with >0 counts | Bins with >2000 counts | High rate bins dominated by noise | Noise dominated (total time) | Noise dominated (detector-on time) | Marked lightcurve |
|---|---|---|---|---|---|---|---|
| A | 6983 | 5779 | 34 | 34 | 0.49% | 0.59% |  |
| B | 6983 | 5779 | 1845 | 1845 | 26.42% | 31.93% |  |
| C | 6983 | 5779 | 4 | 4 | 0.06% | 0.07% |  |
| D | 6983 | 5779 | 60 | 60 | 0.86% | 1.04% |  |
Top three noisy pixels from each quadrant. If the there are fewer than three noisy pixels in the level2.evt file, extra rows are filled as -1
| Pixel properties | Quadrant properties | ||||||
|---|---|---|---|---|---|---|---|
| Quadrant | DetID | PixID | Counts | Sigma | Mean | Median | Sigma |
| A | 0 | 50 | 147034 | 1039.78 | 686 | 672 | 140.8 |
| A | 3 | 1 | 10891 | 72.6 | 686 | 672 | 140.8 |
| A | 13 | 14 | 6958 | 44.66 | 686 | 672 | 140.8 |
| B | 15 | 255 | 5414036 | 46260.09 | 612 | 600 | 117.0 |
| B | 15 | 204 | 574433 | 4903.64 | 612 | 600 | 117.0 |
| B | 11 | 51 | 31947 | 267.87 | 612 | 600 | 117.0 |
| C | 1 | 16 | 75420 | 490.15 | 655 | 657 | 152.5 |
| C | 9 | 247 | 19175 | 121.4 | 655 | 657 | 152.5 |
| C | 12 | 4 | 13209 | 82.29 | 655 | 657 | 152.5 |
| D | 11 | 192 | 361924 | 2241.07 | 656 | 636 | 161.2 |
| D | 2 | 152 | 184444 | 1140.16 | 656 | 636 | 161.2 |
| D | 8 | 195 | 99052 | 610.48 | 656 | 636 | 161.2 |
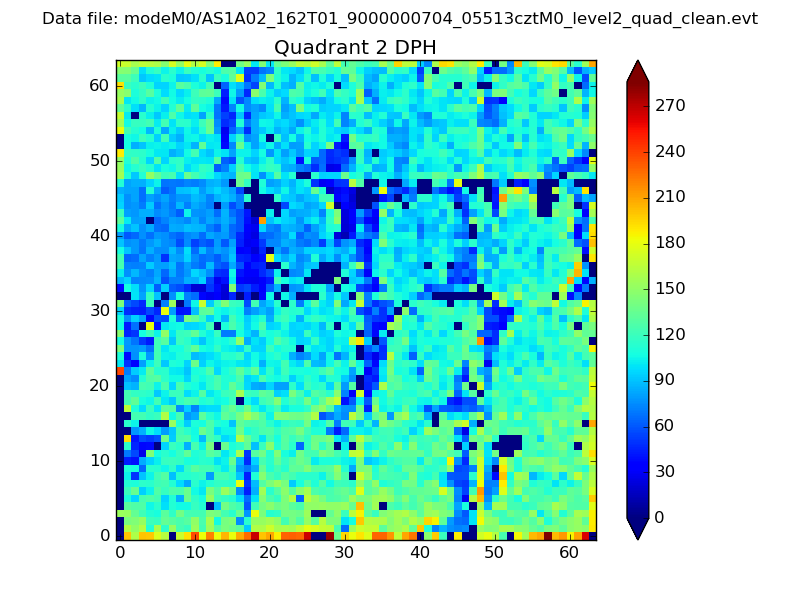
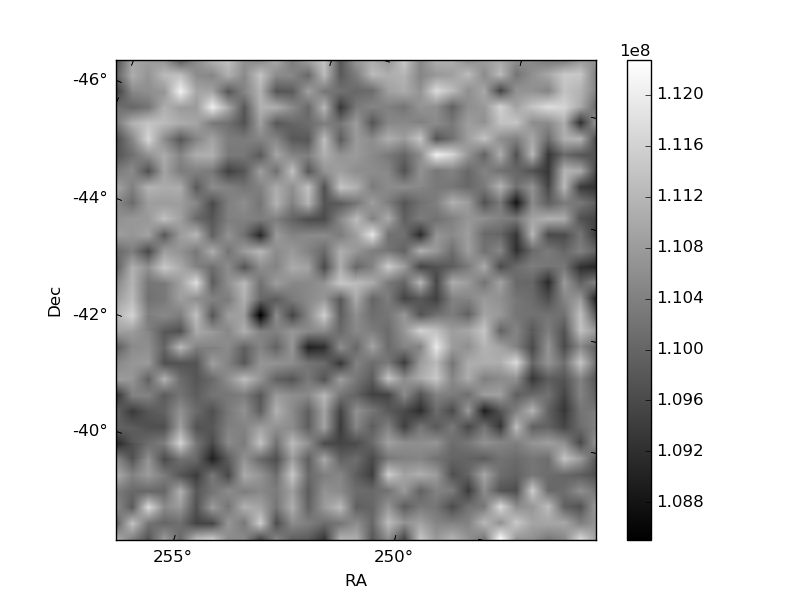
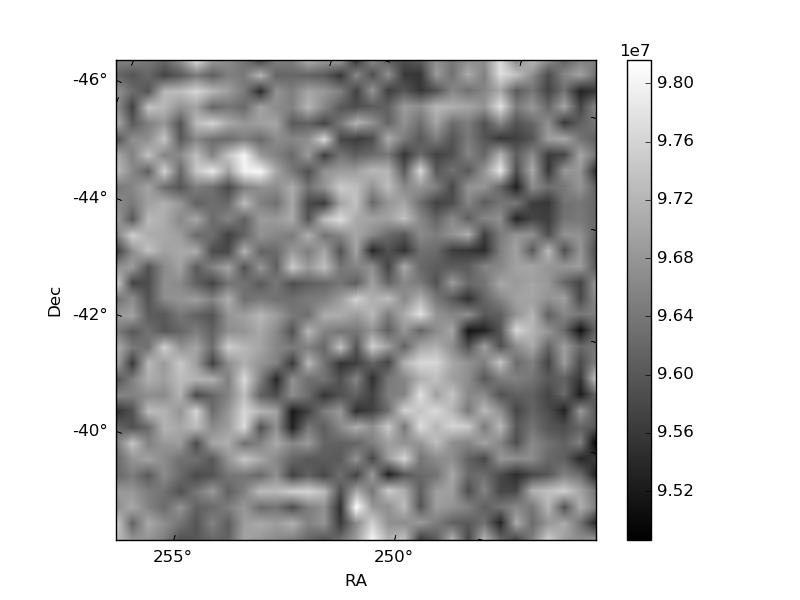
Histogram calculated using DETX and DETY for each event in the final _common_clean file
| Quadrant A | 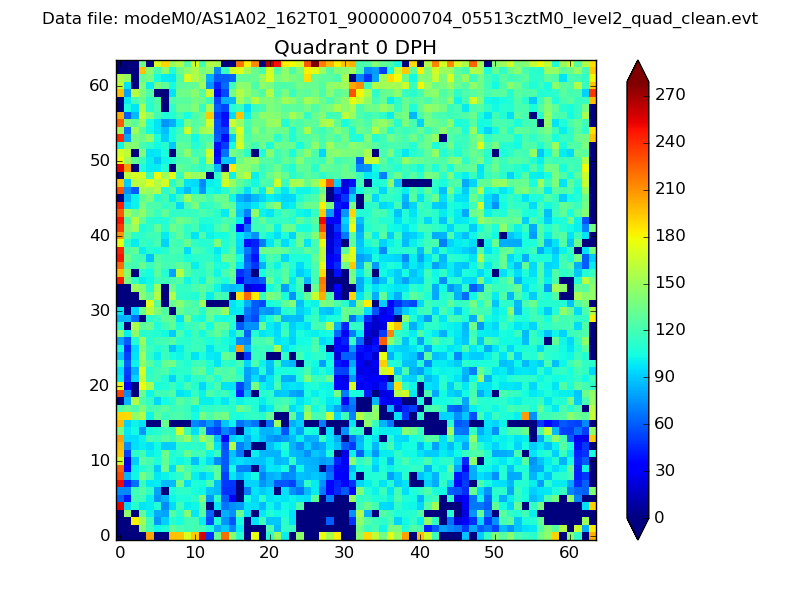 |
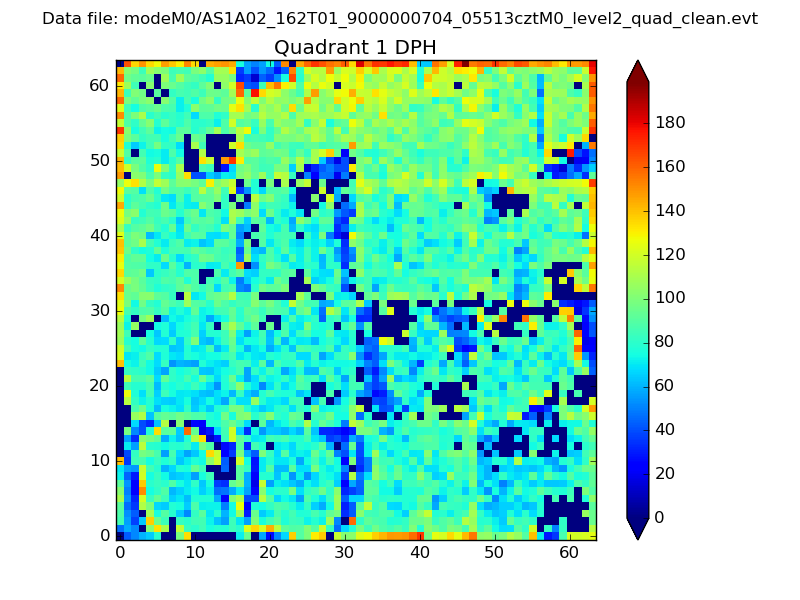 |
Quadrant B |
|---|---|---|---|
| Quadrant D | 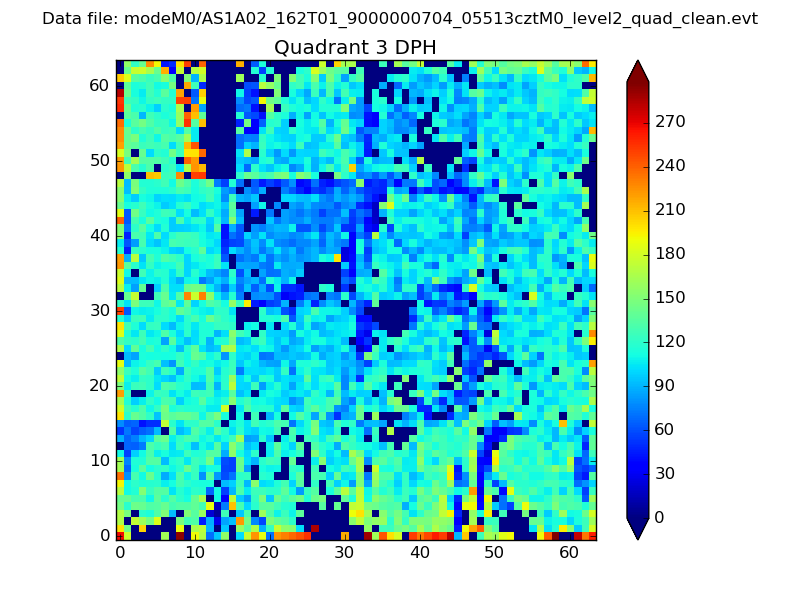 |
 |
Quadrant C |
| Plot type | Count rate plots | Images |
|---|---|---|
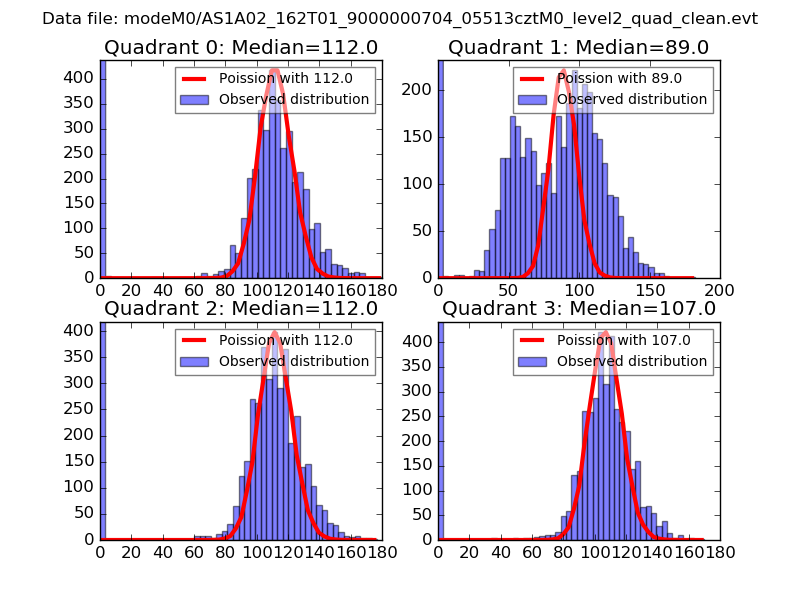
| Comparison with Poisson distribution Blue bars denote a histogram of data divided into 1 sec bins. Red curve is a Poisson curve with rate = median count rate of data. |
 |
 |
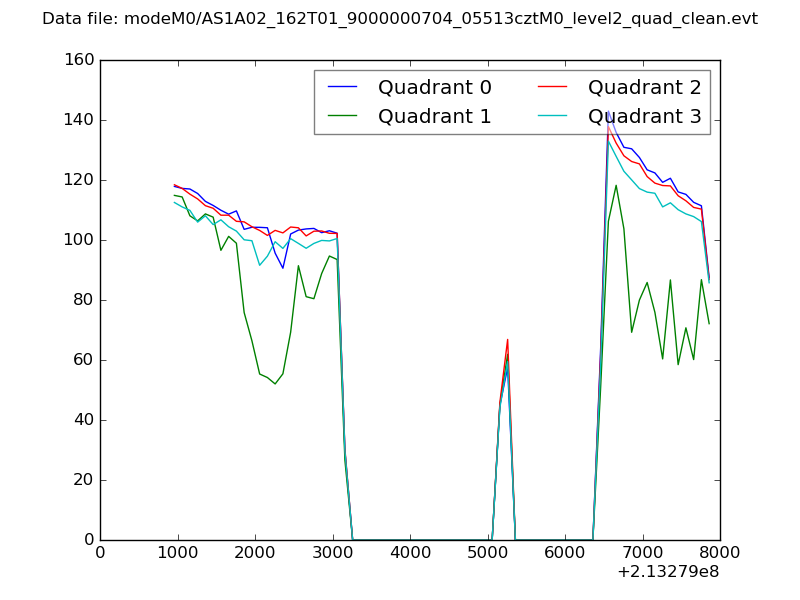
| Quadrant-wise count rates Data is divided into 100 sec bins |
 |
|
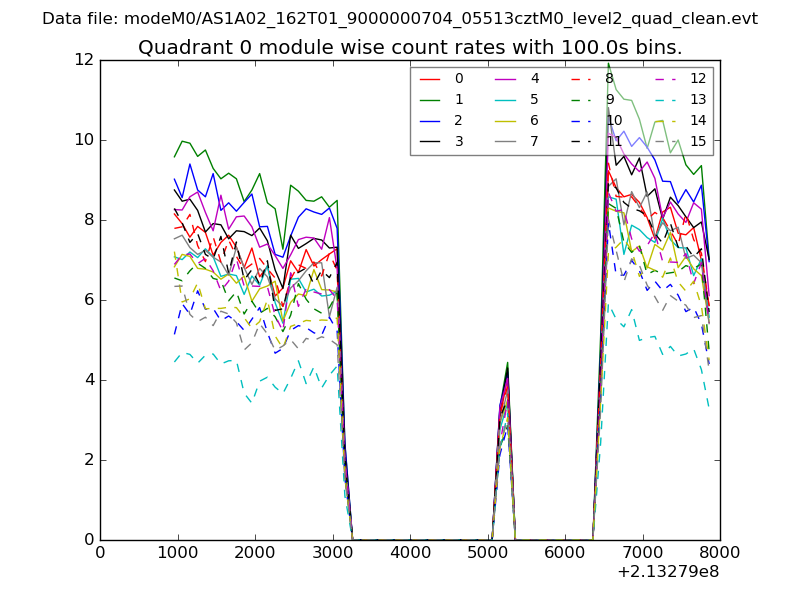
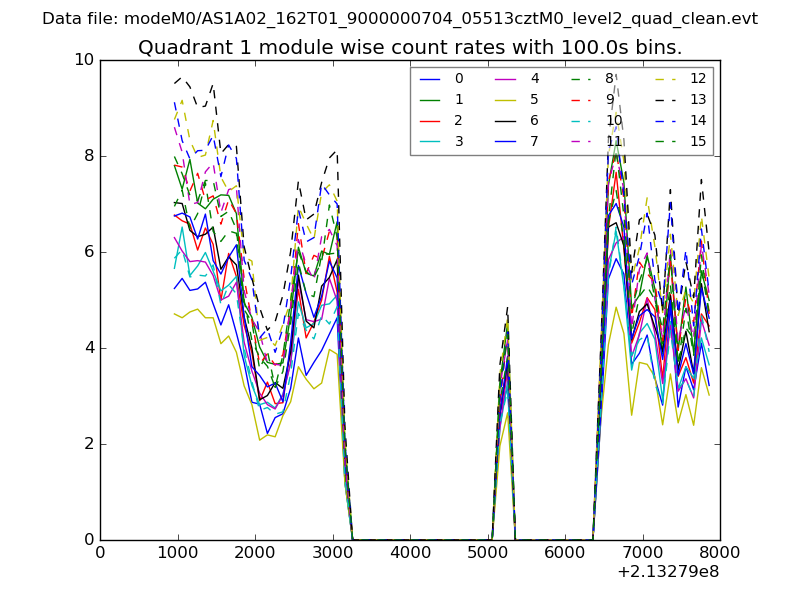
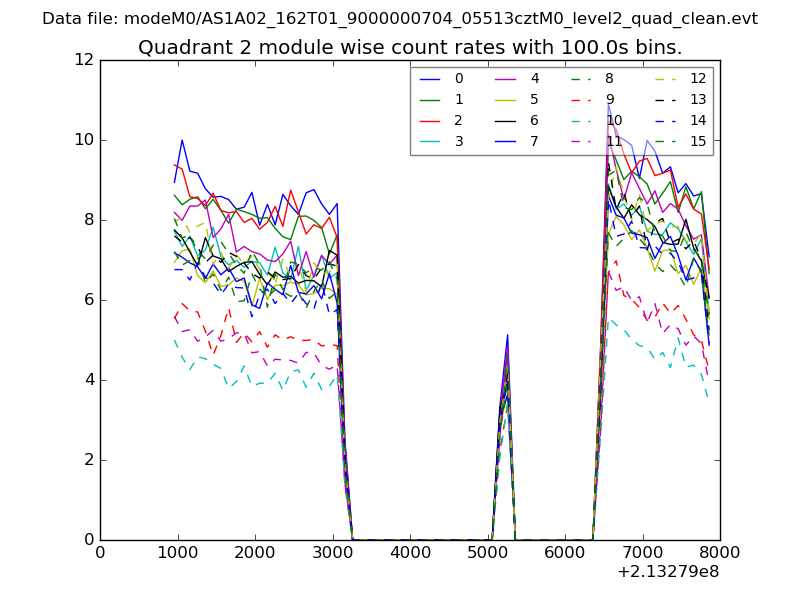
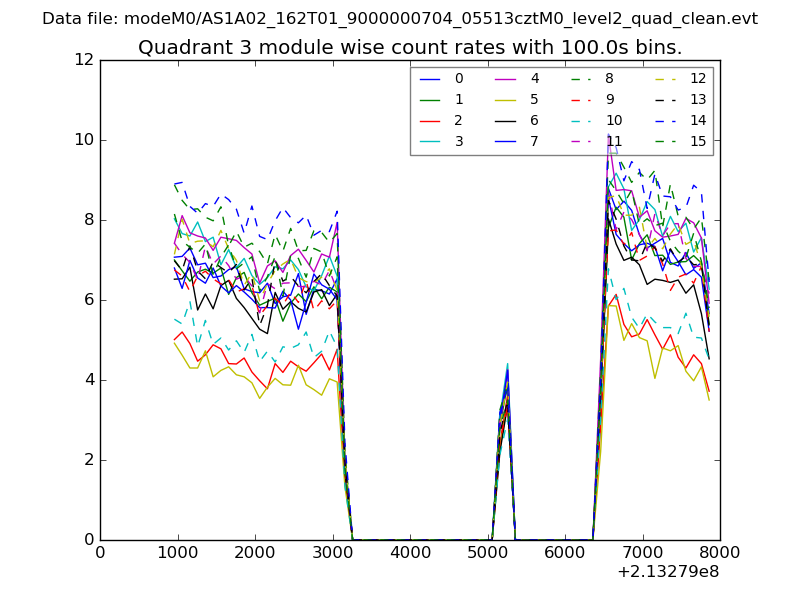
| Module-wise count rates for Quadrant A Data is divided into 100 sec bins |
 |
 |
| Module-wise count rates for Quadrant B Data is divided into 100 sec bins |
 |
 |
| Module-wise count rates for Quadrant C Data is divided into 100 sec bins |
 |
 |
| Module-wise count rates for Quadrant D Data is divided into 100 sec bins |
 |
 |
| Parameter | Plot |
|---|---|
| CZT HV Monitor | 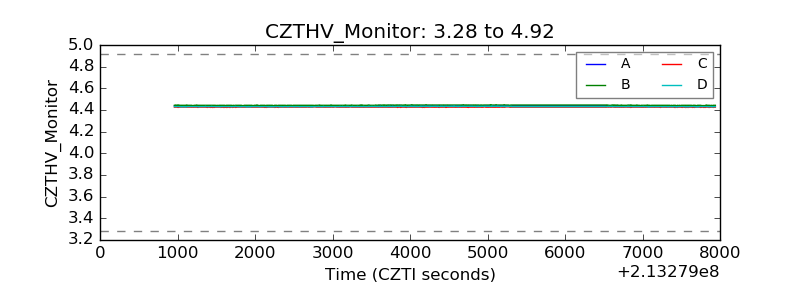 |
| D_VDD | 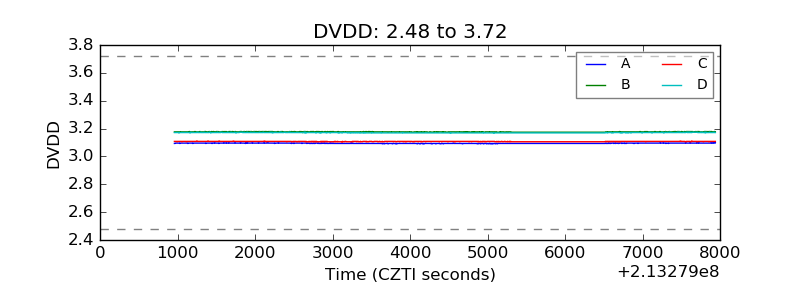 |
| Temperature 1 | 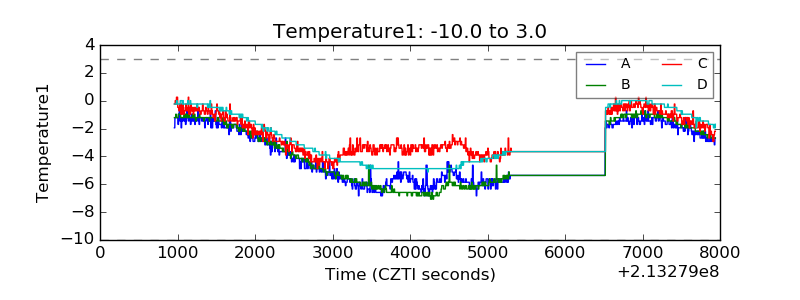 |
| Veto HV Monitor | 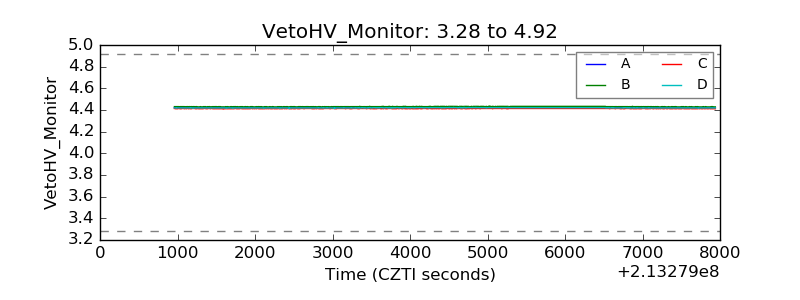 |
| Veto LLD | 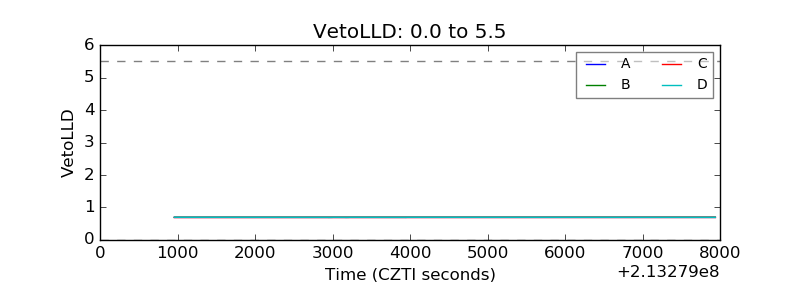 |
| Alpha Counter | 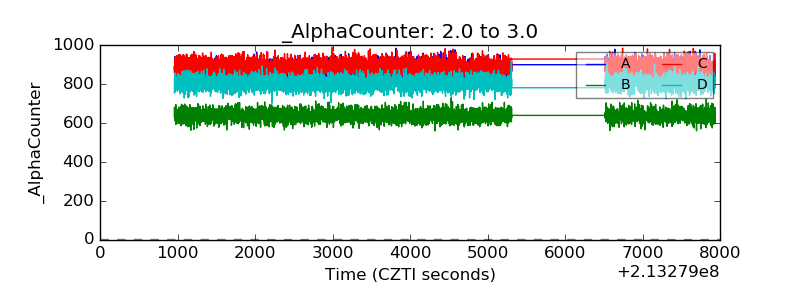 |
| _CPM_Rate | 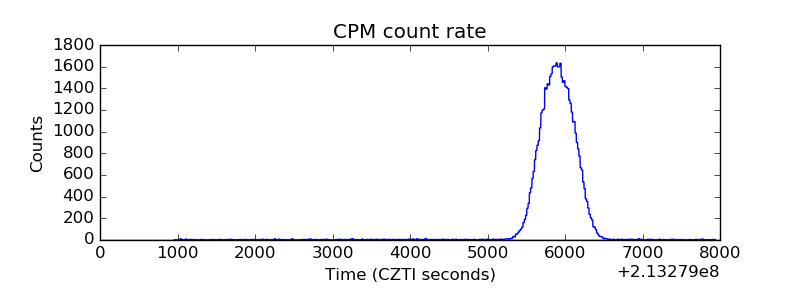 |
| CZT Counter | 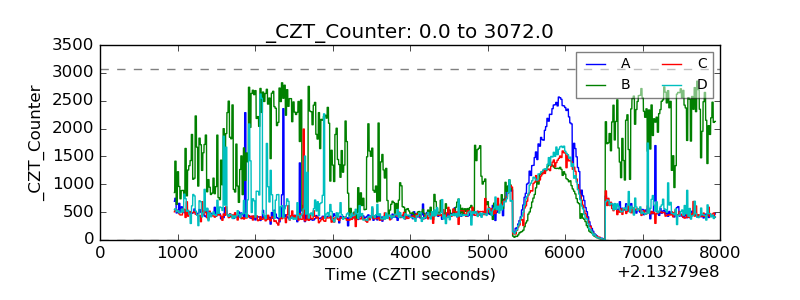 |
| +2.5 Volts monitor | 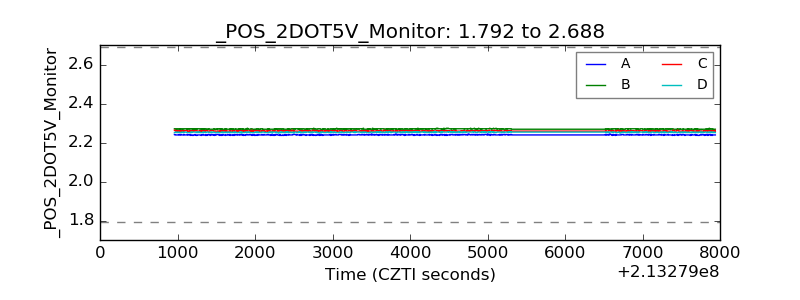 |
| +5 Volts monitor | 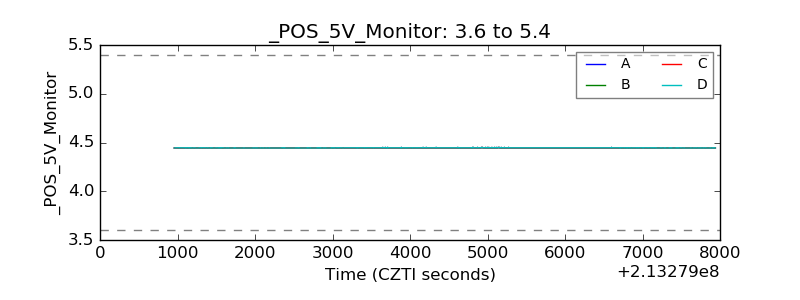 |
| _ROLL_ROT | 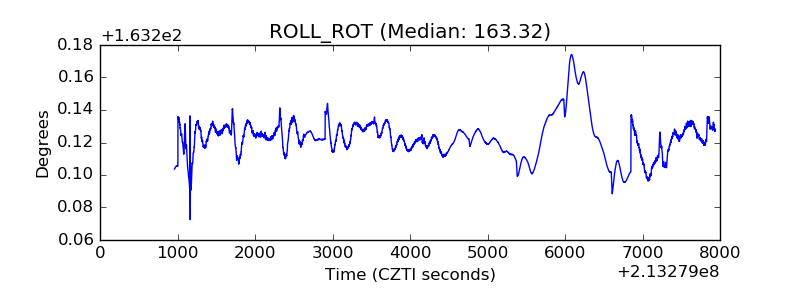 |
| _Roll_DEC | 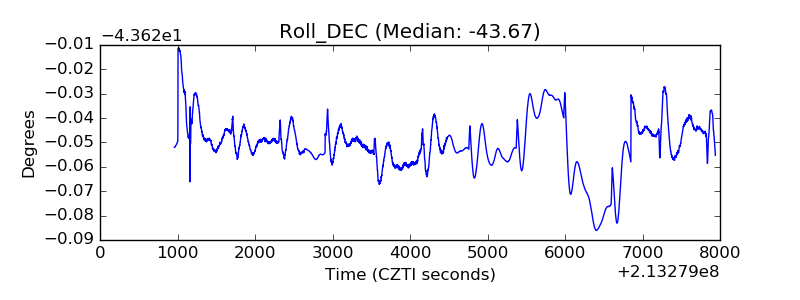 |
| _Roll_RA | 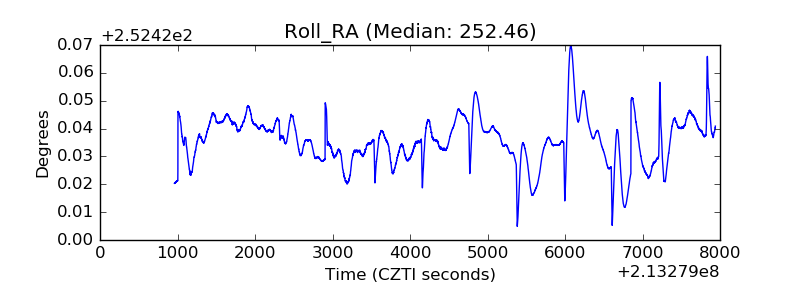 |
| Veto Counter | 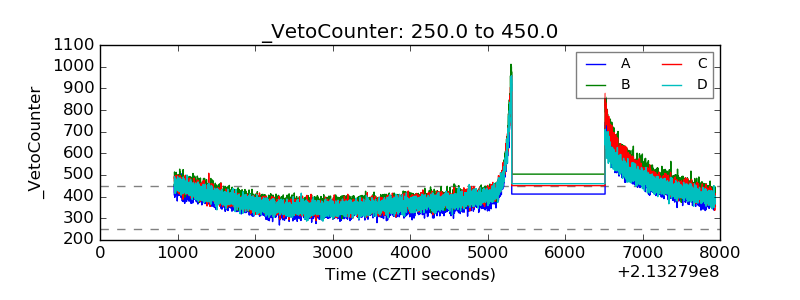 |