| Param | Original file | Final file |
|---|---|---|
| Filename | modeM0/AS1A02_162T01_9000000704_05515cztM0_level2.evt | modeM0/AS1A02_162T01_9000000704_05515cztM0_level2_quad_clean.evt |
| Size (bytes) | 572,293,440 | 67,881,600 |
| Size | 545.8 MB | 64.7 MB |
| Events in quadrant A | 2,730,496 | 441,286 |
| Events in quadrant B | 8,255,675 | 351,326 |
| Events in quadrant C | 2,925,642 | 434,463 |
| Events in quadrant D | 3,019,581 | 414,563 |
| Mode M0 | |||
|---|---|---|---|
| Quadrant | BADHDUFLAG | Total packets | Discarded packets |
| A | 0 | 12220 | 2 |
| B | 0 | 28554 | 1 |
| C | 0 | 12737 | 1 |
| D | 0 | 13106 | 1 |
| Mode SS | |||
|---|---|---|---|
| Quadrant | BADHDUFLAG | Total packets | Discarded packets |
| A | 0 | 118 | 0 |
| B | 0 | 118 | 0 |
| C | 0 | 118 | 0 |
| D | 0 | 118 | 0 |
| Mode M9 | |||
|---|---|---|---|
| Quadrant | BADHDUFLAG | Total packets | Discarded packets |
| A | 0 | 13 | 0 |
| B | 0 | 13 | 0 |
| C | 0 | 13 | 0 |
| D | 0 | 13 | 0 |
| Quadrant | Total seconds | Saturated seconds | Saturation percentage |
|---|---|---|---|
| A | 5917 | 31 | 0.523914% |
| B | 5917 | 1753 | 29.626500% |
| C | 5917 | 34 | 0.574616% |
| D | 5917 | 33 | 0.557715% |
Noise dominated data is calculated using 1-second bins in cleaned event files. If a bin has >2000 counts, and if more than 50% of those come from <1% of pixels, then it is considered to be noise-dominated and hence unusable.
| Quadrant | # 1 sec bins | Bins with >0 counts | Bins with >2000 counts | High rate bins dominated by noise | Noise dominated (total time) | Noise dominated (detector-on time) | Marked lightcurve |
|---|---|---|---|---|---|---|---|
| A | 7192 | 5918 | 0 | 0 | 0.00% | 0.00% | 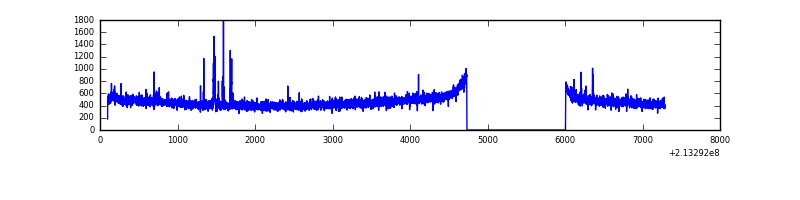 |
| B | 7192 | 5918 | 1627 | 1627 | 22.62% | 27.49% | 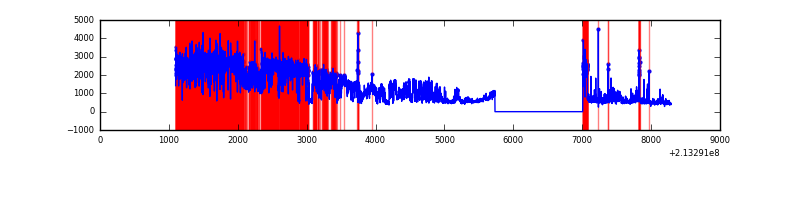 |
| C | 7192 | 5918 | 12 | 12 | 0.17% | 0.20% |  |
| D | 7192 | 5918 | 12 | 12 | 0.17% | 0.20% | 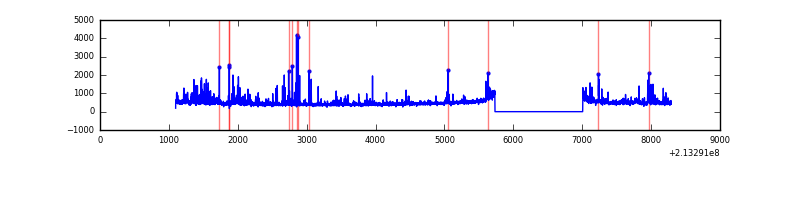 |
Top three noisy pixels from each quadrant. If the there are fewer than three noisy pixels in the level2.evt file, extra rows are filled as -1
| Pixel properties | Quadrant properties | ||||||
|---|---|---|---|---|---|---|---|
| Quadrant | DetID | PixID | Counts | Sigma | Mean | Median | Sigma |
| A | 0 | 50 | 37942 | 262.72 | 694 | 682 | 141.8 |
| A | 3 | 1 | 9468 | 61.95 | 694 | 682 | 141.8 |
| A | 0 | 226 | 7000 | 44.55 | 694 | 682 | 141.8 |
| B | 15 | 255 | 5323965 | 45061.25 | 624 | 609 | 118.1 |
| B | 15 | 204 | 211229 | 1782.86 | 624 | 609 | 118.1 |
| B | 0 | 219 | 97681 | 821.7 | 624 | 609 | 118.1 |
| C | 9 | 247 | 151154 | 978.57 | 665 | 668 | 153.8 |
| C | 1 | 16 | 148371 | 960.47 | 665 | 668 | 153.8 |
| C | 8 | 128 | 10567 | 64.37 | 665 | 668 | 153.8 |
| D | 2 | 152 | 149571 | 927.54 | 661 | 639 | 160.6 |
| D | 11 | 192 | 128597 | 796.91 | 661 | 639 | 160.6 |
| D | 8 | 195 | 88962 | 550.07 | 661 | 639 | 160.6 |
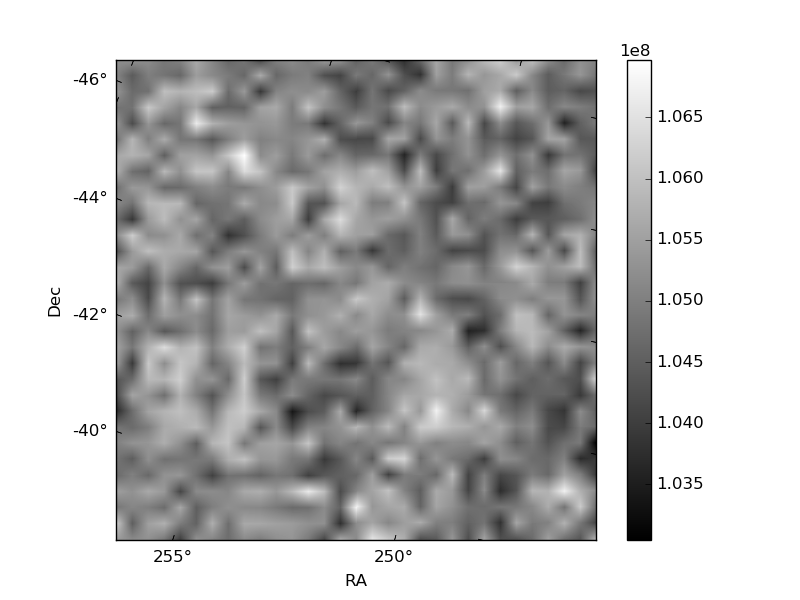
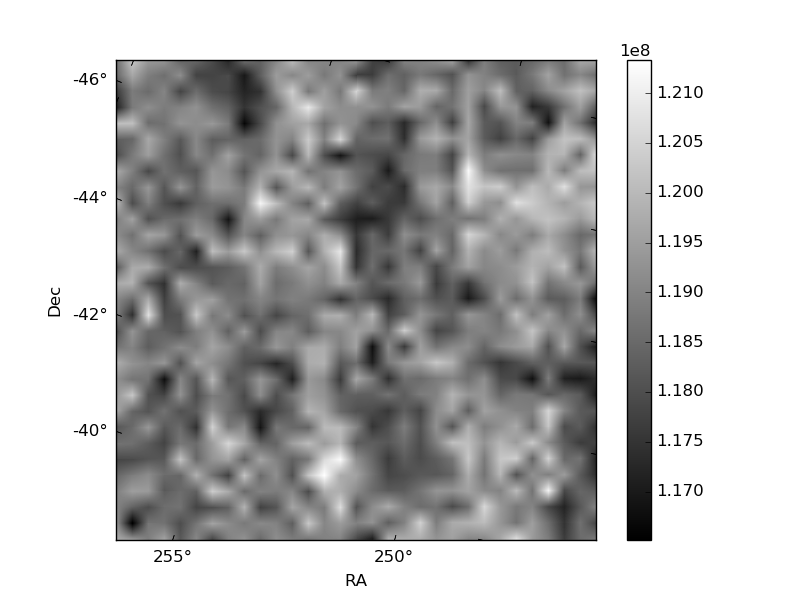
Histogram calculated using DETX and DETY for each event in the final _common_clean file
| Quadrant A | 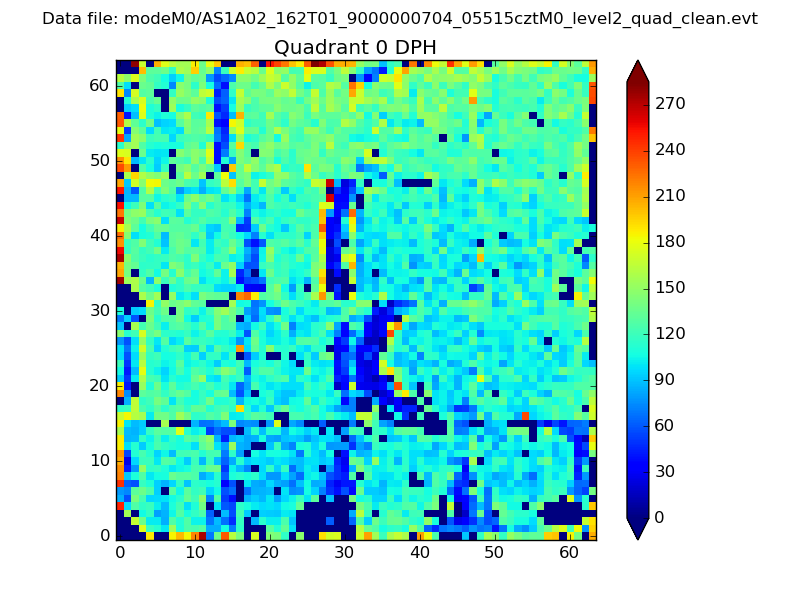 |
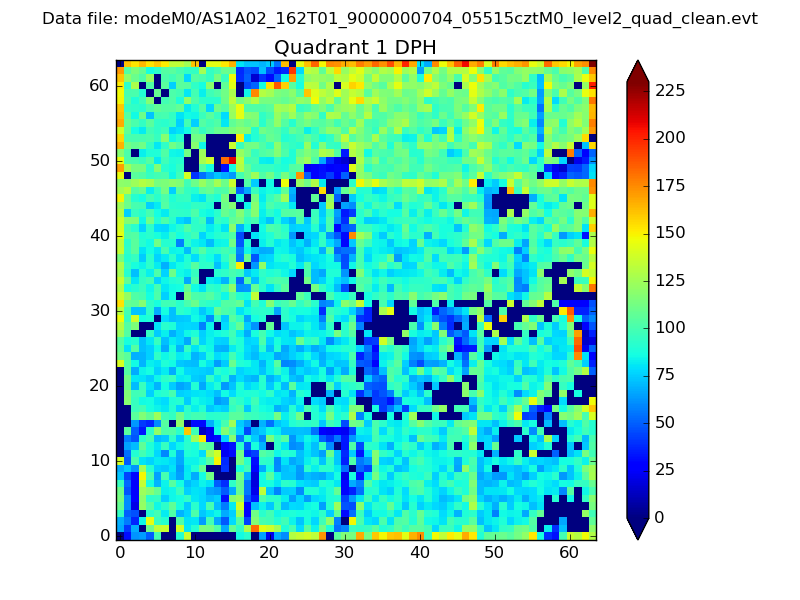 |
Quadrant B |
|---|---|---|---|
| Quadrant D |  |
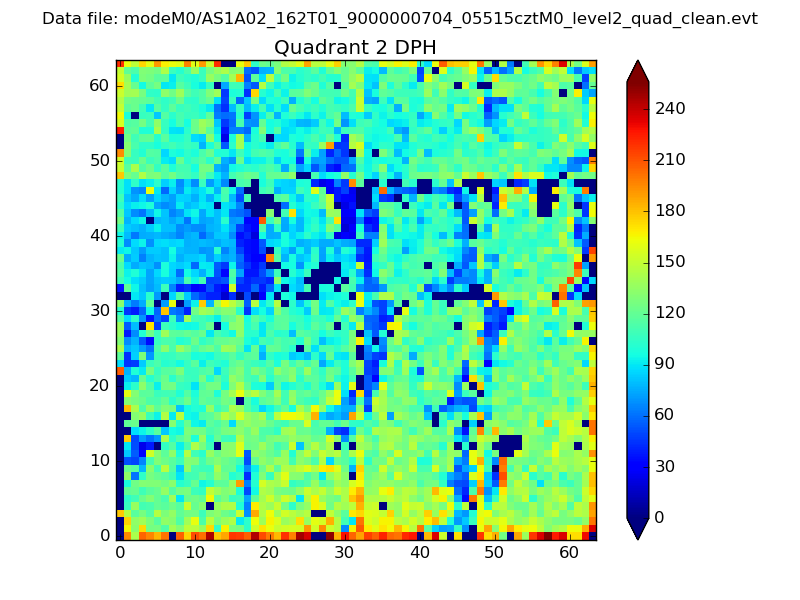 |
Quadrant C |
| Plot type | Count rate plots | Images |
|---|---|---|
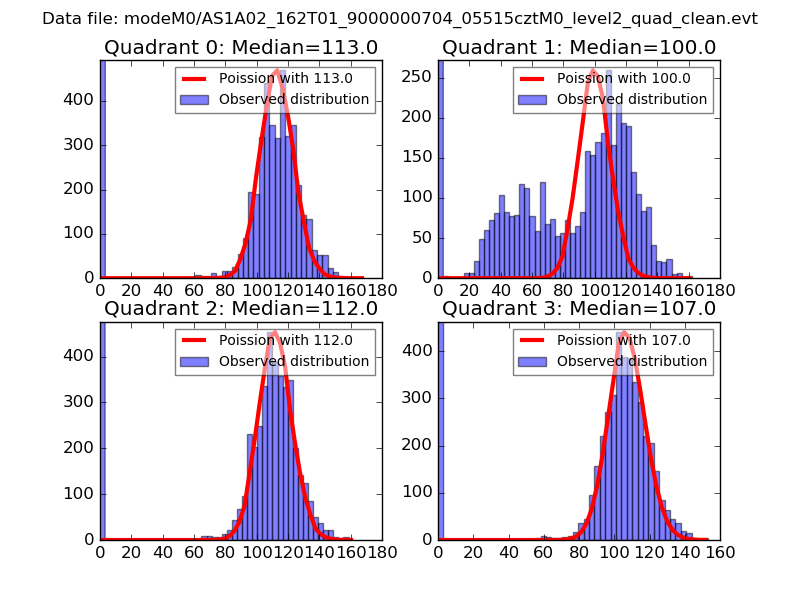
| Comparison with Poisson distribution Blue bars denote a histogram of data divided into 1 sec bins. Red curve is a Poisson curve with rate = median count rate of data. |
 |
 |
| Quadrant-wise count rates Data is divided into 100 sec bins |
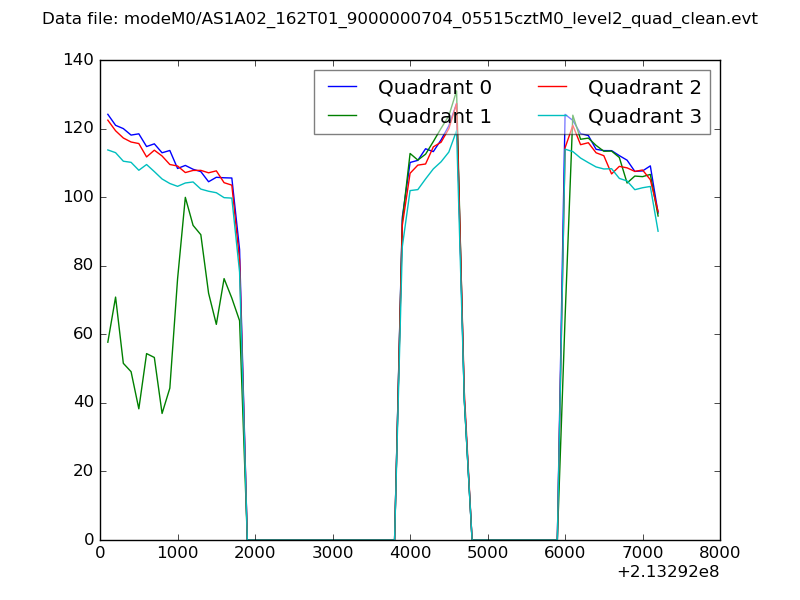 |
|
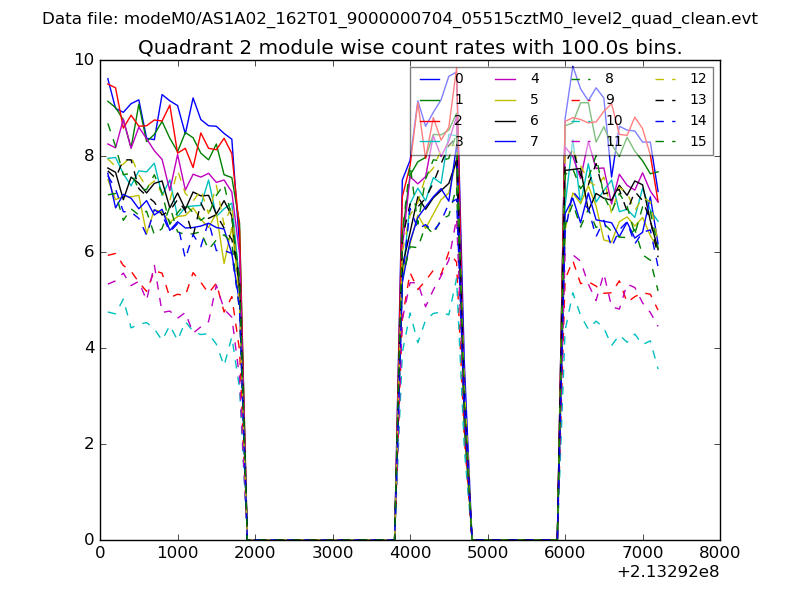
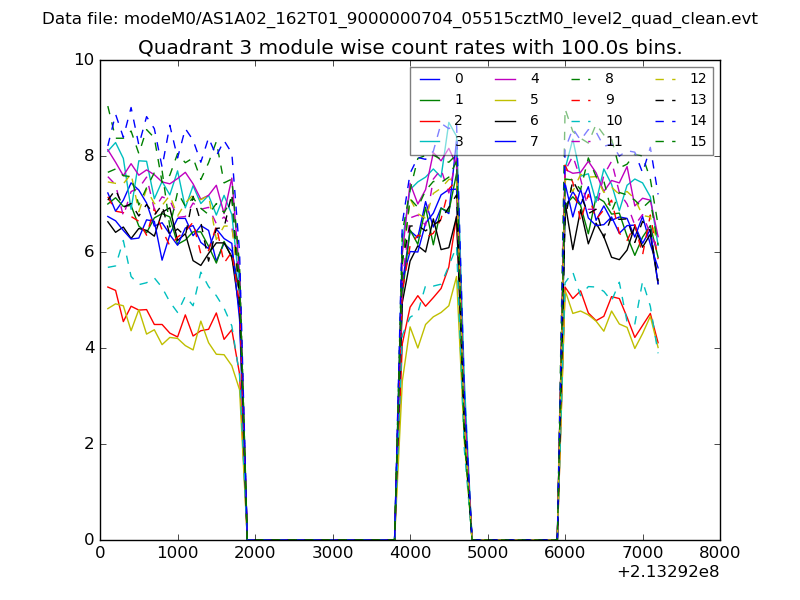
| Module-wise count rates for Quadrant A Data is divided into 100 sec bins |
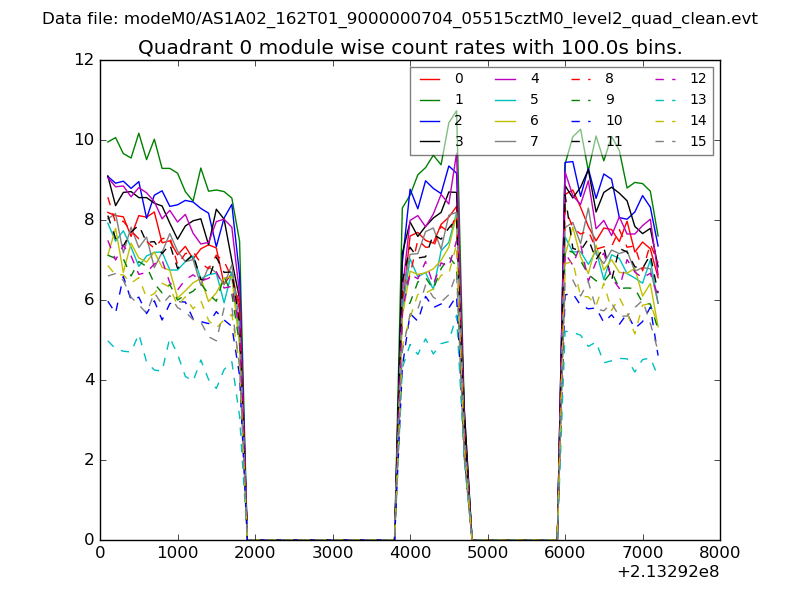 |
 |
| Module-wise count rates for Quadrant B Data is divided into 100 sec bins |
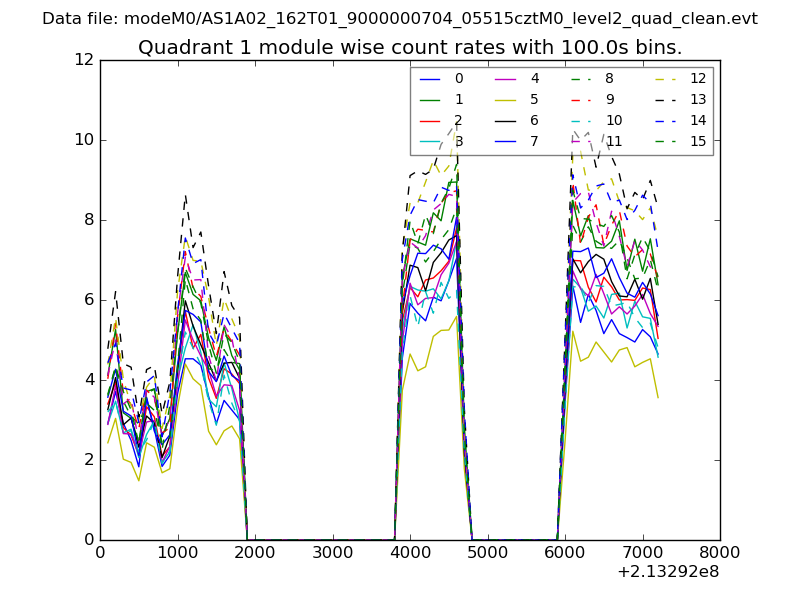 |
 |
| Module-wise count rates for Quadrant C Data is divided into 100 sec bins |
 |
 |
| Module-wise count rates for Quadrant D Data is divided into 100 sec bins |
 |
 |
| Parameter | Plot |
|---|---|
| CZT HV Monitor | 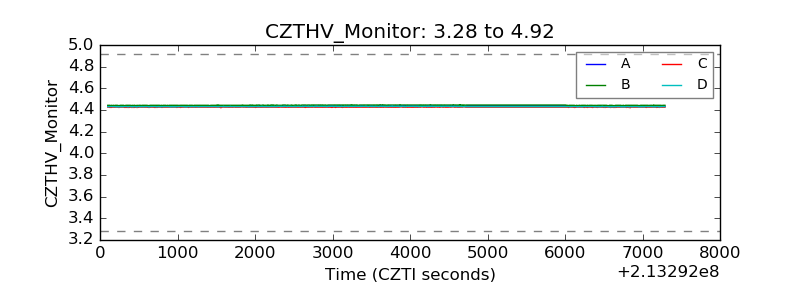 |
| D_VDD | 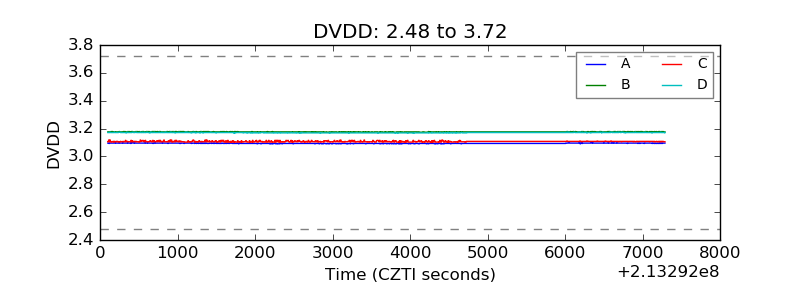 |
| Temperature 1 | 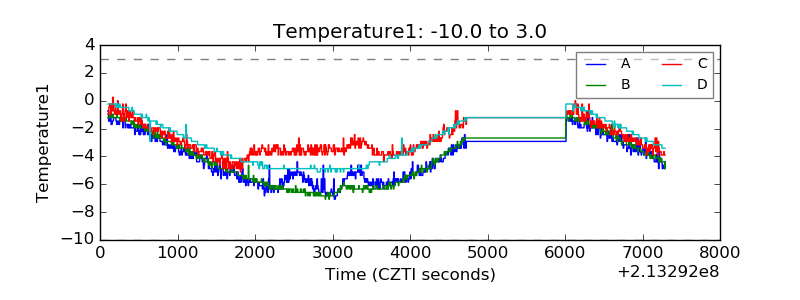 |
| Veto HV Monitor |  |
| Veto LLD | 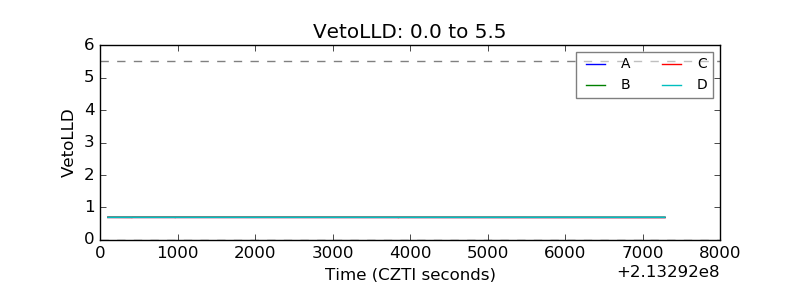 |
| Alpha Counter |  |
| _CPM_Rate | 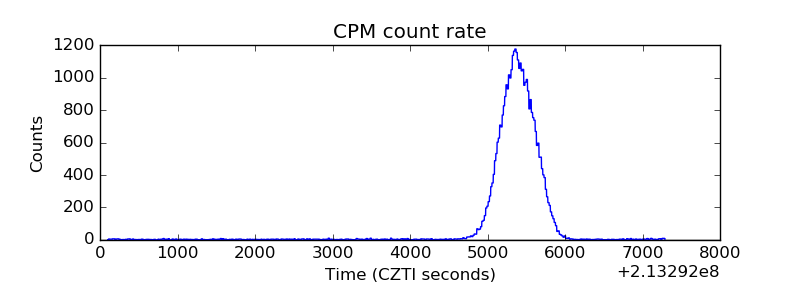 |
| CZT Counter | 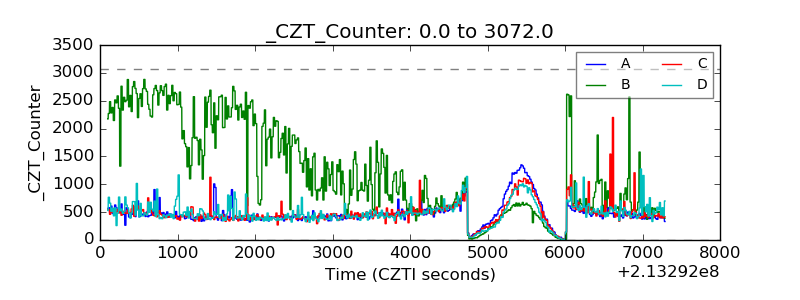 |
| +2.5 Volts monitor |  |
| +5 Volts monitor |  |
| _ROLL_ROT | 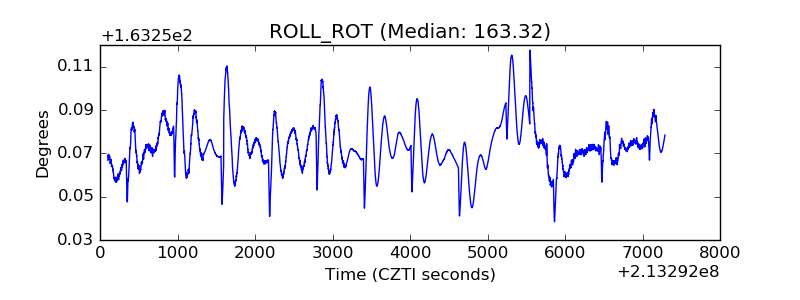 |
| _Roll_DEC | 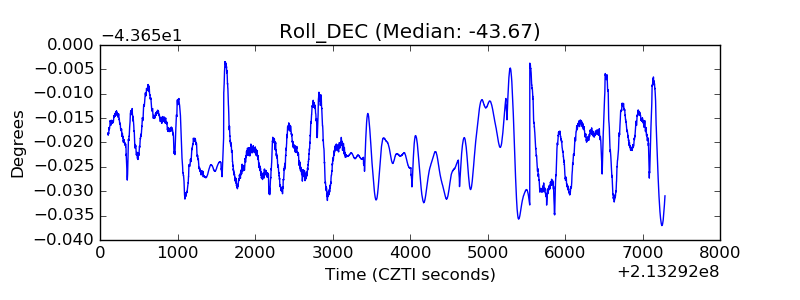 |
| _Roll_RA | 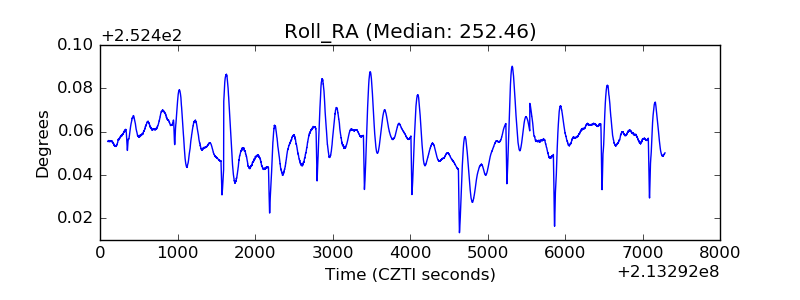 |
| Veto Counter | 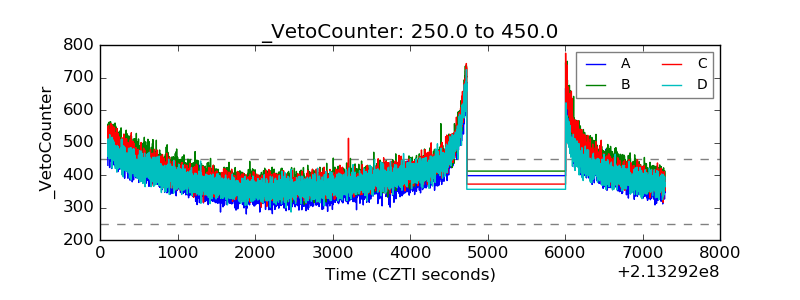 |