| Param | Original file | Final file |
|---|---|---|
| Filename | modeM0/AS1A02_162T01_9000000704_05517cztM0_level2.evt | modeM0/AS1A02_162T01_9000000704_05517cztM0_level2_quad_clean.evt |
| Size (bytes) | 8,015,040 | 1,278,720 |
| Size | 7.6 MB | 1.2 MB |
| Events in quadrant A | 36,304 | 6,674 |
| Events in quadrant B | 79,560 | 5,791 |
| Events in quadrant C | 56,649 | 6,634 |
| Events in quadrant D | 62,301 | 6,078 |
| Mode M0 | |||
|---|---|---|---|
| Quadrant | BADHDUFLAG | Total packets | Discarded packets |
| A | 0 | 157 | 1 |
| B | 0 | 277 | 1 |
| C | 0 | 209 | 1 |
| D | 0 | 229 | 1 |
| Mode SS | |||
|---|---|---|---|
| Quadrant | BADHDUFLAG | Total packets | Discarded packets |
| A | 0 | 2 | 0 |
| B | 0 | 2 | 0 |
| C | 0 | 2 | 0 |
| D | 0 | 2 | 0 |
| Mode M9 | |||
|---|---|---|---|
| Quadrant | BADHDUFLAG | Total packets | Discarded packets |
| A | 0 | 8 | 0 |
| B | 0 | 8 | 0 |
| C | 0 | 8 | 0 |
| D | 0 | 9 | 0 |
| Quadrant | Total seconds | Saturated seconds | Saturation percentage |
|---|---|---|---|
| A | 58 | 3 | 5.172414% |
| B | 58 | 27 | 46.551724% |
| C | 58 | 4 | 6.896552% |
| D | 58 | 5 | 8.620690% |
Noise dominated data is calculated using 1-second bins in cleaned event files. If a bin has >2000 counts, and if more than 50% of those come from <1% of pixels, then it is considered to be noise-dominated and hence unusable.
| Quadrant | # 1 sec bins | Bins with >0 counts | Bins with >2000 counts | High rate bins dominated by noise | Noise dominated (total time) | Noise dominated (detector-on time) | Marked lightcurve |
|---|---|---|---|---|---|---|---|
| A | 58 | 58 | 0 | 0 | 0.00% | 0.00% | 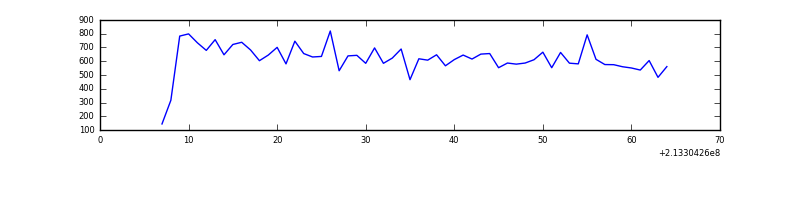 |
| B | 58 | 58 | 11 | 11 | 18.97% | 18.97% | 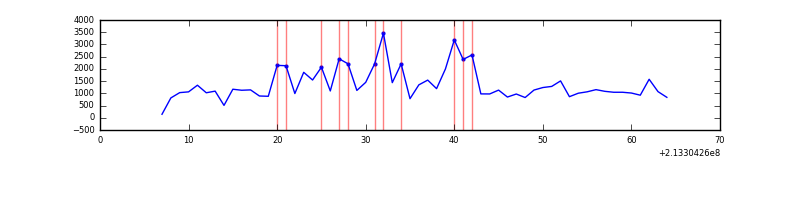 |
| C | 58 | 58 | 0 | 0 | 0.00% | 0.00% | 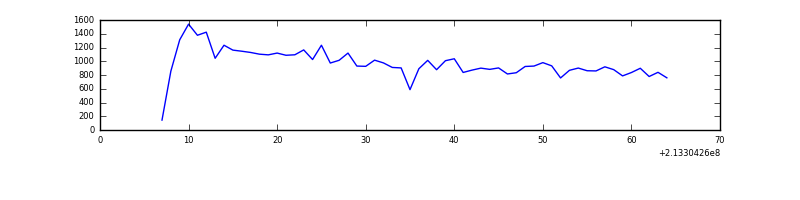 |
| D | 58 | 58 | 3 | 3 | 5.17% | 5.17% | 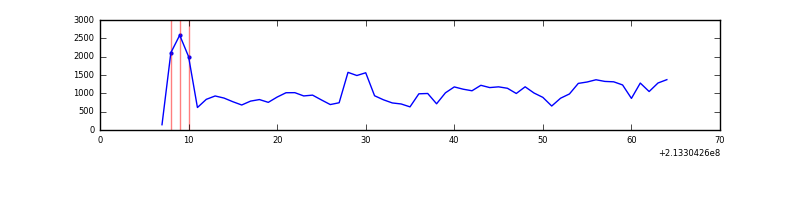 |
Top three noisy pixels from each quadrant. If the there are fewer than three noisy pixels in the level2.evt file, extra rows are filled as -1
| Pixel properties | Quadrant properties | ||||||
|---|---|---|---|---|---|---|---|
| Quadrant | DetID | PixID | Counts | Sigma | Mean | Median | Sigma |
| A | 13 | 6 | 292 | 76.76 | 9 | 9 | 3.7 |
| A | 8 | 15 | 97 | 23.87 | 9 | 9 | 3.7 |
| A | 0 | 226 | 95 | 23.33 | 9 | 9 | 3.7 |
| B | 10 | 16 | 33177 | 10011.32 | 8 | 7 | 3.3 |
| B | 15 | 204 | 9333 | 2814.76 | 8 | 7 | 3.3 |
| B | 0 | 219 | 1563 | 469.63 | 8 | 7 | 3.3 |
| C | 1 | 16 | 20821 | 5645.0 | 8 | 8 | 3.7 |
| C | 9 | 247 | 821 | 220.51 | 8 | 8 | 3.7 |
| C | 7 | 159 | 209 | 54.52 | 8 | 8 | 3.7 |
| D | 2 | 33 | 17119 | 4685.42 | 8 | 8 | 3.7 |
| D | 2 | 63 | 7298 | 1996.18 | 8 | 8 | 3.7 |
| D | 2 | 234 | 999 | 271.36 | 8 | 8 | 3.7 |
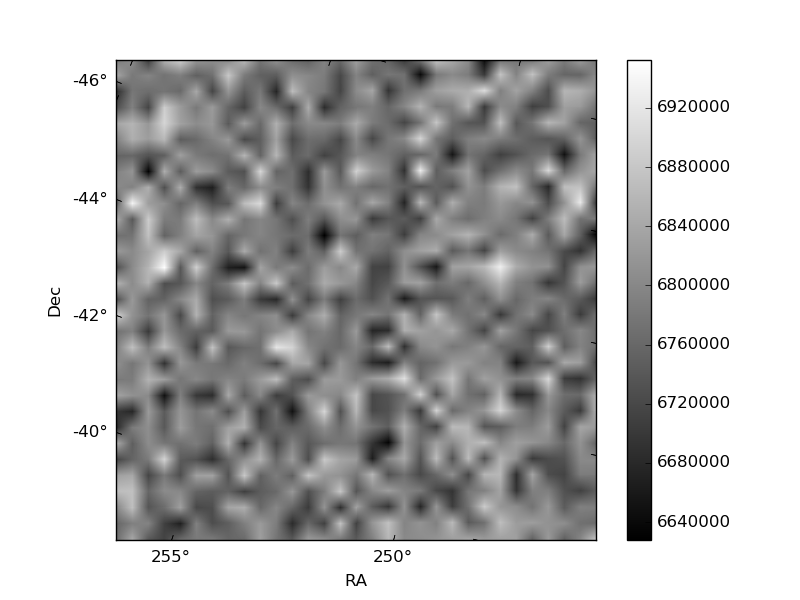
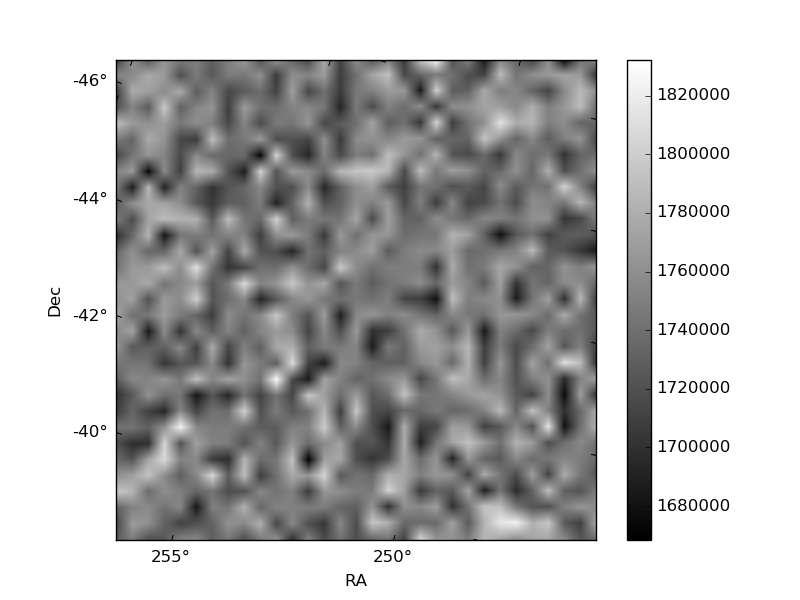
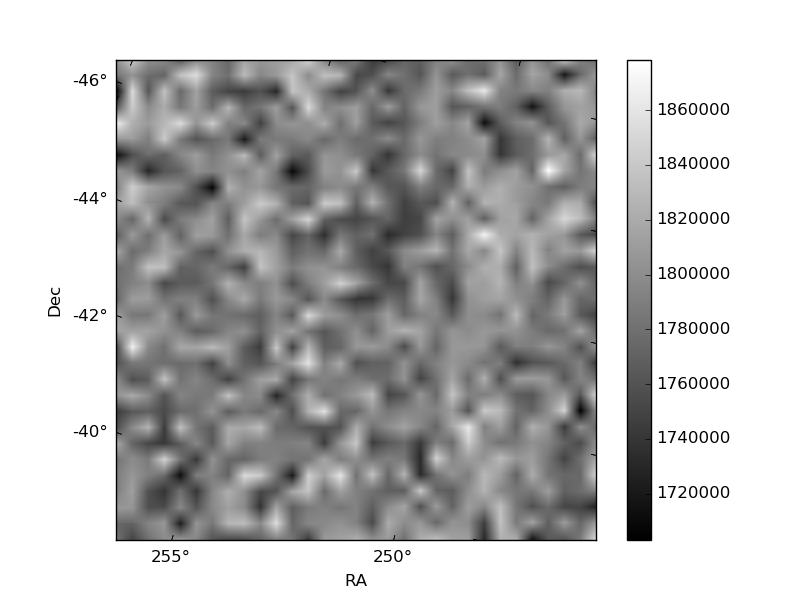
Histogram calculated using DETX and DETY for each event in the final _common_clean file
| Quadrant A | 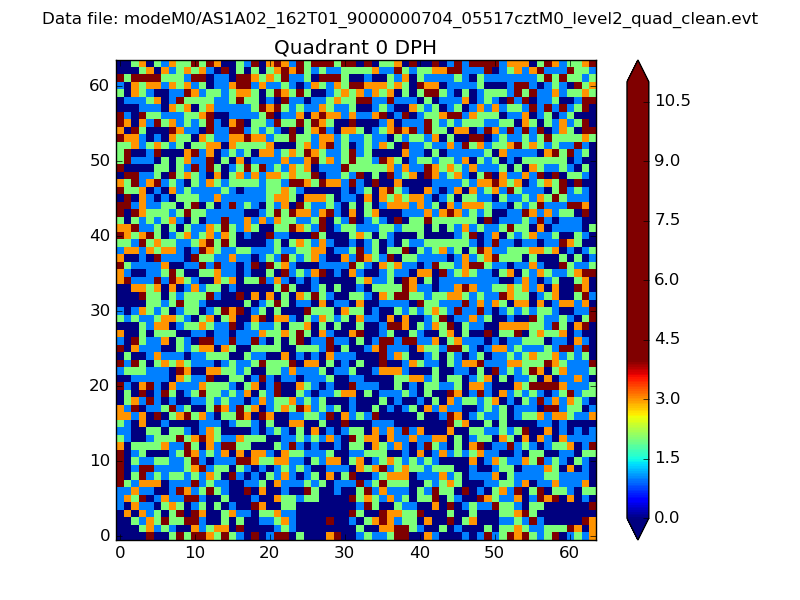 |
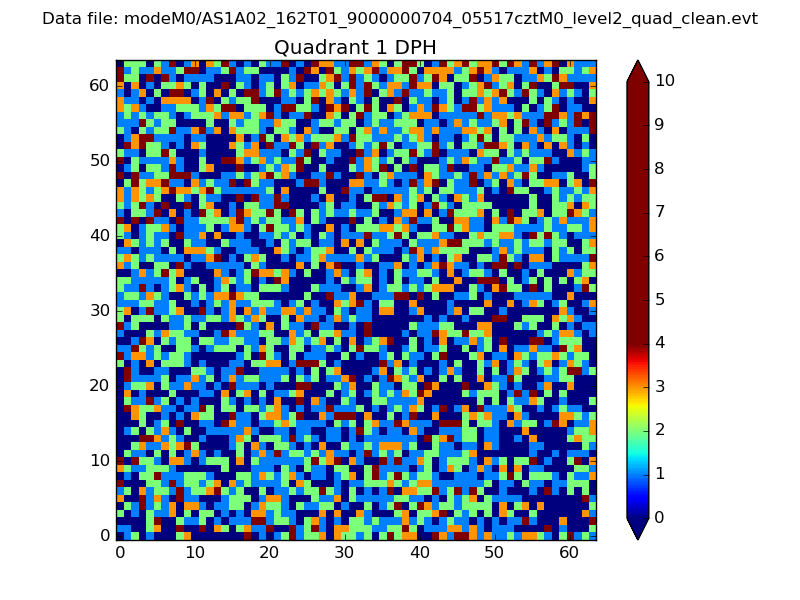 |
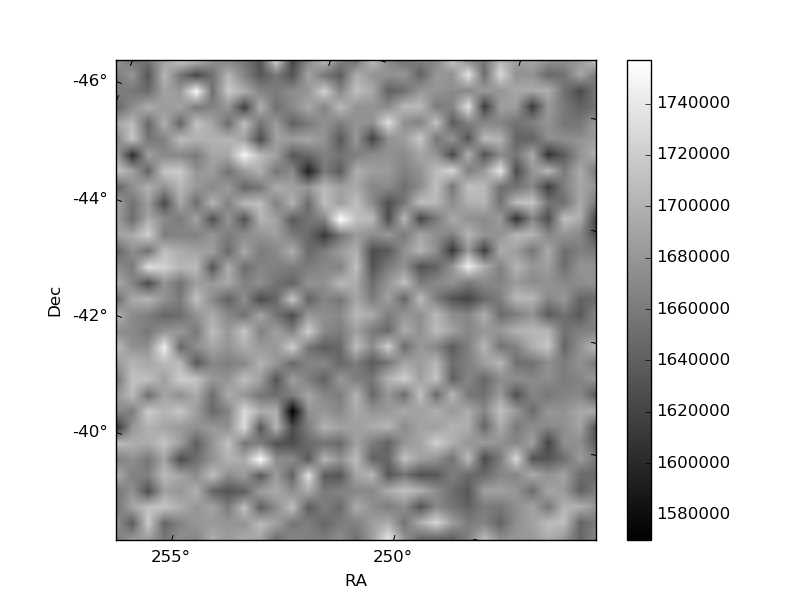
Quadrant B |
|---|---|---|---|
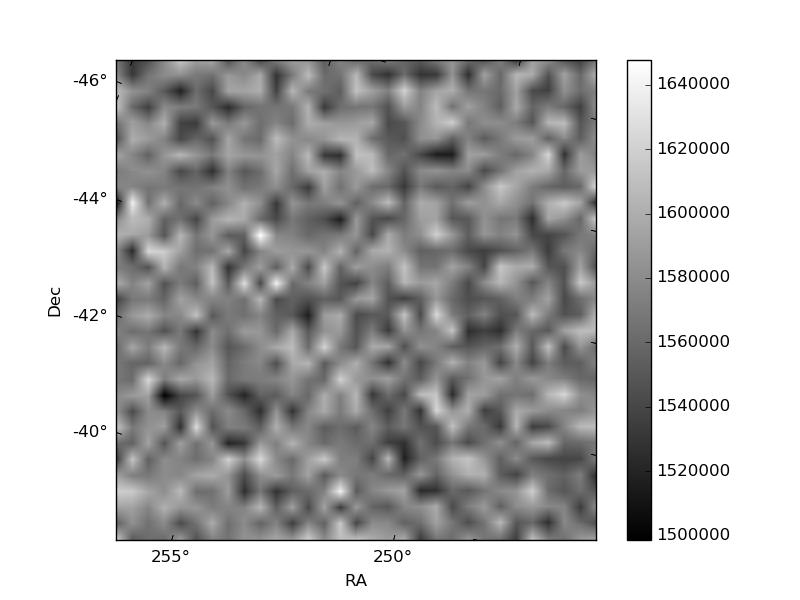
| Quadrant D | 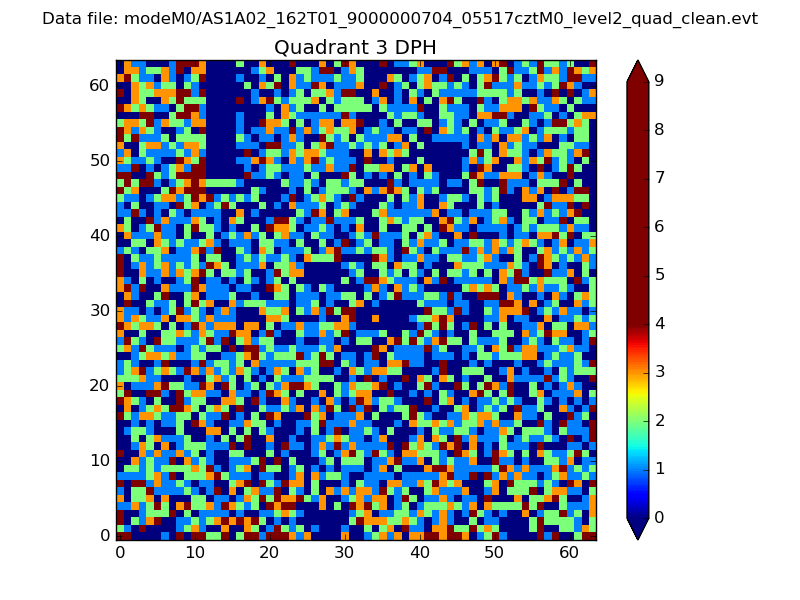 |
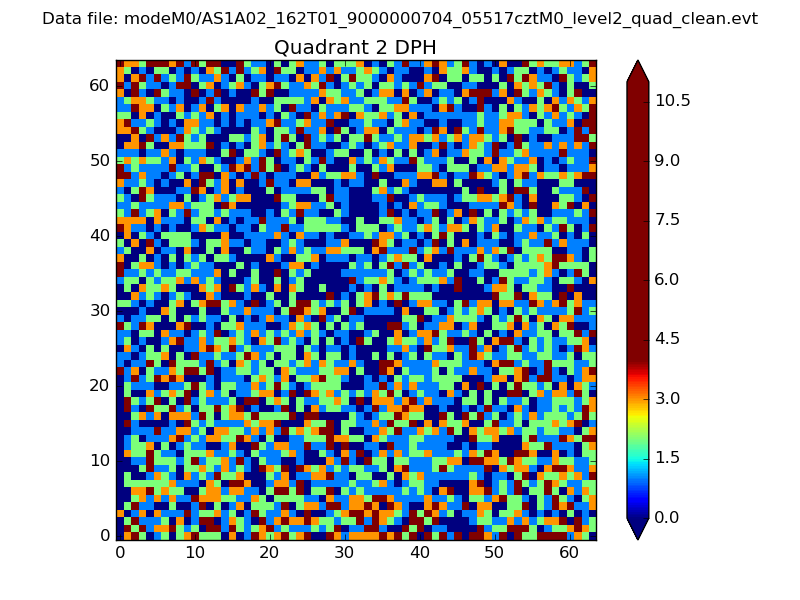 |
Quadrant C |
| Plot type | Count rate plots | Images |
|---|---|---|
| Comparison with Poisson distribution Blue bars denote a histogram of data divided into 1 sec bins. Red curve is a Poisson curve with rate = median count rate of data. |
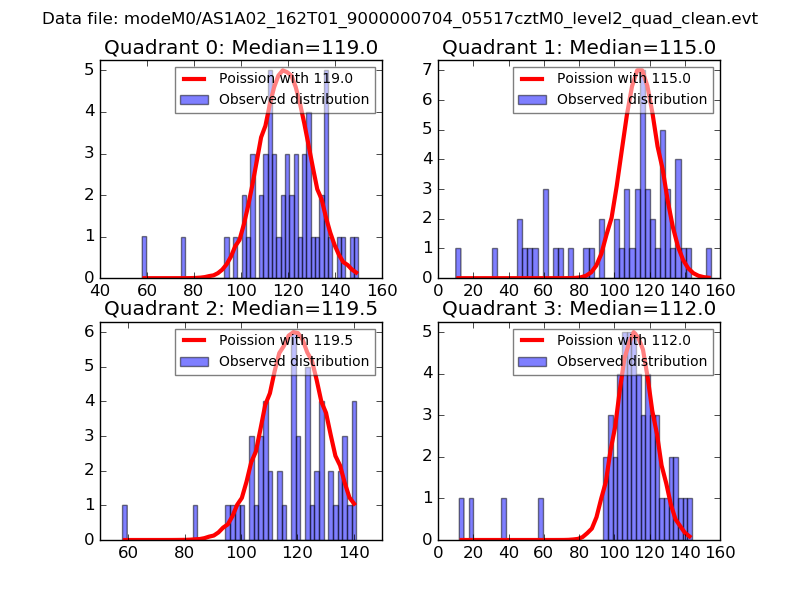 |
 |
| Quadrant-wise count rates Data is divided into 100 sec bins |
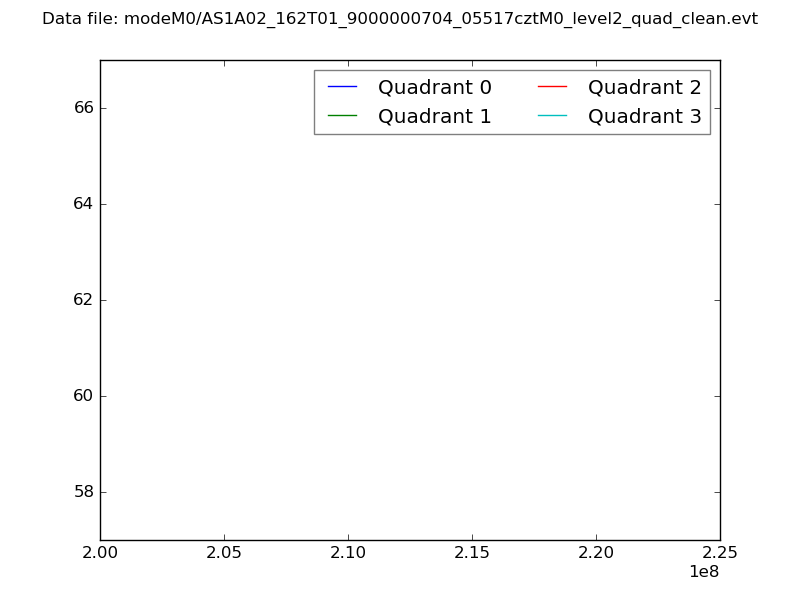 |
|
| Module-wise count rates for Quadrant A Data is divided into 100 sec bins |
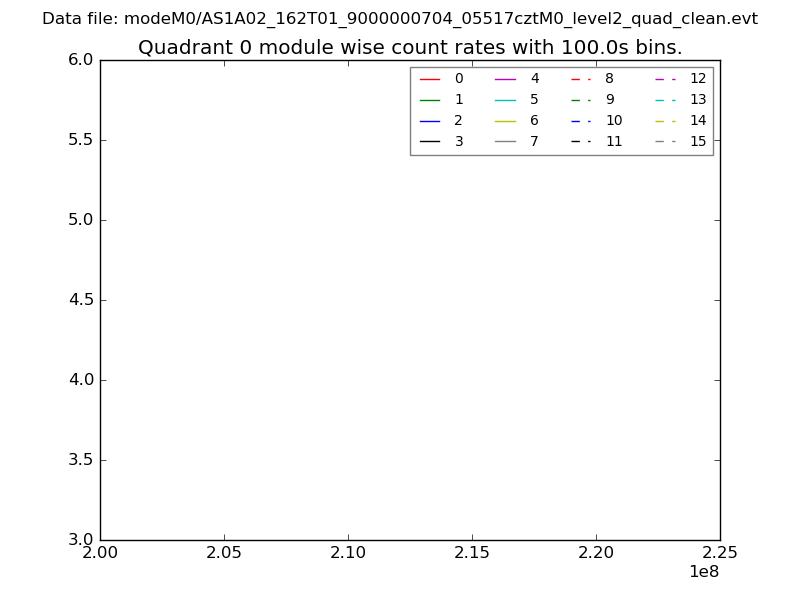 |
 |
| Module-wise count rates for Quadrant B Data is divided into 100 sec bins |
 |
 |
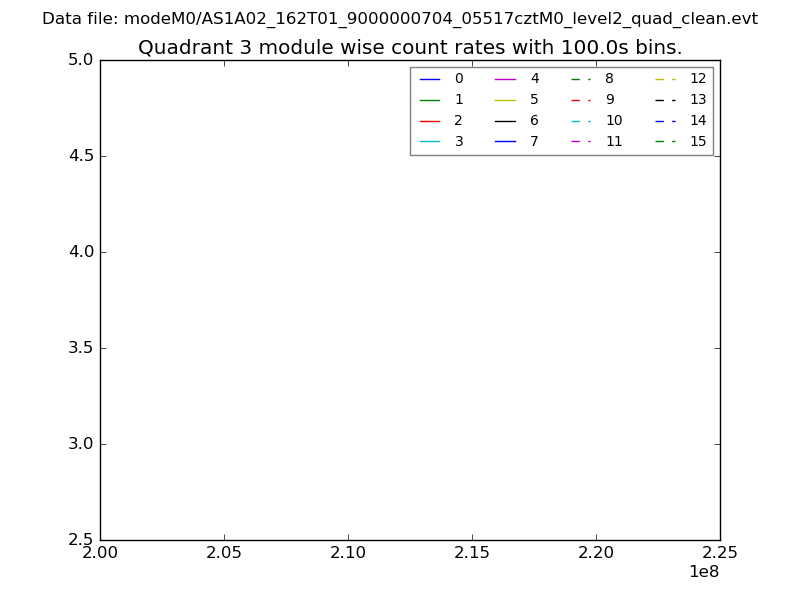
| Module-wise count rates for Quadrant C Data is divided into 100 sec bins |
 |
 |
| Module-wise count rates for Quadrant D Data is divided into 100 sec bins |
 |
 |
| Parameter | Plot |
|---|---|
| CZT HV Monitor | 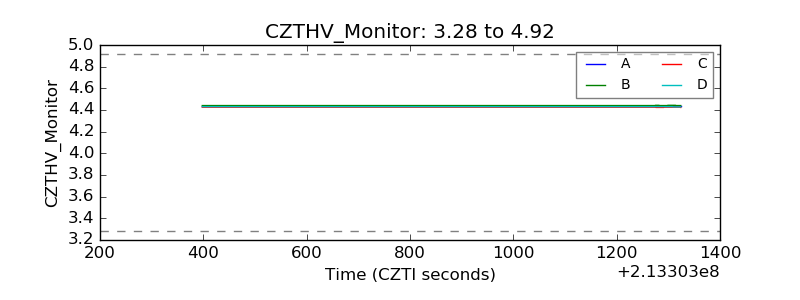 |
| D_VDD | 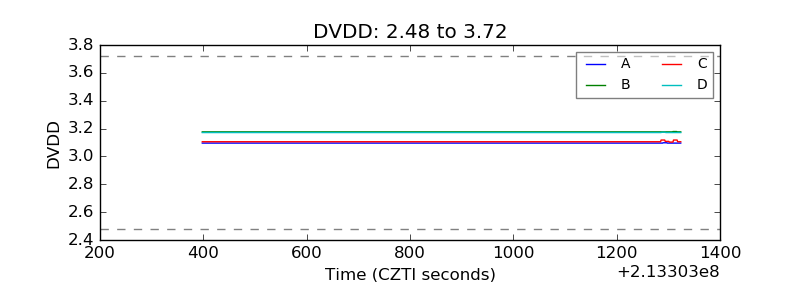 |
| Temperature 1 | 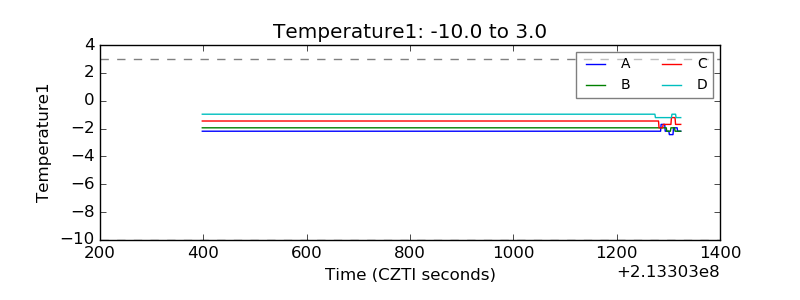 |
| Veto HV Monitor | 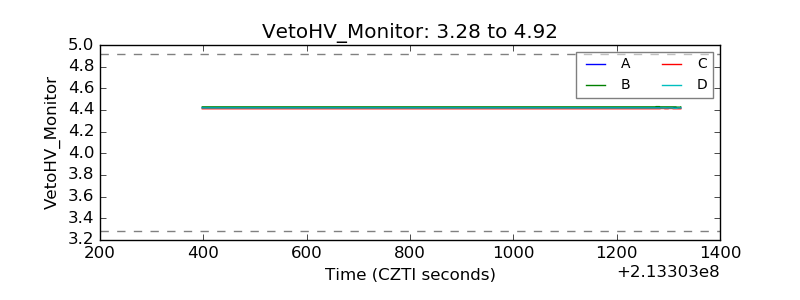 |
| Veto LLD | 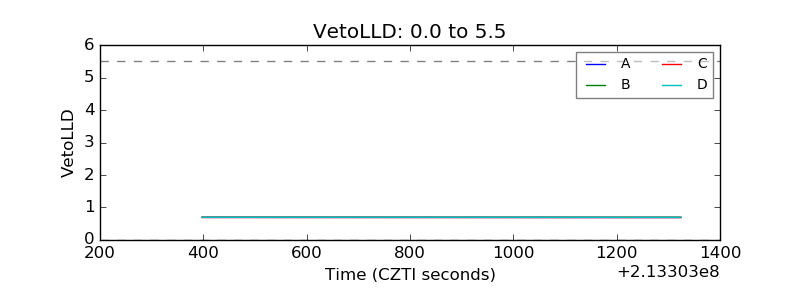 |
| Alpha Counter | 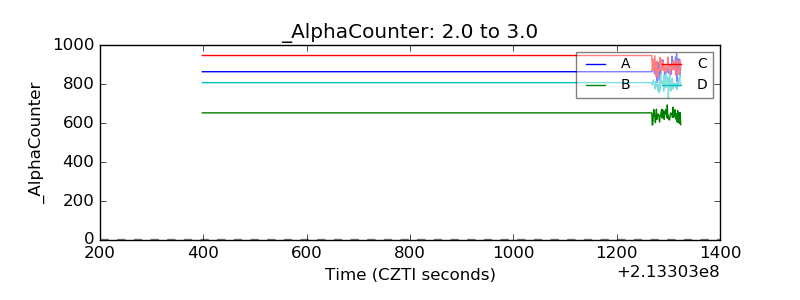 |
| _CPM_Rate | 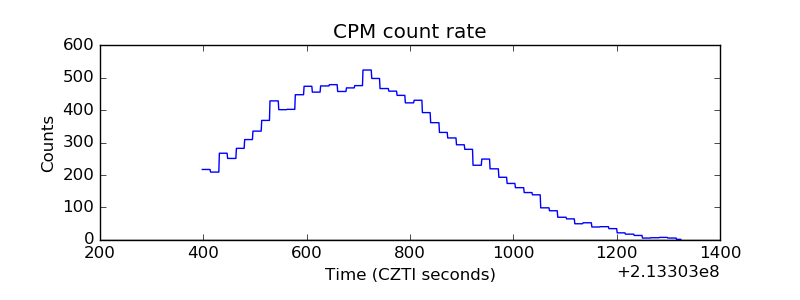 |
| CZT Counter | 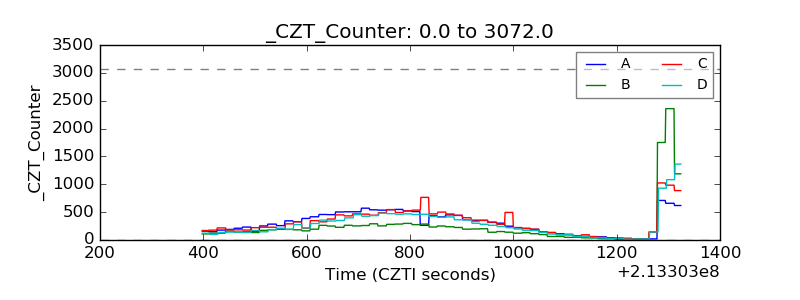 |
| +2.5 Volts monitor | 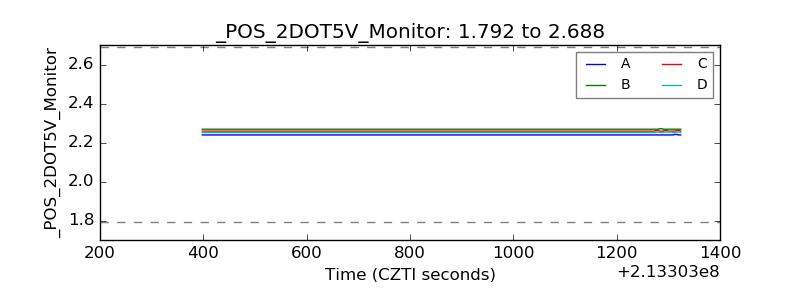 |
| +5 Volts monitor |  |
| _ROLL_ROT | 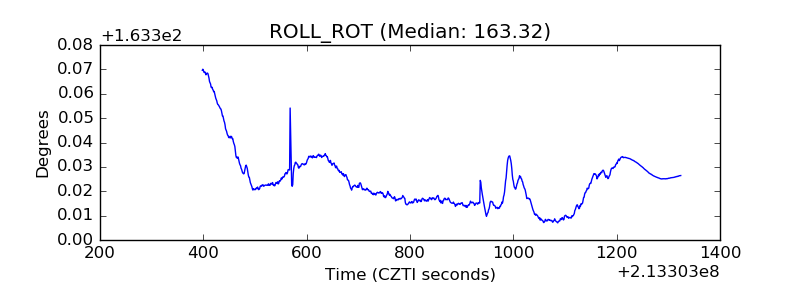 |
| _Roll_DEC | 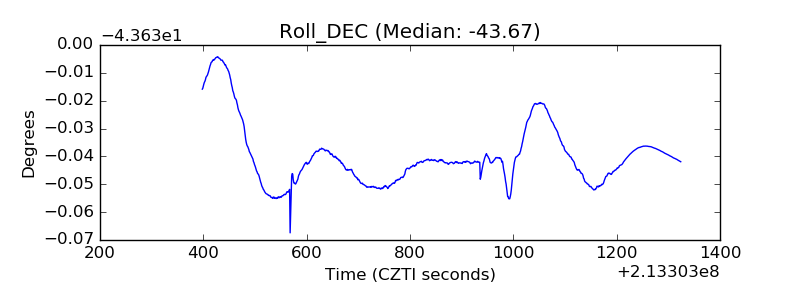 |
| _Roll_RA | 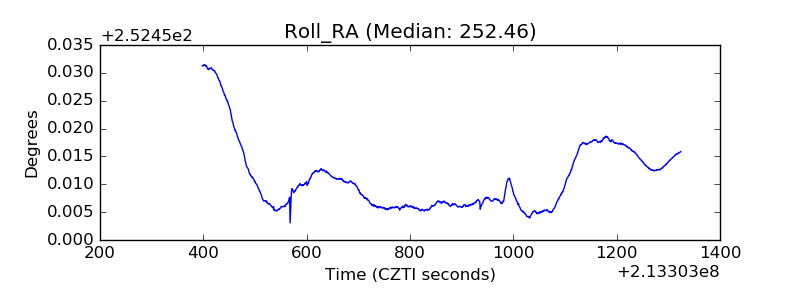 |
| Veto Counter | 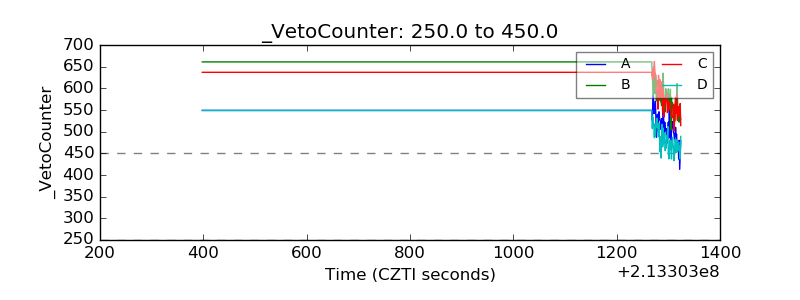 |