| Param | Original file | Final file |
|---|---|---|
| Filename | modeM0/AS1G06_168T23_9000000706cztM0_level2.fits | modeM0/AS1G06_168T23_9000000706cztM0_level2_quad_clean.evt |
| Size (bytes) | 245,577,600 | 254,502,720 |
| Size | 234.2 MB | 242.7 MB |
| Events in quadrant A | 1,478,914 | 1,577,193 |
| Events in quadrant B | 1,365,348 | 1,407,961 |
| Events in quadrant C | 1,428,690 | 1,450,094 |
| Events in quadrant D | 1,249,606 | 1,358,320 |
| Mode M0 | |||
|---|---|---|---|
| Quadrant | BADHDUFLAG | Total packets | Discarded packets |
| A | 0 | 58233 | 0 |
| B | 0 | 80449 | 0 |
| C | 0 | 66461 | 0 |
| D | 0 | 65743 | 0 |
| Mode M9 | |||
|---|---|---|---|
| Quadrant | BADHDUFLAG | Total packets | Discarded packets |
| A | 0 | 17 | 0 |
| B | 0 | 17 | 0 |
| C | 0 | 17 | 0 |
| D | 0 | 17 | 0 |
| Mode SS | |||
|---|---|---|---|
| Quadrant | BADHDUFLAG | Total packets | Discarded packets |
| A | 0 | 562 | 0 |
| B | 0 | 564 | 0 |
| C | 0 | 564 | 0 |
| D | 0 | 564 | 0 |
| Quadrant | Total seconds | Saturated seconds | Saturation percentage |
|---|---|---|---|
| A | 27839 | 423 | 1.519451% |
| B | 27817 | 2194 | 7.887263% |
| C | 27838 | 767 | 2.755227% |
| D | 27832 | 717 | 2.576171% |
Noise dominated data is calculated using 1-second bins in cleaned event files. If a bin has >2000 counts, and if more than 50% of those come from <1% of pixels, then it is considered to be noise-dominated and hence unusable.
| Quadrant | # 1 sec bins | Bins with >0 counts | Bins with >2000 counts | High rate bins dominated by noise | Noise dominated (total time) | Noise dominated (detector-on time) | Marked lightcurve |
|---|---|---|---|---|---|---|---|
| A | 29565 | 27852 | 0 | 0 | 0.00% | 0.00% | 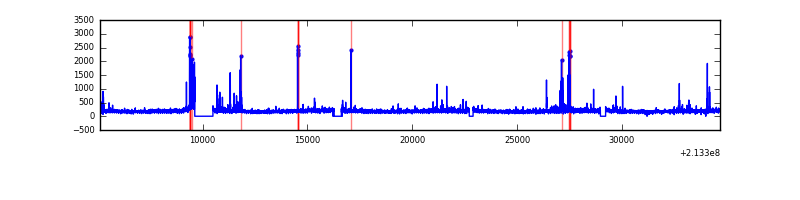 |
| B | 29565 | 27847 | 0 | 0 | 0.00% | 0.00% | 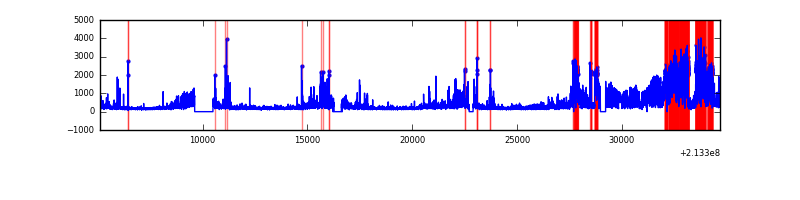 |
| C | 29565 | 27852 | 0 | 0 | 0.00% | 0.00% |  |
| D | 29565 | 27848 | 0 | 0 | 0.00% | 0.00% | 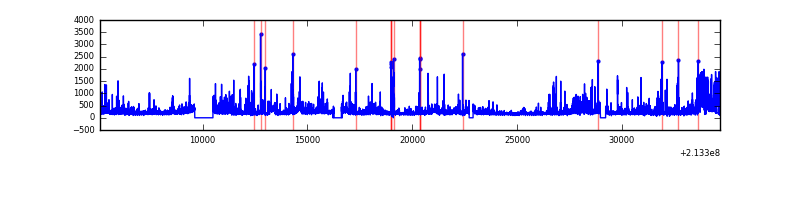 |
Top three noisy pixels from each quadrant. If the there are fewer than three noisy pixels in the level2.evt file, extra rows are filled as -1
| Pixel properties | Quadrant properties | ||||||
|---|---|---|---|---|---|---|---|
| Quadrant | DetID | PixID | Counts | Sigma | Mean | Median | Sigma |
| A | 0 | 29 | 1444 | 10.69 | 383 | 354 | 102.0 |
| A | 7 | 110 | 1294 | 9.22 | 383 | 354 | 102.0 |
| A | 0 | 30 | 1130 | 7.61 | 383 | 354 | 102.0 |
| B | 2 | 9 | 1243 | 11.82 | 360 | 340 | 76.4 |
| B | 12 | 226 | 991 | 8.52 | 360 | 340 | 76.4 |
| B | 14 | 254 | 958 | 8.09 | 360 | 340 | 76.4 |
| C | 2 | 191 | 1009 | 6.47 | 377 | 346 | 102.4 |
| C | 12 | 241 | 969 | 6.08 | 377 | 346 | 102.4 |
| C | 3 | 30 | 959 | 5.99 | 377 | 346 | 102.4 |
| D | 7 | 3 | 956 | 6.4 | 356 | 323 | 98.9 |
| D | 1 | 3 | 939 | 6.23 | 356 | 323 | 98.9 |
| D | 6 | 231 | 937 | 6.21 | 356 | 323 | 98.9 |
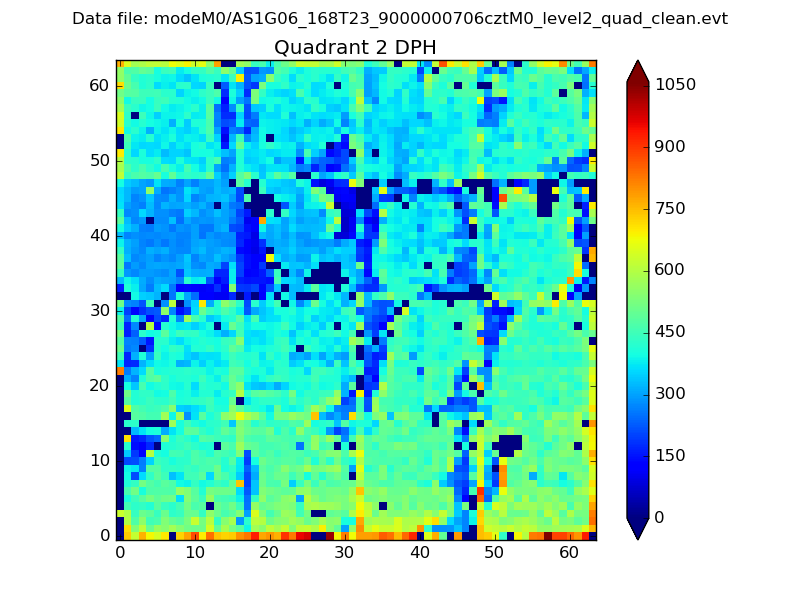
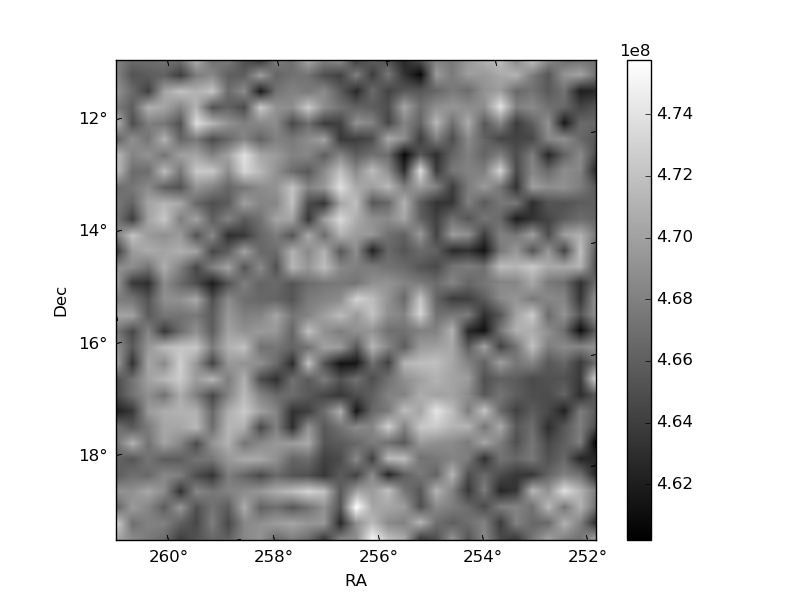
Histogram calculated using DETX and DETY for each event in the final _common_clean file
| Quadrant A | 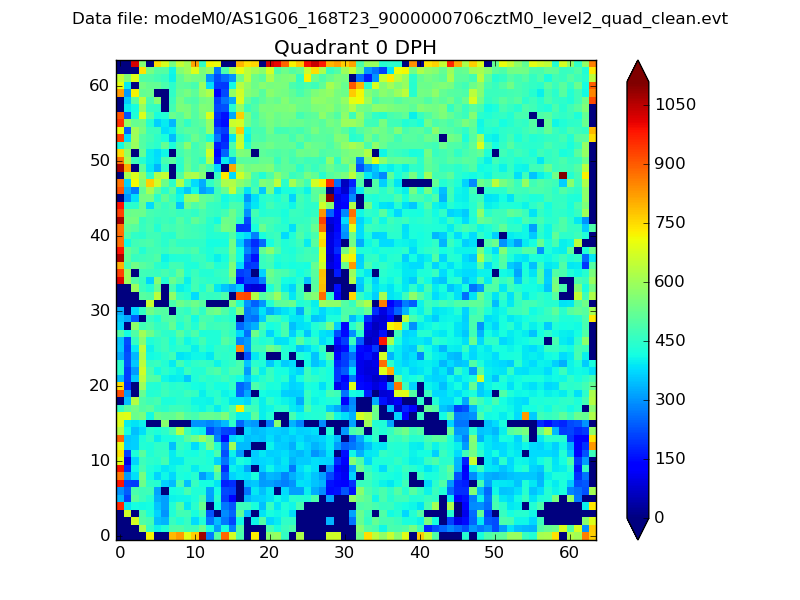 |
 |
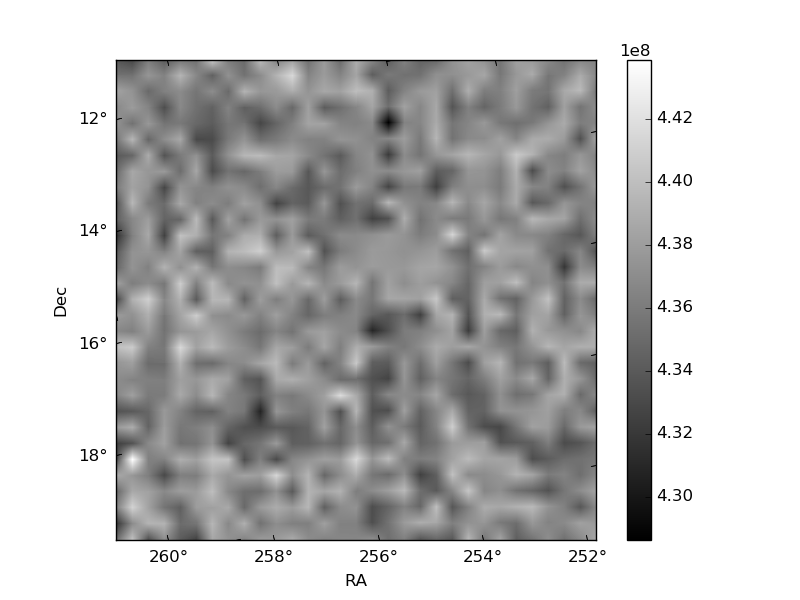
Quadrant B |
|---|---|---|---|
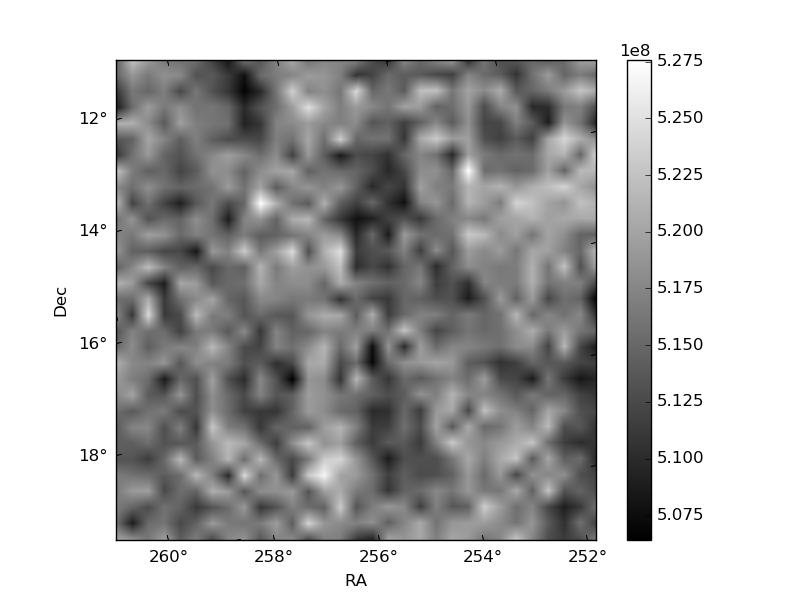
| Quadrant D | 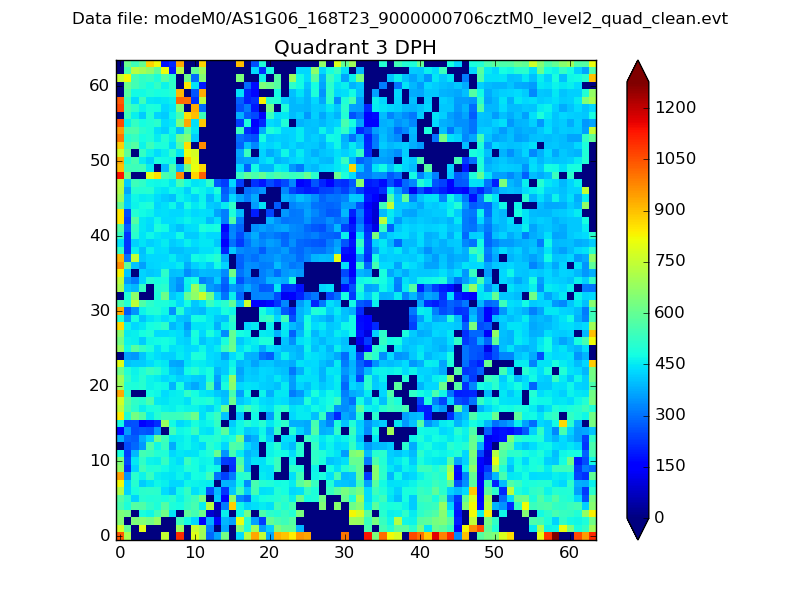 |
 |
Quadrant C |
| Plot type | Count rate plots | Images |
|---|---|---|
| Comparison with Poisson distribution Blue bars denote a histogram of data divided into 1 sec bins. Red curve is a Poisson curve with rate = median count rate of data. |
 |
 |
| Quadrant-wise count rates Data is divided into 100 sec bins |
 |
|
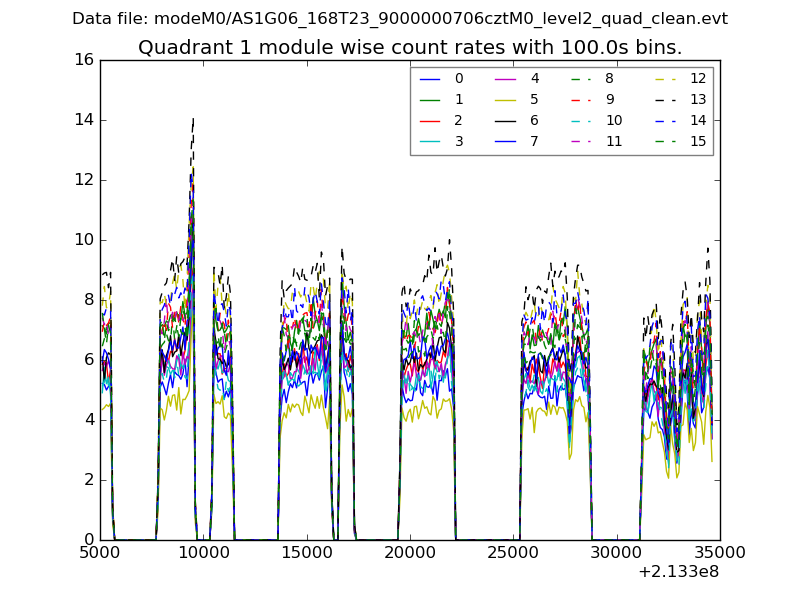
| Module-wise count rates for Quadrant A Data is divided into 100 sec bins |
 |
 |
| Module-wise count rates for Quadrant B Data is divided into 100 sec bins |
 |
 |
| Module-wise count rates for Quadrant C Data is divided into 100 sec bins |
 |
 |
| Module-wise count rates for Quadrant D Data is divided into 100 sec bins |
 |
 |
| Parameter | Plot |
|---|---|
| CZT HV Monitor | 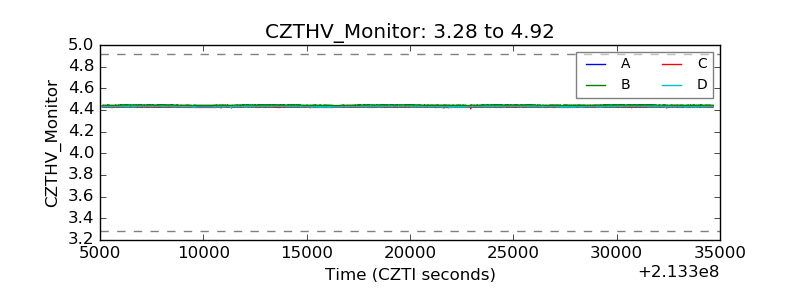 |
| D_VDD | 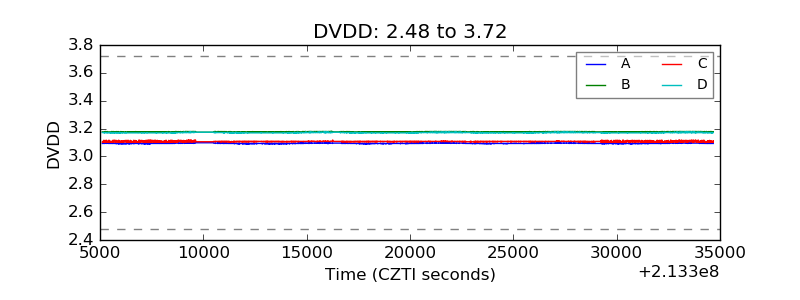 |
| Temperature 1 | 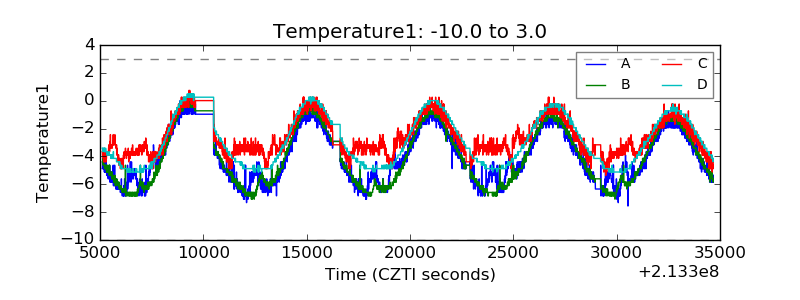 |
| Veto HV Monitor | 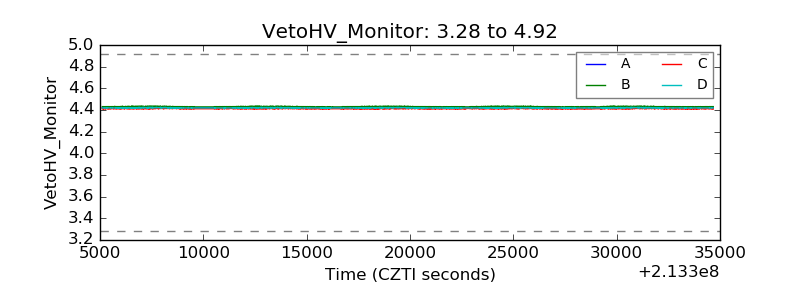 |
| Veto LLD | 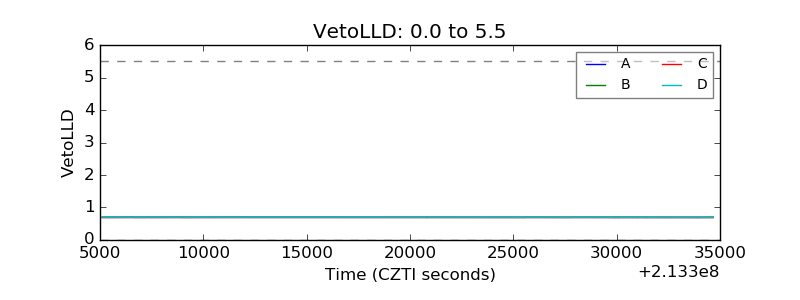 |
| Alpha Counter | 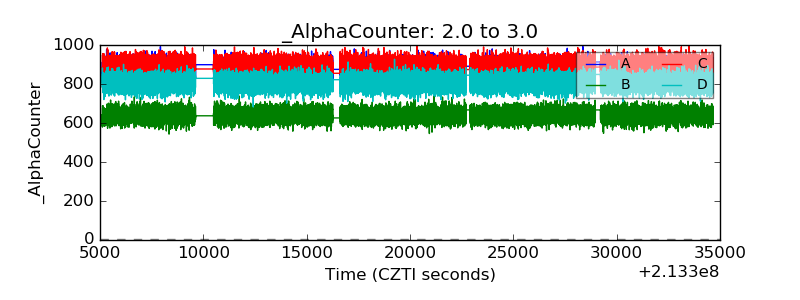 |
| _CPM_Rate |  |
| CZT Counter | 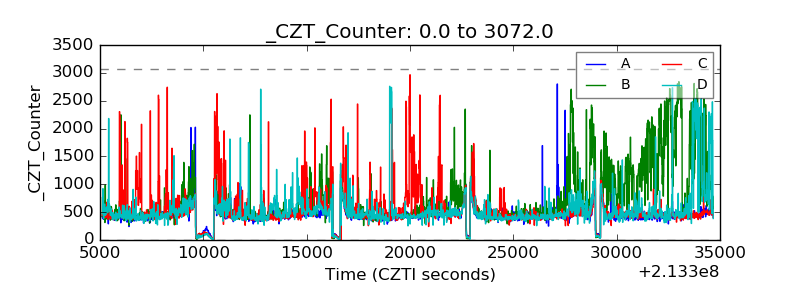 |
| +2.5 Volts monitor |  |
| +5 Volts monitor |  |
| _ROLL_ROT | 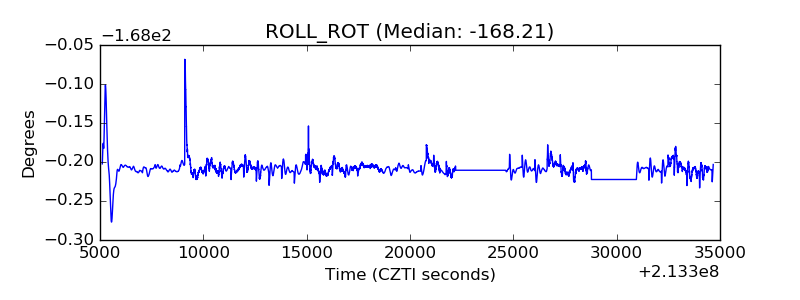 |
| _Roll_DEC |  |
| _Roll_RA | 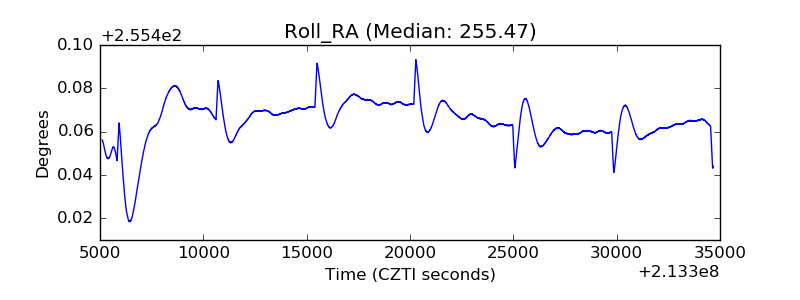 |
| Veto Counter | 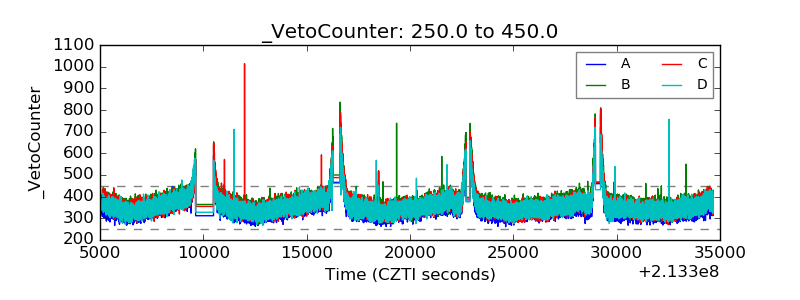 |