| Param | Original file | Final file |
|---|---|---|
| Filename | modeM0/AS1G06_168T23_9000000706_05516cztM0_level2.evt | modeM0/AS1G06_168T23_9000000706_05516cztM0_level2_quad_clean.evt |
| Size (bytes) | 26,579,520 | 6,419,520 |
| Size | 25.3 MB | 6.1 MB |
| Events in quadrant A | 183,620 | 41,009 |
| Events in quadrant B | 212,818 | 39,900 |
| Events in quadrant C | 168,602 | 39,378 |
| Events in quadrant D | 210,334 | 38,705 |
| Mode M0 | |||
|---|---|---|---|
| Quadrant | BADHDUFLAG | Total packets | Discarded packets |
| A | 0 | 827 | 1 |
| B | 0 | 879 | 0 |
| C | 0 | 776 | 0 |
| D | 0 | 876 | 0 |
| Mode SS | |||
|---|---|---|---|
| Quadrant | BADHDUFLAG | Total packets | Discarded packets |
| A | 0 | 6 | 0 |
| B | 0 | 6 | 0 |
| C | 0 | 6 | 0 |
| D | 0 | 6 | 0 |
| Quadrant | Total seconds | Saturated seconds | Saturation percentage |
|---|---|---|---|
| A | 387 | 7 | 1.808786% |
| B | 387 | 0 | 0.000000% |
| C | 387 | 0 | 0.000000% |
| D | 387 | 2 | 0.516796% |
Noise dominated data is calculated using 1-second bins in cleaned event files. If a bin has >2000 counts, and if more than 50% of those come from <1% of pixels, then it is considered to be noise-dominated and hence unusable.
| Quadrant | # 1 sec bins | Bins with >0 counts | Bins with >2000 counts | High rate bins dominated by noise | Noise dominated (total time) | Noise dominated (detector-on time) | Marked lightcurve |
|---|---|---|---|---|---|---|---|
| A | 387 | 387 | 5 | 5 | 1.29% | 1.29% | 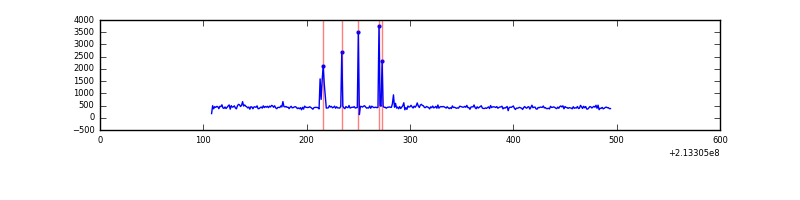 |
| B | 387 | 387 | 0 | 0 | 0.00% | 0.00% | 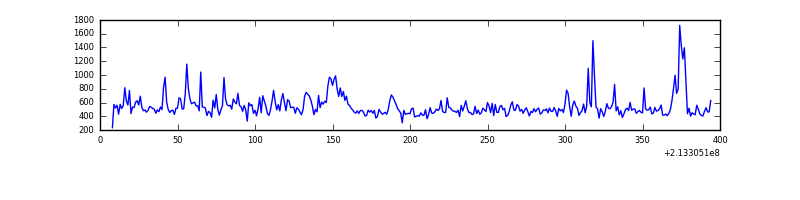 |
| C | 387 | 387 | 0 | 0 | 0.00% | 0.00% | 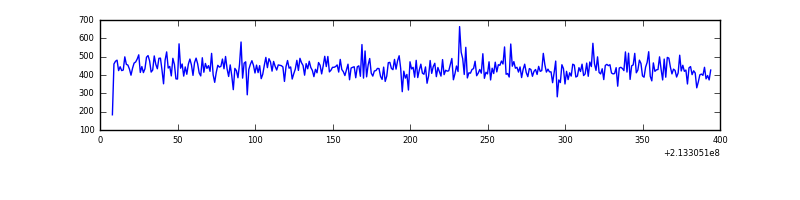 |
| D | 387 | 387 | 1 | 1 | 0.26% | 0.26% | 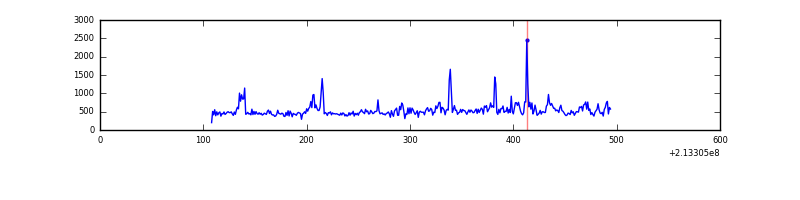 |
Top three noisy pixels from each quadrant. If the there are fewer than three noisy pixels in the level2.evt file, extra rows are filled as -1
| Pixel properties | Quadrant properties | ||||||
|---|---|---|---|---|---|---|---|
| Quadrant | DetID | PixID | Counts | Sigma | Mean | Median | Sigma |
| A | 0 | 50 | 21167 | 1969.99 | 42 | 41 | 10.7 |
| A | 0 | 226 | 450 | 38.14 | 42 | 41 | 10.7 |
| A | 12 | 194 | 413 | 34.69 | 42 | 41 | 10.7 |
| B | 11 | 51 | 22044 | 2072.05 | 43 | 42 | 10.6 |
| B | 0 | 219 | 7567 | 708.67 | 43 | 42 | 10.6 |
| B | 4 | 81 | 7214 | 675.43 | 43 | 42 | 10.6 |
| C | 1 | 16 | 2406 | 197.1 | 41 | 41 | 12.0 |
| C | 9 | 247 | 993 | 79.34 | 41 | 41 | 12.0 |
| C | 8 | 128 | 892 | 70.92 | 41 | 41 | 12.0 |
| D | 2 | 152 | 20669 | 1674.67 | 41 | 39 | 12.3 |
| D | 8 | 195 | 15240 | 1233.96 | 41 | 39 | 12.3 |
| D | 13 | 172 | 6949 | 560.93 | 41 | 39 | 12.3 |
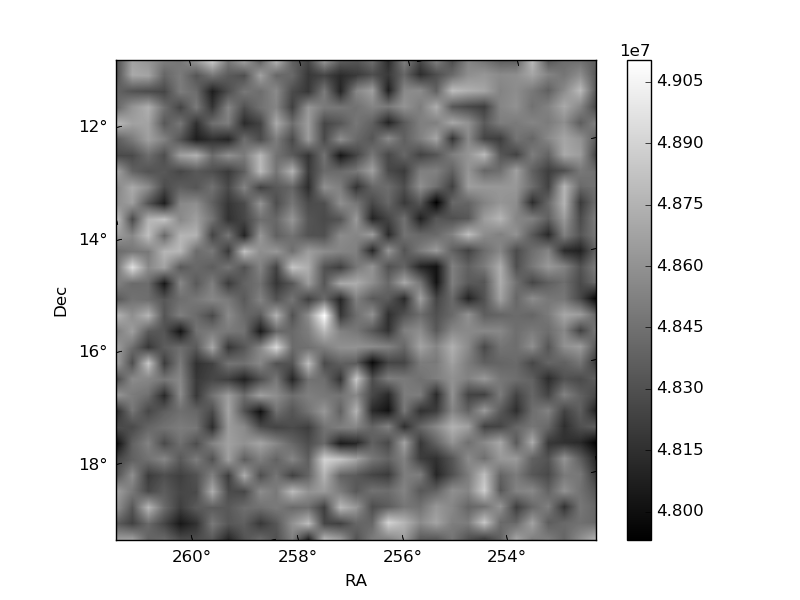
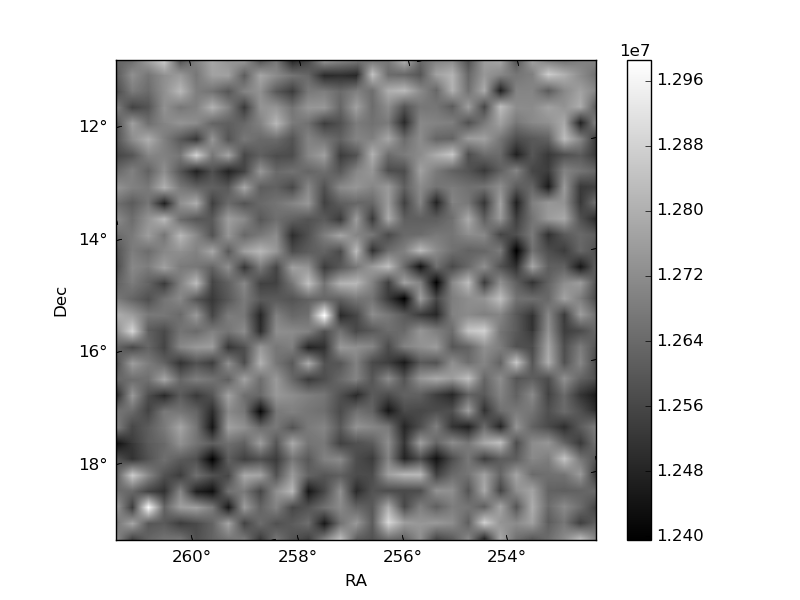
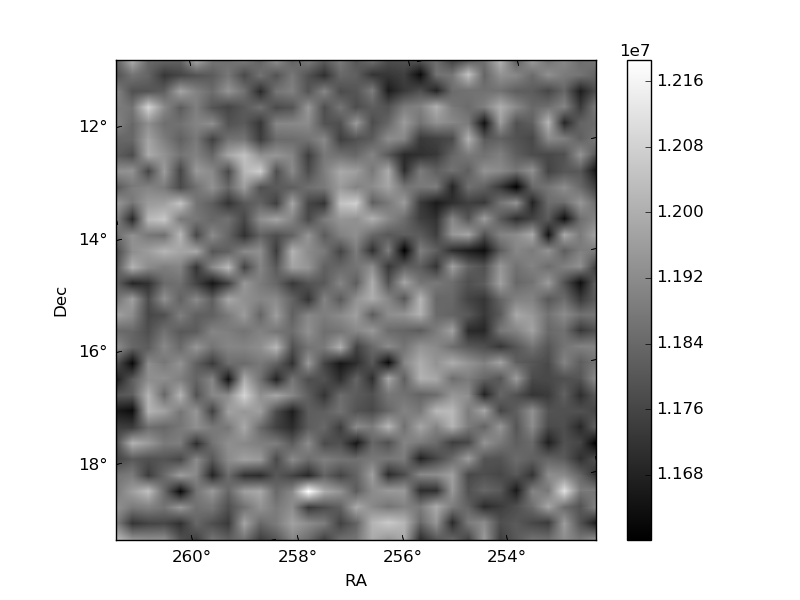
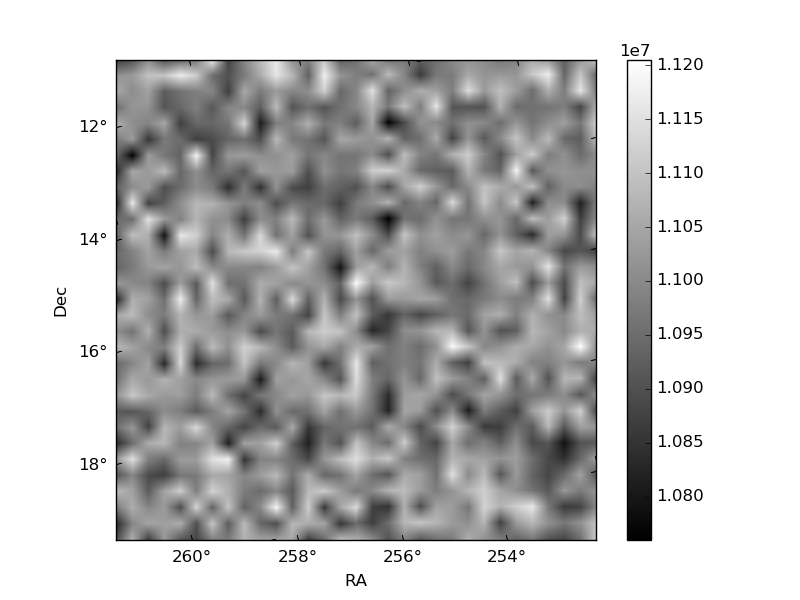
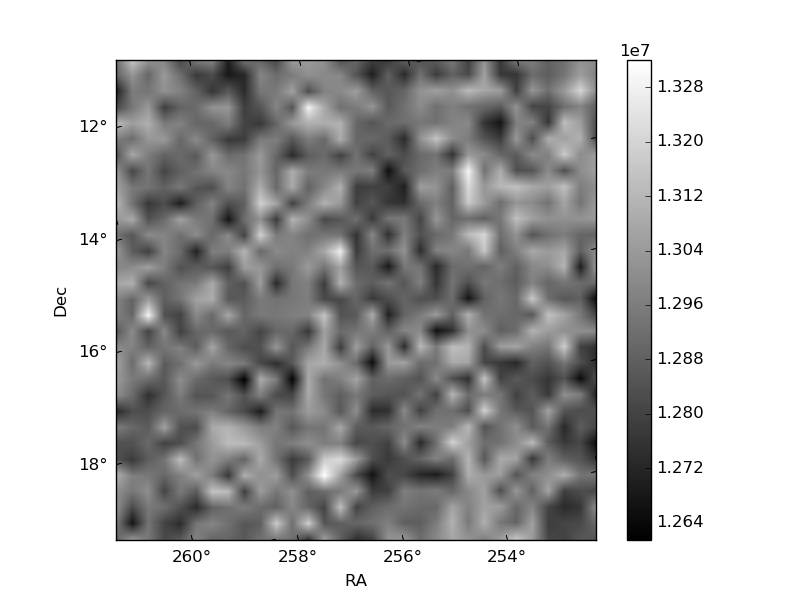
Histogram calculated using DETX and DETY for each event in the final _common_clean file
| Quadrant A | 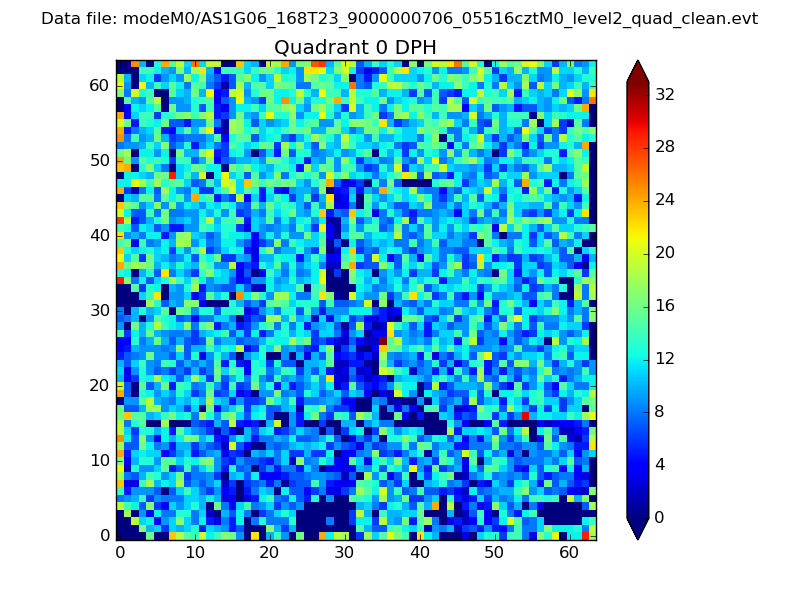 |
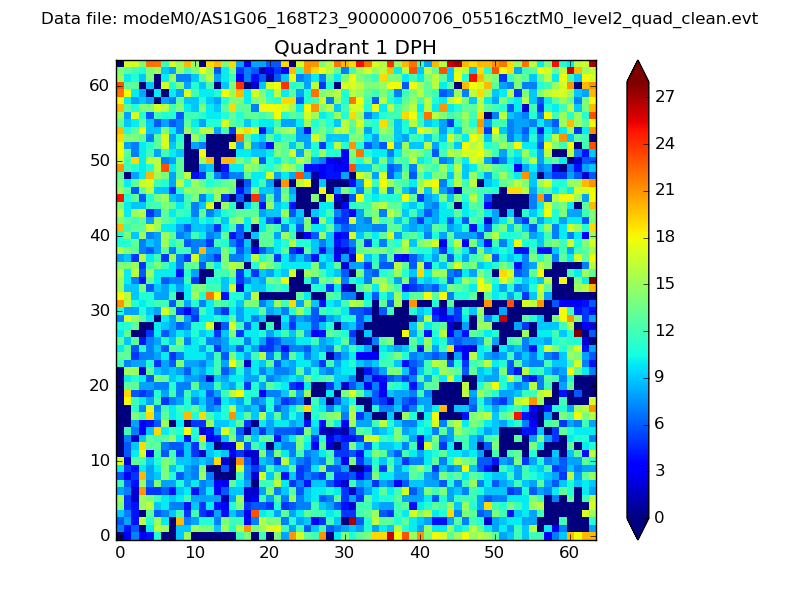 |
Quadrant B |
|---|---|---|---|
| Quadrant D | 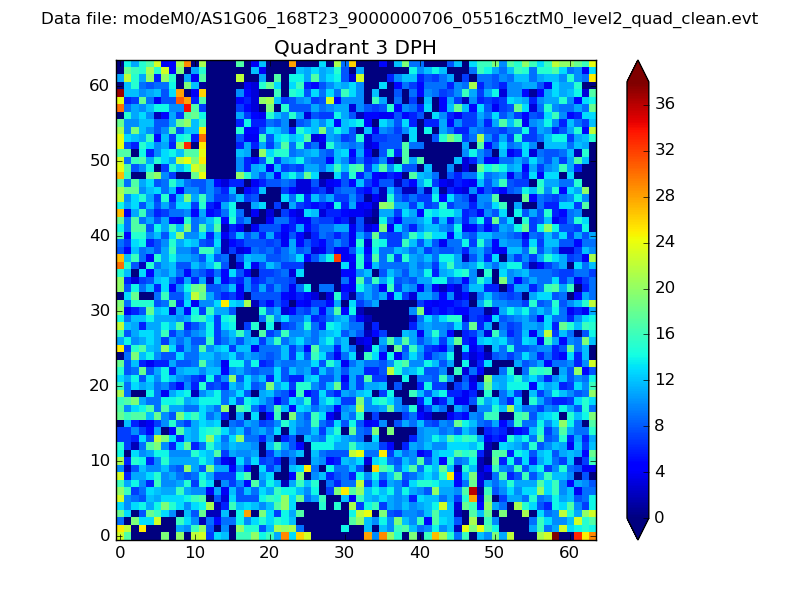 |
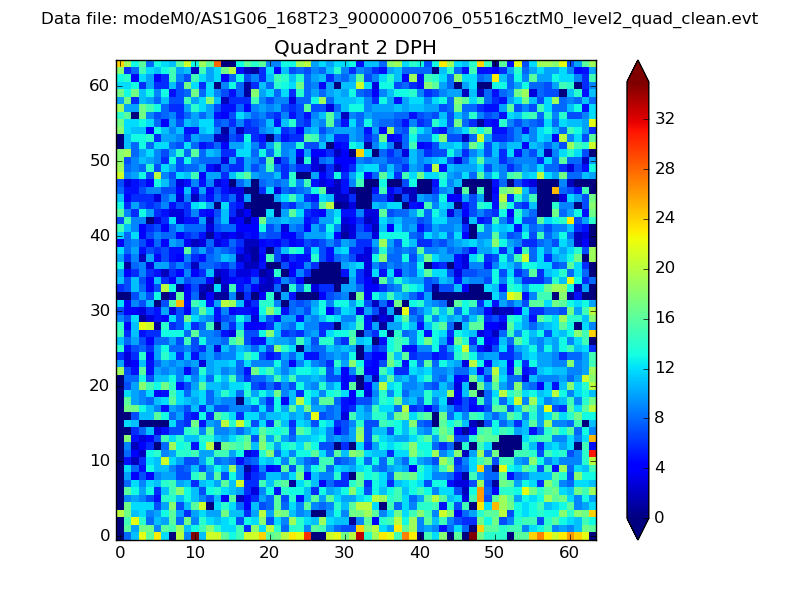 |
Quadrant C |
| Plot type | Count rate plots | Images |
|---|---|---|
| Comparison with Poisson distribution Blue bars denote a histogram of data divided into 1 sec bins. Red curve is a Poisson curve with rate = median count rate of data. |
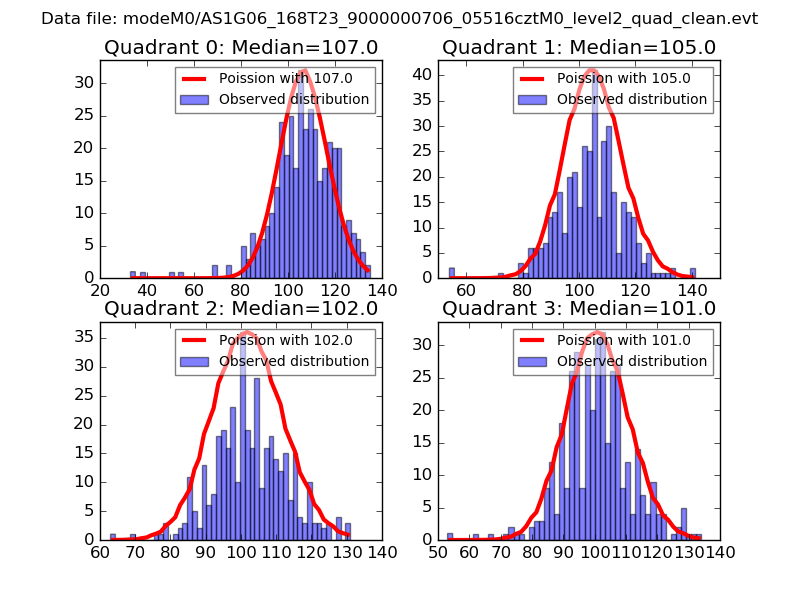 |
 |
| Quadrant-wise count rates Data is divided into 100 sec bins |
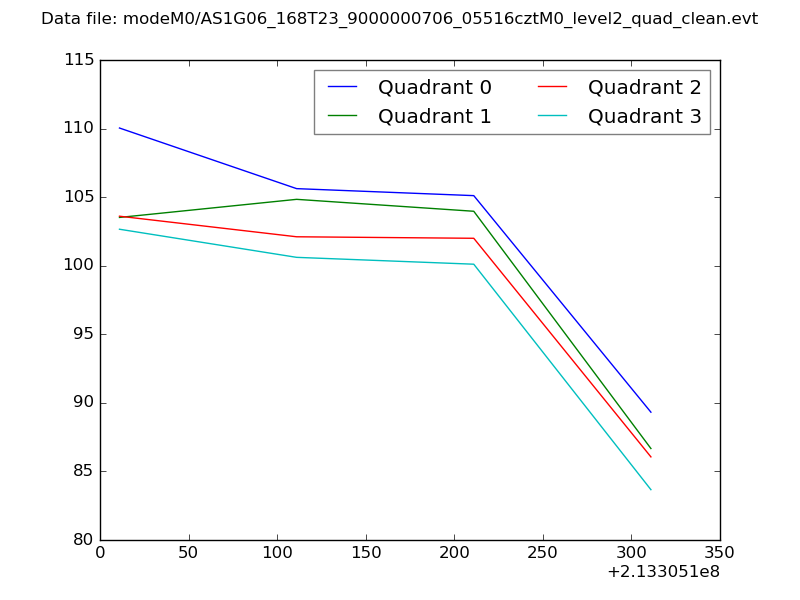 |
|
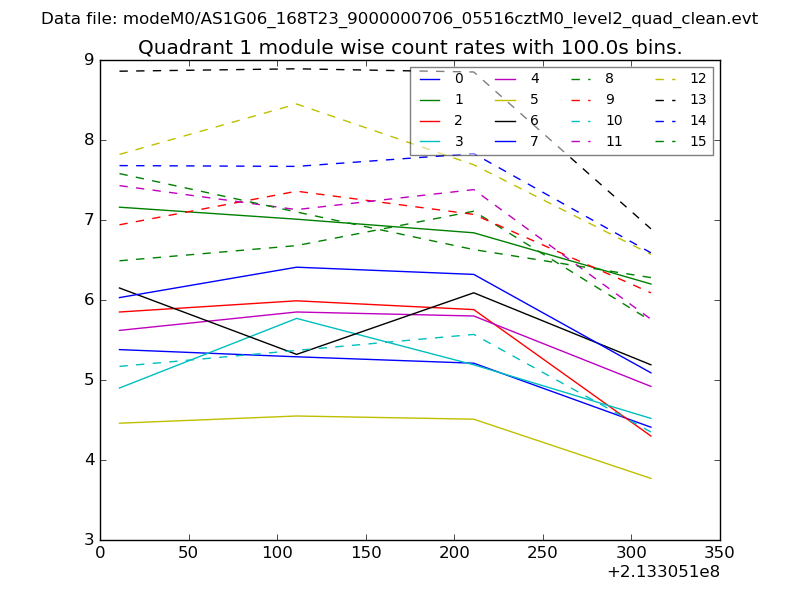
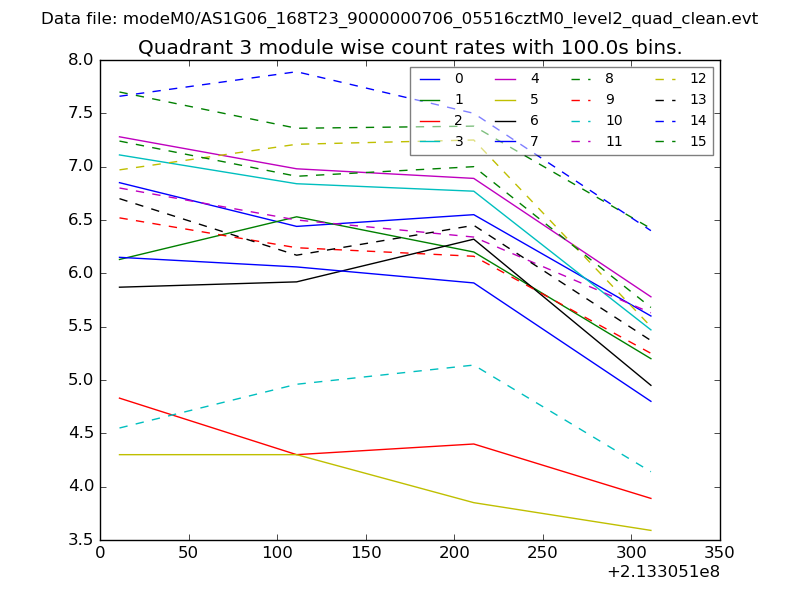
| Module-wise count rates for Quadrant A Data is divided into 100 sec bins |
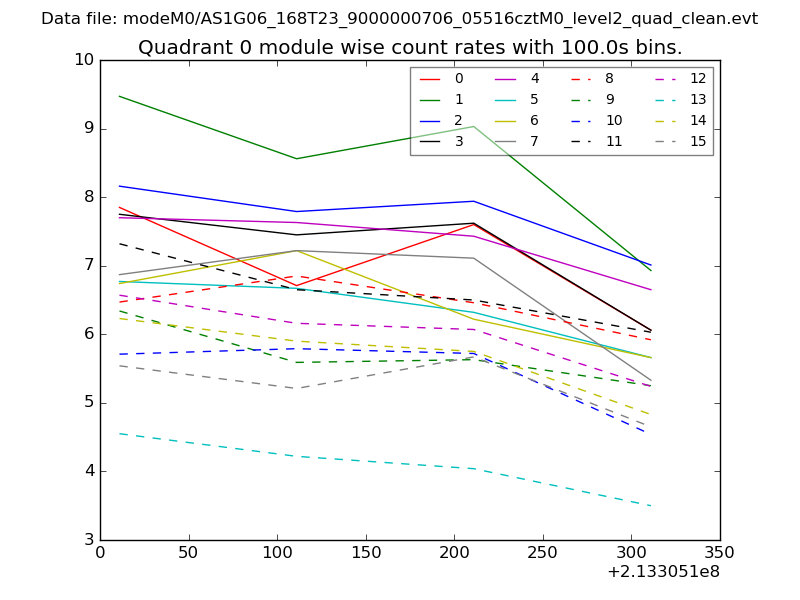 |
 |
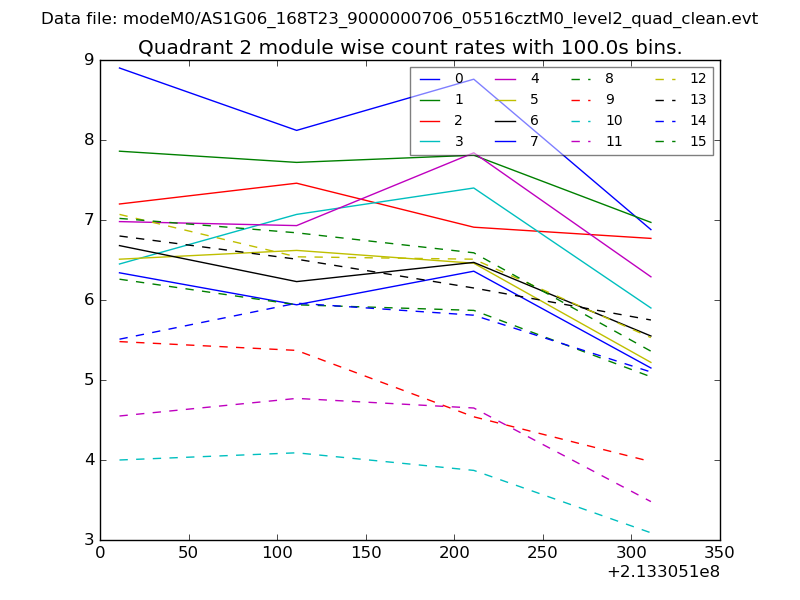
| Module-wise count rates for Quadrant B Data is divided into 100 sec bins |
 |
 |
| Module-wise count rates for Quadrant C Data is divided into 100 sec bins |
 |
 |
| Module-wise count rates for Quadrant D Data is divided into 100 sec bins |
 |
 |
| Parameter | Plot |
|---|---|
| CZT HV Monitor | 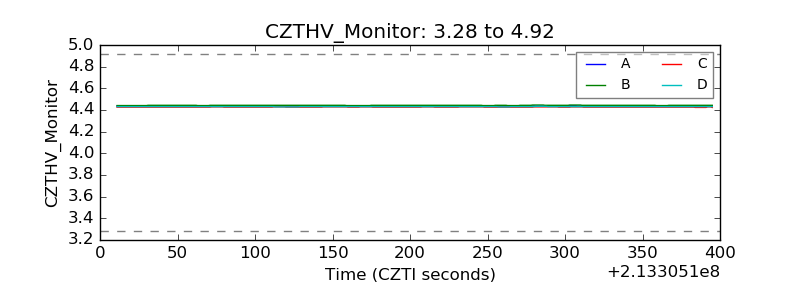 |
| D_VDD | 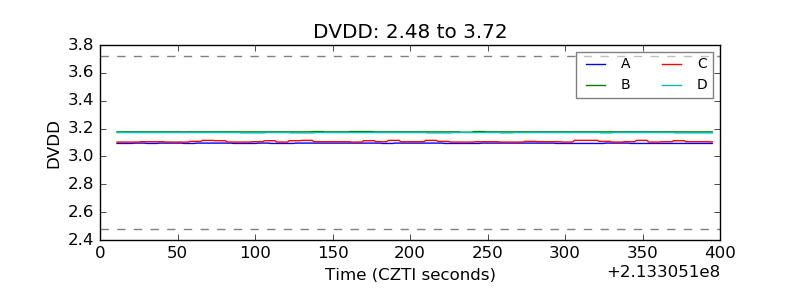 |
| Temperature 1 |  |
| Veto HV Monitor | 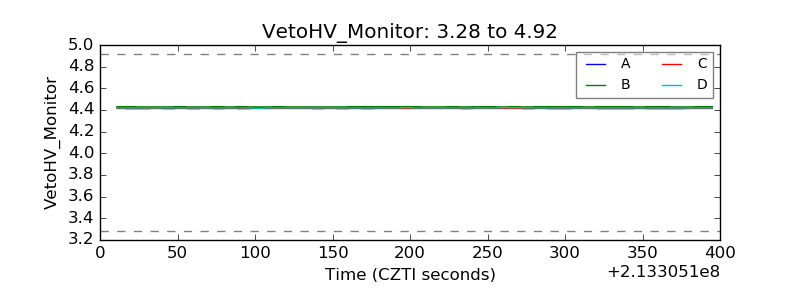 |
| Veto LLD |  |
| Alpha Counter | 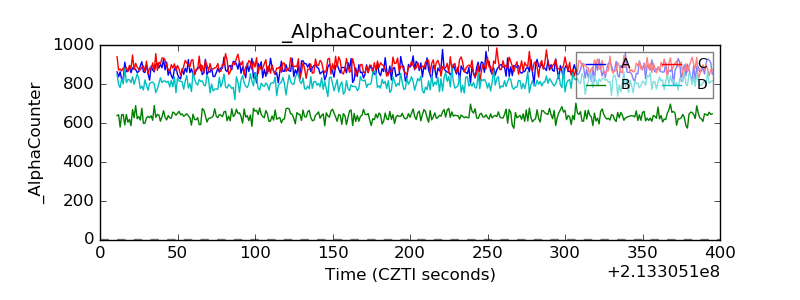 |
| _CPM_Rate | 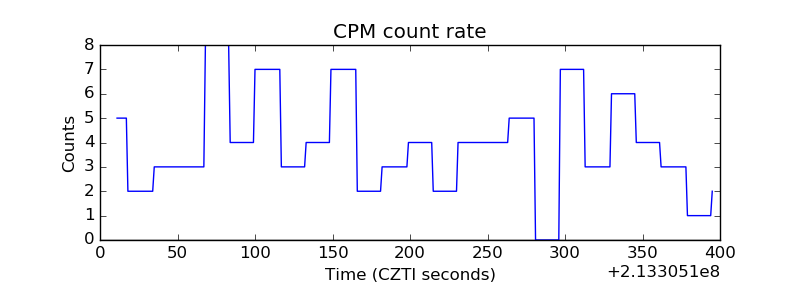 |
| CZT Counter | 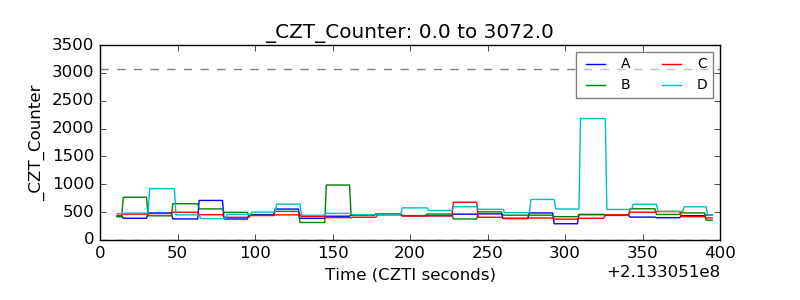 |
| +2.5 Volts monitor |  |
| +5 Volts monitor |  |
| _ROLL_ROT | 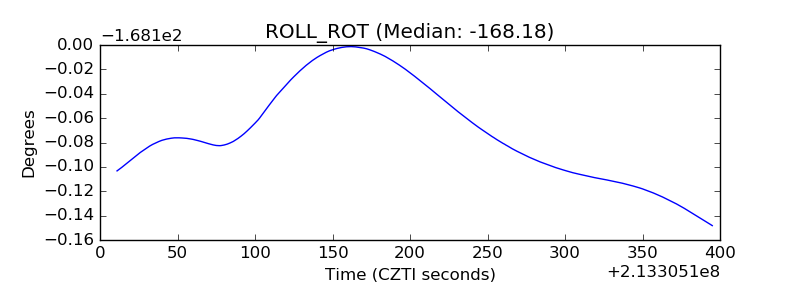 |
| _Roll_DEC | 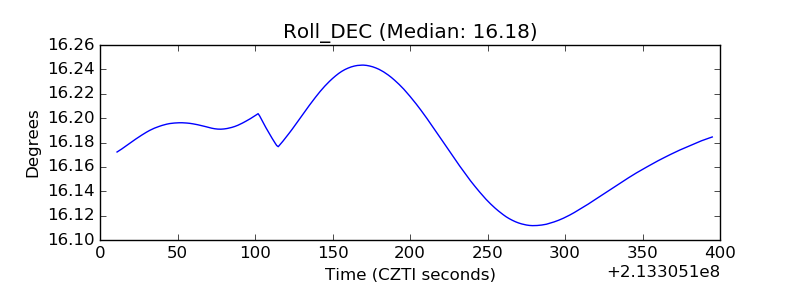 |
| _Roll_RA | 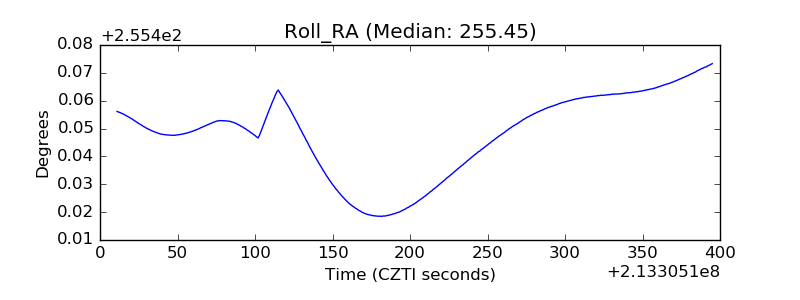 |
| Veto Counter | 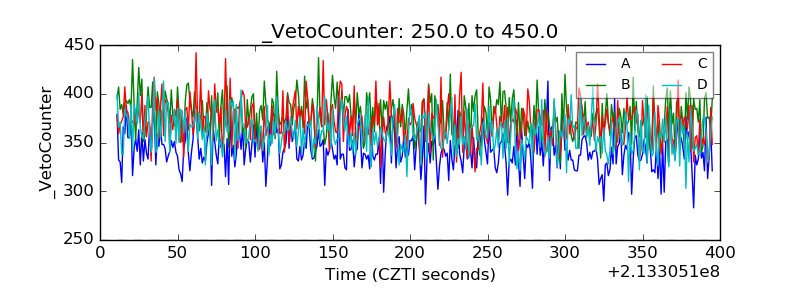 |