| Param | Original file | Final file |
|---|---|---|
| Filename | modeM0/AS1G06_168T23_9000000706_05517cztM0_level2.evt | modeM0/AS1G06_168T23_9000000706_05517cztM0_level2_quad_clean.evt |
| Size (bytes) | 443,373,120 | 60,382,080 |
| Size | 422.8 MB | 57.6 MB |
| Events in quadrant A | 2,845,490 | 366,008 |
| Events in quadrant B | 3,257,928 | 355,635 |
| Events in quadrant C | 3,892,007 | 342,334 |
| Events in quadrant D | 3,026,532 | 347,147 |
| Mode M0 | |||
|---|---|---|---|
| Quadrant | BADHDUFLAG | Total packets | Discarded packets |
| A | 0 | 12729 | 2 |
| B | 0 | 13794 | 1 |
| C | 0 | 15621 | 1 |
| D | 0 | 13206 | 1 |
| Mode M9 | |||
|---|---|---|---|
| Quadrant | BADHDUFLAG | Total packets | Discarded packets |
| A | 0 | 8 | 0 |
| B | 0 | 8 | 0 |
| C | 0 | 8 | 0 |
| D | 0 | 8 | 0 |
| Mode SS | |||
|---|---|---|---|
| Quadrant | BADHDUFLAG | Total packets | Discarded packets |
| A | 0 | 122 | 0 |
| B | 0 | 122 | 0 |
| C | 0 | 122 | 0 |
| D | 0 | 122 | 0 |
| Quadrant | Total seconds | Saturated seconds | Saturation percentage |
|---|---|---|---|
| A | 5968 | 65 | 1.089142% |
| B | 5968 | 80 | 1.340483% |
| C | 5968 | 219 | 3.669571% |
| D | 5968 | 16 | 0.268097% |
Noise dominated data is calculated using 1-second bins in cleaned event files. If a bin has >2000 counts, and if more than 50% of those come from <1% of pixels, then it is considered to be noise-dominated and hence unusable.
| Quadrant | # 1 sec bins | Bins with >0 counts | Bins with >2000 counts | High rate bins dominated by noise | Noise dominated (total time) | Noise dominated (detector-on time) | Marked lightcurve |
|---|---|---|---|---|---|---|---|
| A | 6838 | 5968 | 31 | 31 | 0.45% | 0.52% | 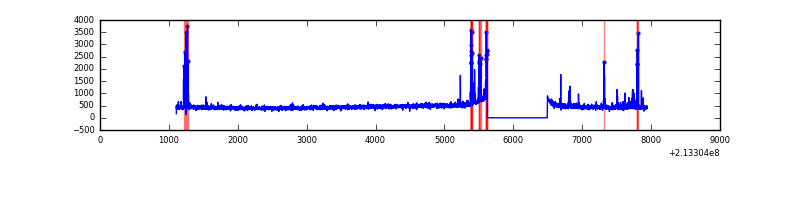 |
| B | 6838 | 5969 | 35 | 35 | 0.51% | 0.59% | 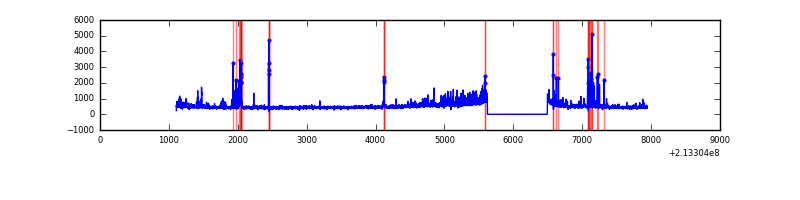 |
| C | 6838 | 5969 | 142 | 142 | 2.08% | 2.38% | 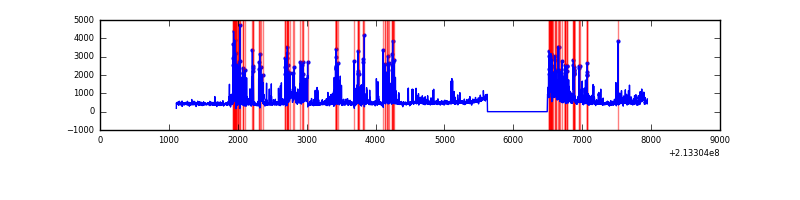 |
| D | 6838 | 5969 | 6 | 6 | 0.09% | 0.10% | 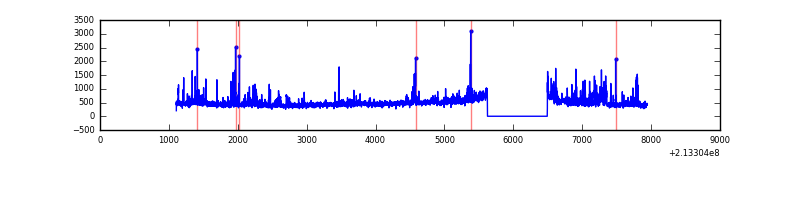 |
Top three noisy pixels from each quadrant. If the there are fewer than three noisy pixels in the level2.evt file, extra rows are filled as -1
| Pixel properties | Quadrant properties | ||||||
|---|---|---|---|---|---|---|---|
| Quadrant | DetID | PixID | Counts | Sigma | Mean | Median | Sigma |
| A | 0 | 50 | 95880 | 679.37 | 684 | 670 | 140.1 |
| A | 15 | 174 | 83994 | 594.56 | 684 | 670 | 140.1 |
| A | 7 | 16 | 20180 | 139.21 | 684 | 670 | 140.1 |
| B | 15 | 204 | 191071 | 1412.29 | 691 | 674 | 134.8 |
| B | 4 | 81 | 110053 | 811.33 | 691 | 674 | 134.8 |
| B | 10 | 16 | 88607 | 652.25 | 691 | 674 | 134.8 |
| C | 9 | 247 | 1267587 | 8186.18 | 655 | 659 | 154.8 |
| C | 14 | 67 | 16615 | 103.1 | 655 | 659 | 154.8 |
| C | 1 | 16 | 14384 | 88.68 | 655 | 659 | 154.8 |
| D | 2 | 152 | 185150 | 1121.39 | 665 | 645 | 164.5 |
| D | 8 | 195 | 113512 | 685.98 | 665 | 645 | 164.5 |
| D | 5 | 97 | 42180 | 252.44 | 665 | 645 | 164.5 |
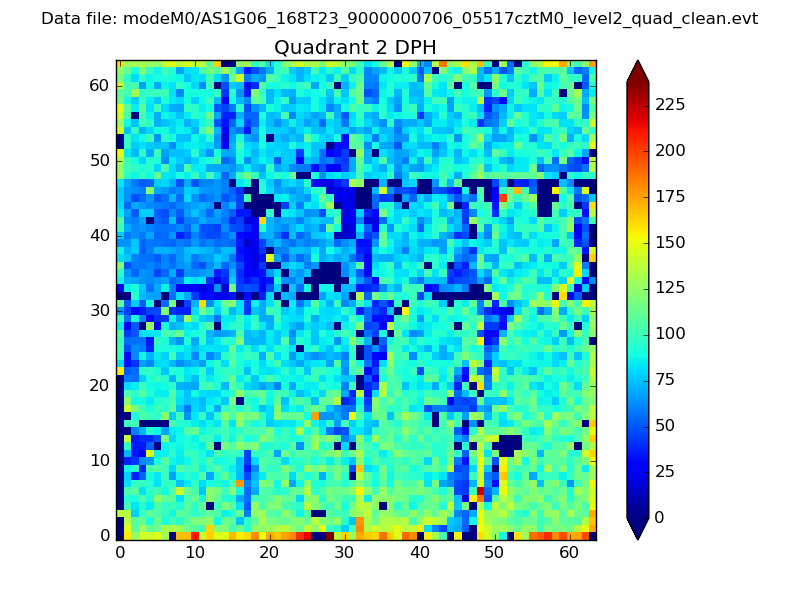
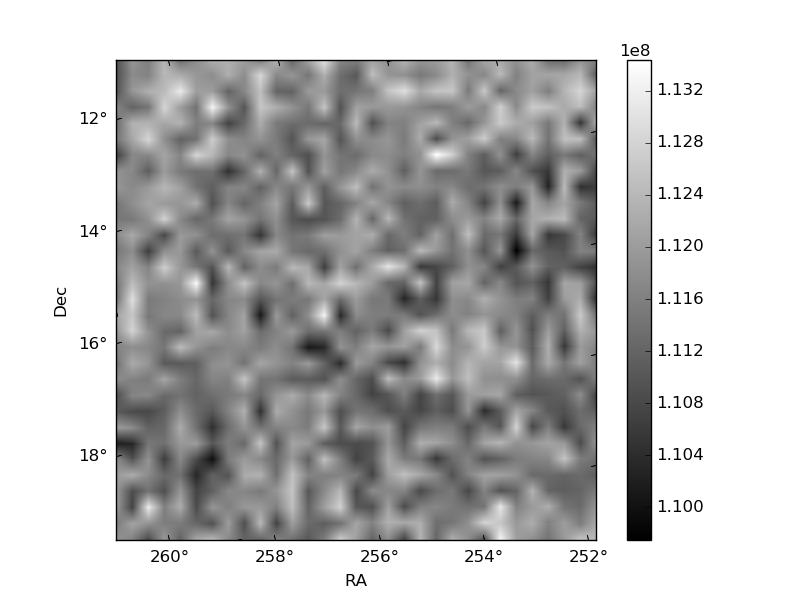
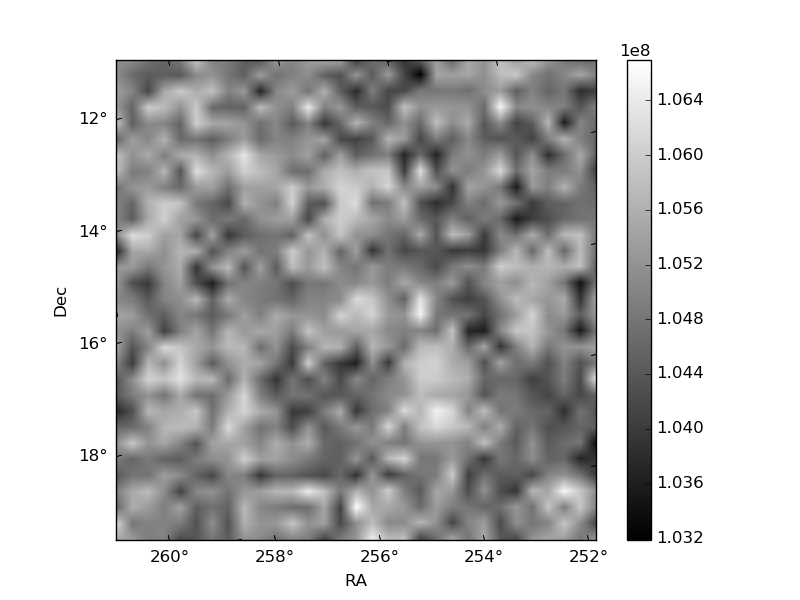
Histogram calculated using DETX and DETY for each event in the final _common_clean file
| Quadrant A | 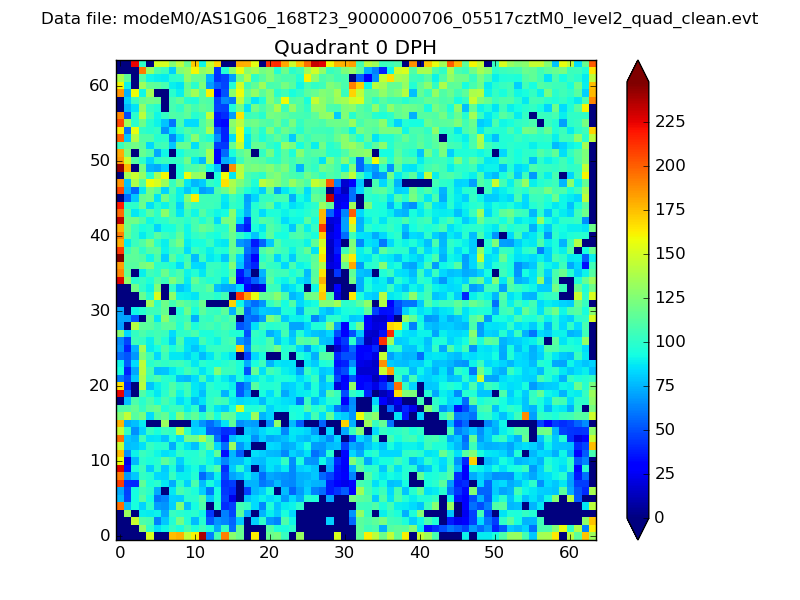 |
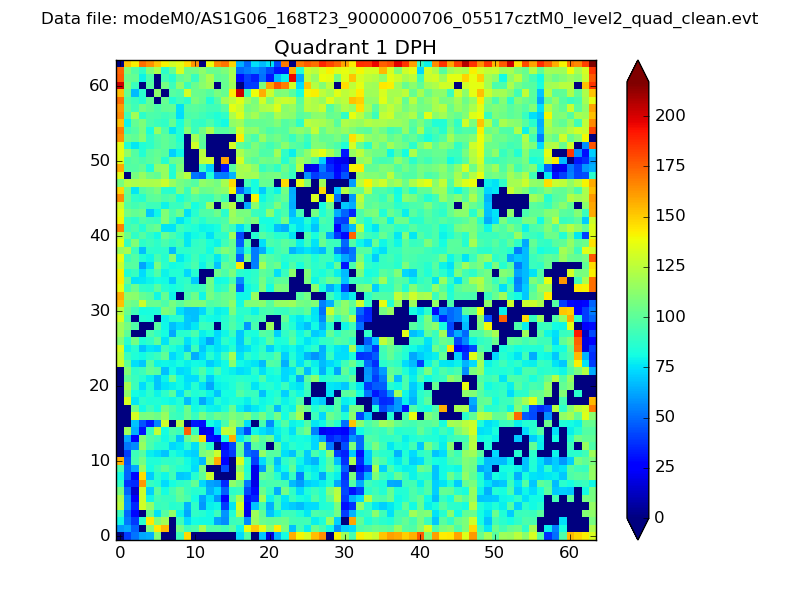 |
Quadrant B |
|---|---|---|---|
| Quadrant D | 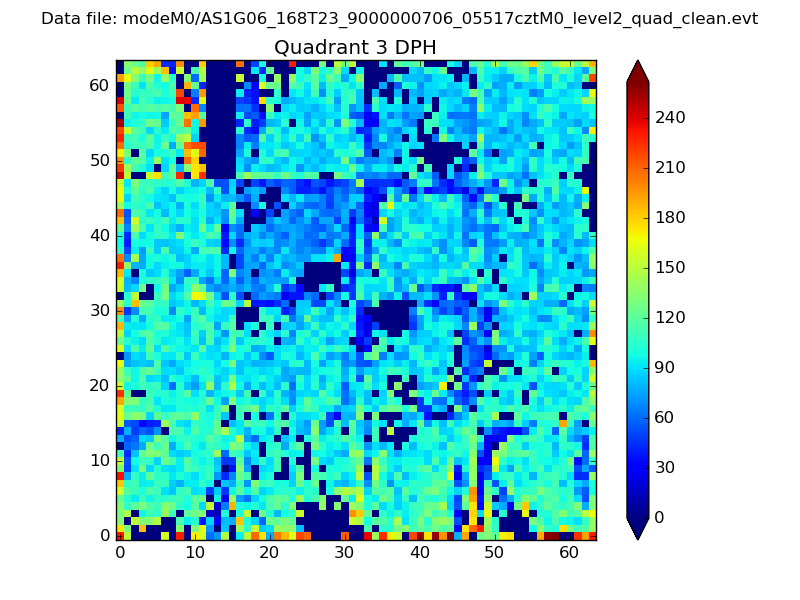 |
 |
Quadrant C |
| Plot type | Count rate plots | Images |
|---|---|---|
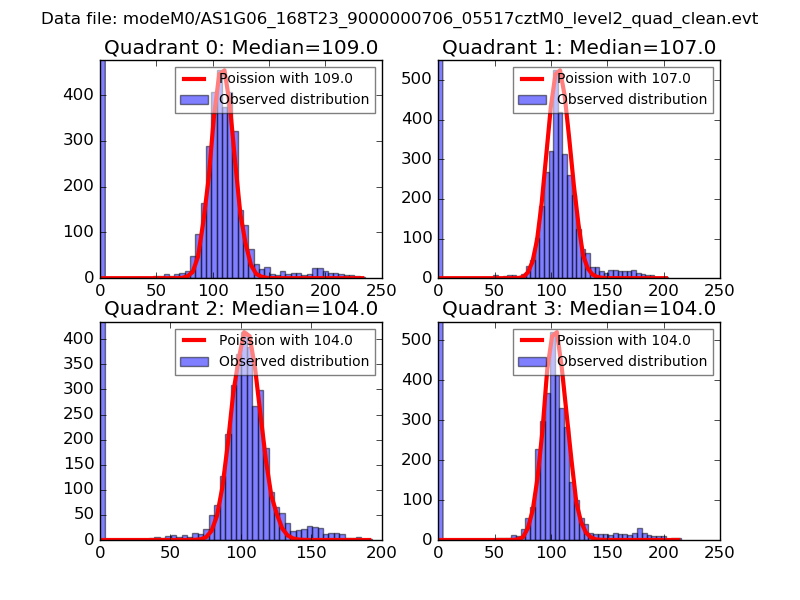
| Comparison with Poisson distribution Blue bars denote a histogram of data divided into 1 sec bins. Red curve is a Poisson curve with rate = median count rate of data. |
 |
 |
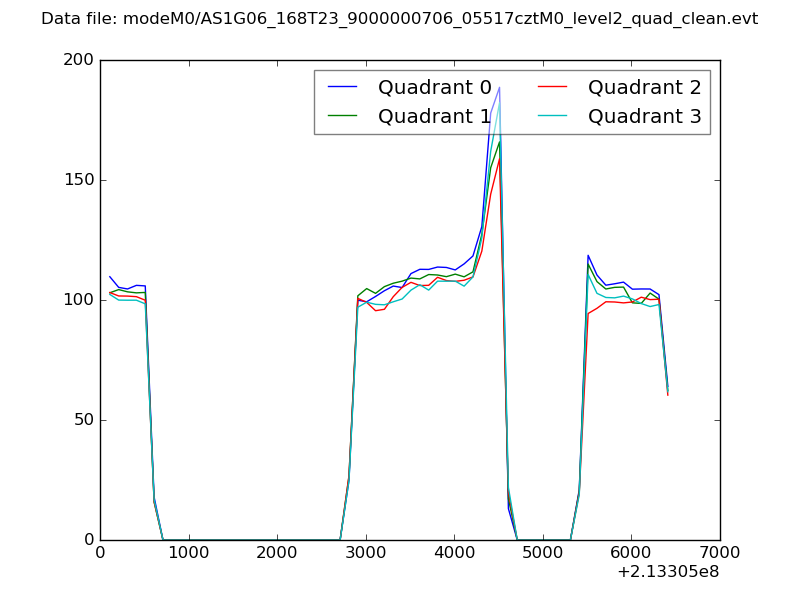
| Quadrant-wise count rates Data is divided into 100 sec bins |
 |
|
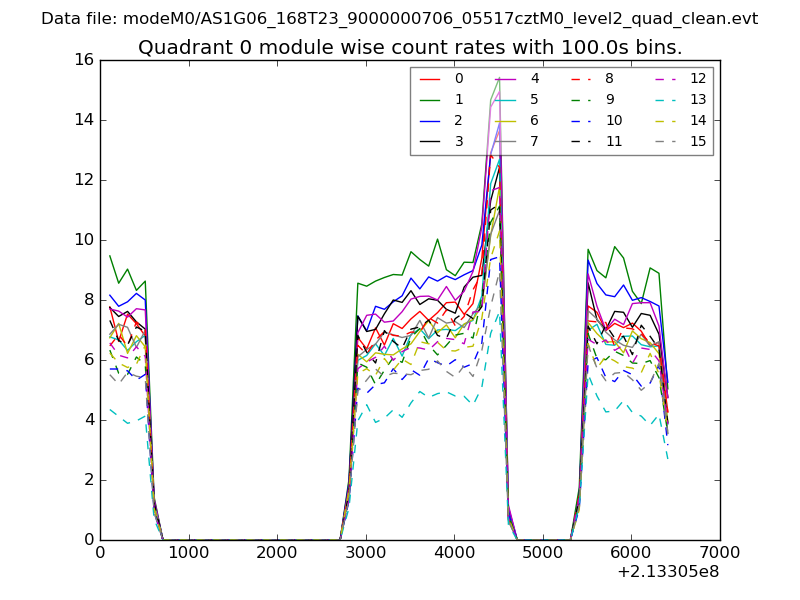
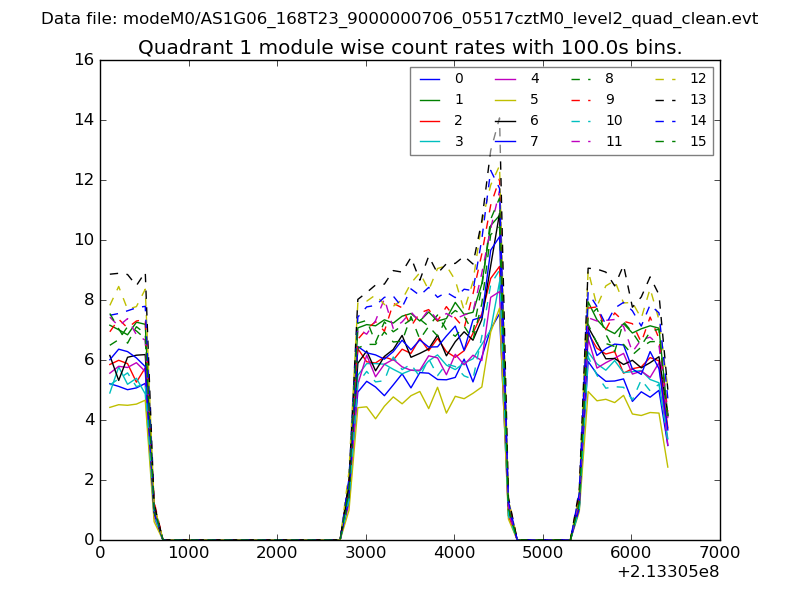
| Module-wise count rates for Quadrant A Data is divided into 100 sec bins |
 |
 |
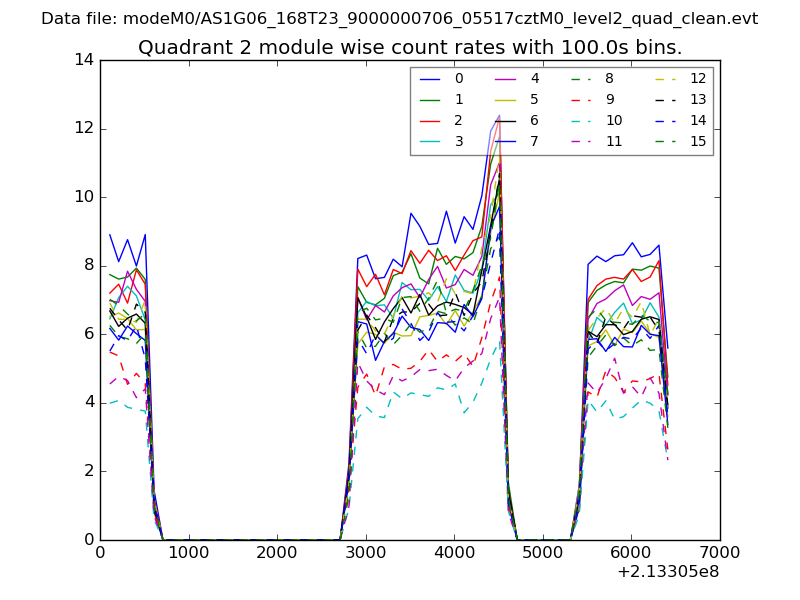
| Module-wise count rates for Quadrant B Data is divided into 100 sec bins |
 |
 |
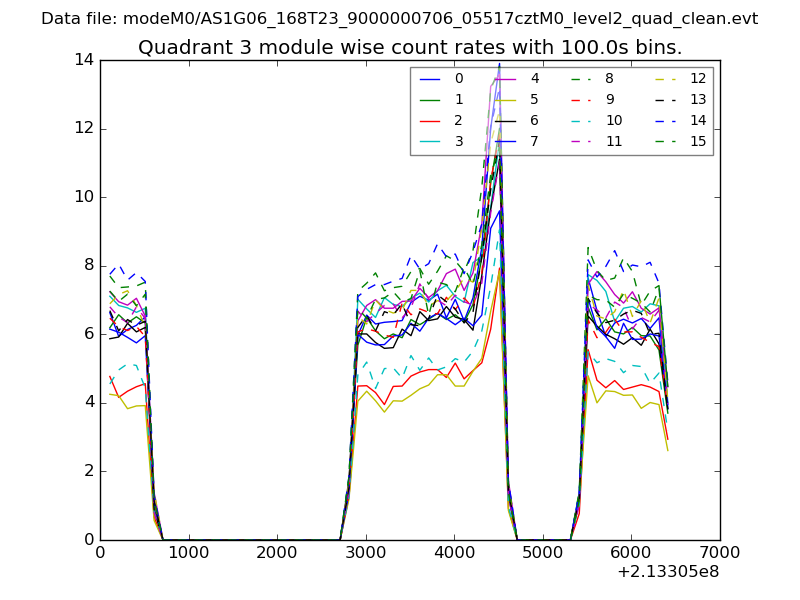
| Module-wise count rates for Quadrant C Data is divided into 100 sec bins |
 |
 |
| Module-wise count rates for Quadrant D Data is divided into 100 sec bins |
 |
 |
| Parameter | Plot |
|---|---|
| CZT HV Monitor | 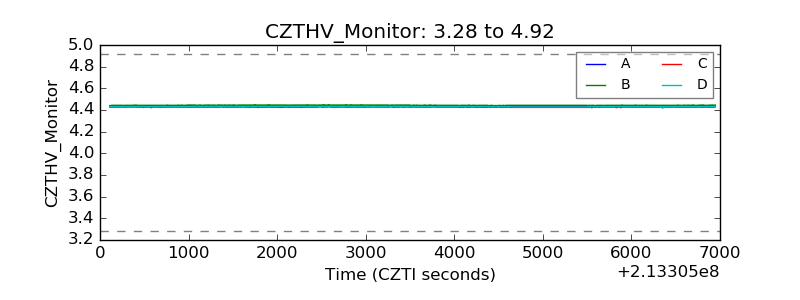 |
| D_VDD | 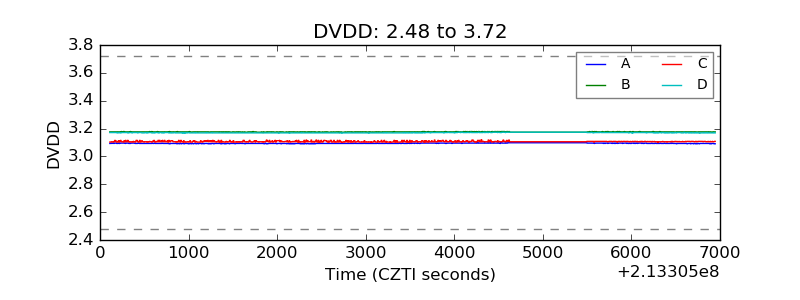 |
| Temperature 1 | 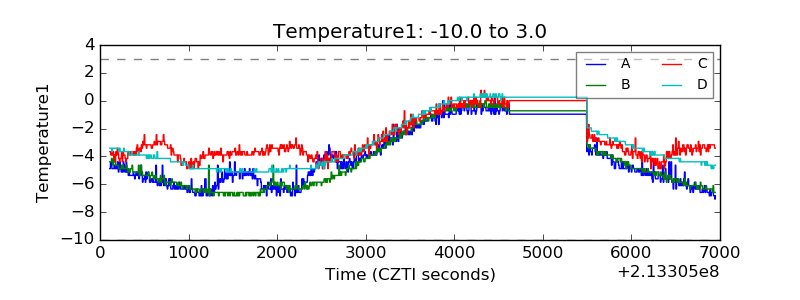 |
| Veto HV Monitor | 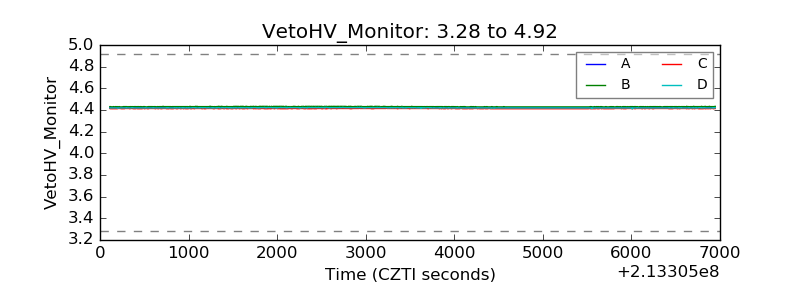 |
| Veto LLD | 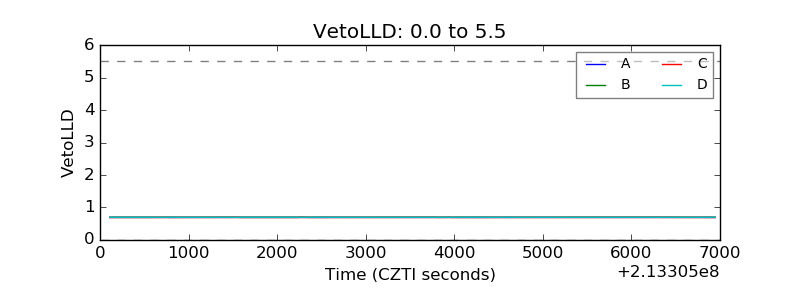 |
| Alpha Counter | 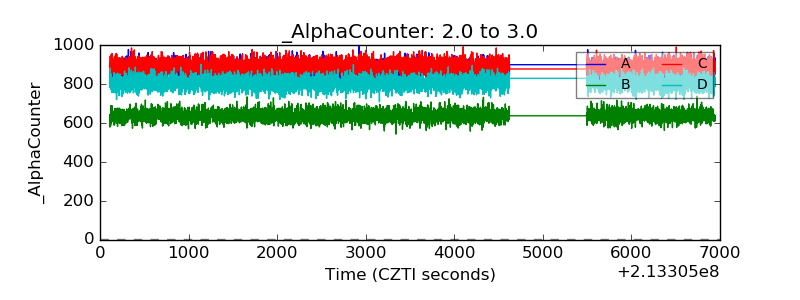 |
| _CPM_Rate | 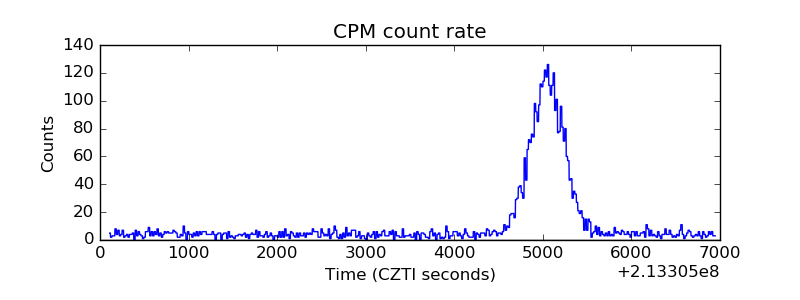 |
| CZT Counter | 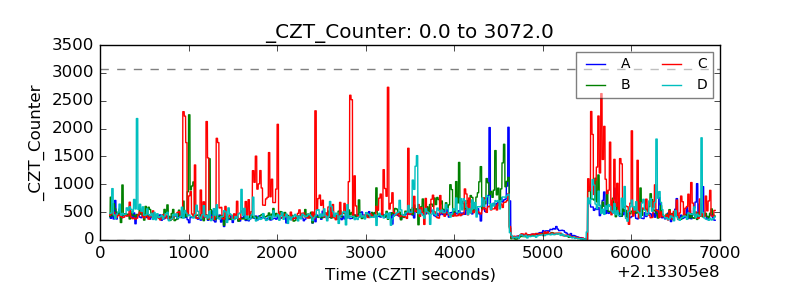 |
| +2.5 Volts monitor |  |
| +5 Volts monitor |  |
| _ROLL_ROT | 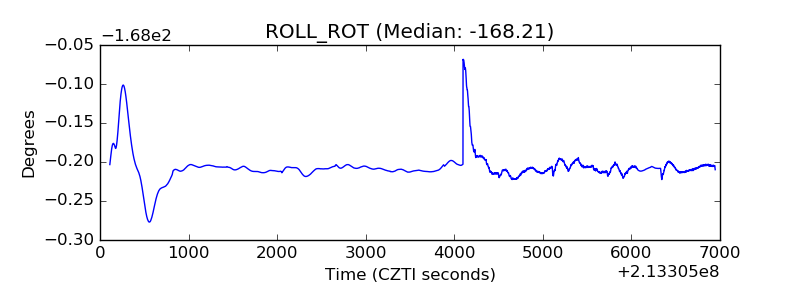 |
| _Roll_DEC | 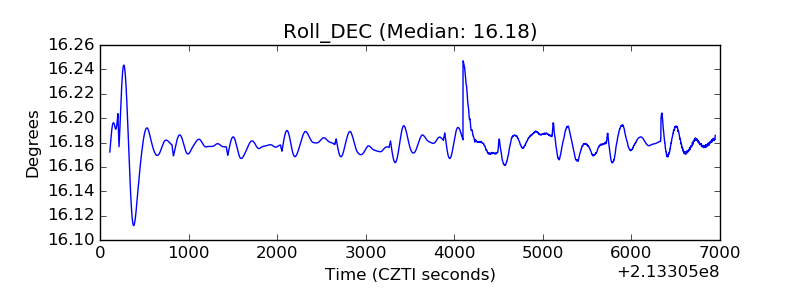 |
| _Roll_RA | 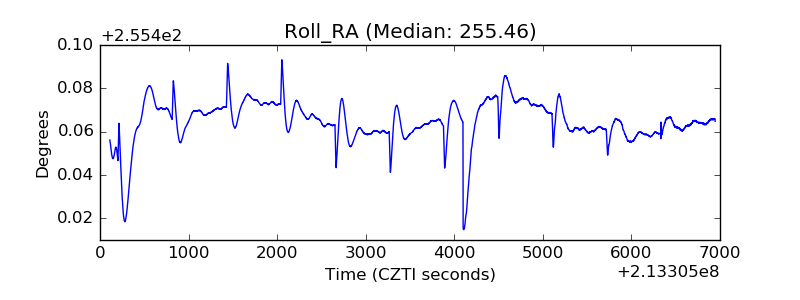 |
| Veto Counter | 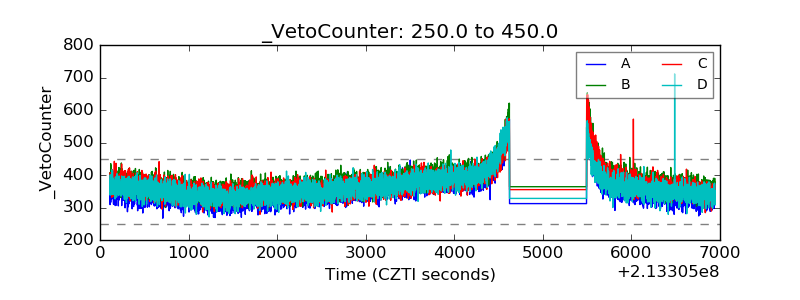 |